Statistics Questions
The best high school and college tutors are just a click away, 24×7! Pick a subject, ask a question, and get a detailed, handwritten solution personalized for you in minutes. We cover Math, Physics, Chemistry & Biology.

Statistics
Statistics15 For which of the following scatter plots would regression be most appropriate A C G ys M 2 ys 4 3 2 1 D 0 3 D M O 01 23 4 567 S 9 X B Ys 3 1 O O C 0 1234567 X 56789 X

Statistics
ProbabilityFigure 8 6 The vertical distance between points A and B represents a tax in the market 22 20 18 16 14 12 10 6 4 Supply Demand 100 200 300 400 500 600 700 800 900 1000 Ob 6 O c 16 O d 4 Quantity Refer to Figure 8 6 When the tax is imposed in this market the price buyers effectively pay is a 10

Statistics
StatisticsSuppose weights of running shoes have an unknown distribution with mean 11 and standard deviation 2 ounces A sample of size n 40 is randomly taken from the population and the mean is taken What is the probability that the resulting mean is more than 11 3 ounces Z 0 7 0 8 0 9 1 0 1 1 0 00 0 01 0 7580 0 7611 0 7881 0 7910 0 8159 0 8186 0 8413 0 8438 0 8643 0 8665 0 02 0 7642 0 7939 0 8212 0 8461 0 8686 Provide your answer below 0 03 0 04 0 05 0 06 0 07 0 08 0 7673 0 7704 0 7734 0 7764 0 7794 0 7823 0 7967 0 7995 0 8023 0 8051 0 8078 0 8106 0 8238 0 8264 0 8289 0 8315 0 8340 0 8365 0 8485 0 8508 0 8531 0 8554 0 8577 0 8599 0 8708 0 8729 0 8749 0 8770 0 8790 0 8810 You may use a calculator or the portion of the z table given above Round the final answer to four decimal places 0 09 0 7852 0 8133 0 8389 0 8621 0 8830

Statistics
StatisticsThe following data set provides a summary statistic of 5 742 interviews of commuters Transporation Type Drove Alone Carpooled Public Transporation Bicycle Walked Other Means Worked at home Mean Number of Workers All 5742 Workers ZO 10 1004 810 2399 147 871 298 214 820 4 Help Copy to Clipboard 20 05 20 025 41 80 Download CSV 20 01 Transporation Type 20 005 Drove Alone US workers earning between 25 000 and 75 000 who did not own vehicles had seven commuting choices normally distributed with a population standard deviation of 276 3 people and an unknown population mean If a random sample of 1925 workers is taken and results in a sample mean of 275 1 square feet find the error bound EBM of the confidence interval with a 99 confidence level Round your answer to TWO decimal places Carpooled Public Transporation Bicycle Walked Other Means Worked at home Mean

Statistics
StatisticsCost of health care The following table presents the mean cost of a hospital stay in 1000s and the number of hospital stays in millions in the United States for each of 10 years Cost 9 8 10 6 11 8 12 5 13 7 Number 34 3 34 2 34 9 35 5 36 4 Number 37 8 19 7 38 2 20 5 38 7 22 3 39 2 24 0 39 5 Source Agency for Healthcare Research and Quality Send data to Excel Part 0 2 Part 1 of 2 Cost 17 3 a Compute the coefficient of determination Round the answer to at least three decimal places

Statistics
StatisticsGiven the following histogram decide if the data is skewed or symmetrical Frequency 300 250 200 150 100 50 0 1 Select the correct answer below The data are skewed to the left The data are skewed to the right The data are symmetric 0 1 2 4 3 Values 5 6 7 8

Statistics
StatisticsAs in the previous problem 64 students are randomly selected from a statistics class If X is the number of students who received a B or above on the final exam then the distribution of X can be approximated with a normal distribution N 32 4 0 where the mean is 32 and standard deviation o is 4 0 Using this approximation find the probability of 36 37 or 38 students receiving a B or above on the final exam You may use the portion of the Standard Normal Table below Z 0 09 0 8133 0 03 0 04 0 05 0 06 0 07 0 08 0 7967 0 7995 0 8023 0 8051 0 8078 0 8106 0 8315 0 8340 0 8365 0 8554 0 8577 0 8599 0 8621 0 8389 0 8238 0 8264 0 8289 0 8485 0 8508 0 8531 0 00 0 01 0 02 0 8 0 7881 0 7910 0 7939 0 9 0 8159 0 8186 0 8212 1 0 0 8413 0 8438 0 8461 1 1 0 8643 0 8665 0 8686 0 8708 0 8729 1 2 0 8849 0 8869 0 8888 0 8907 0 8925 1 3 0 9032 0 9049 0 9066 0 9082 0 9099 0 9236 0 9251 0 8749 0 8770 0 8790 0 8810 0 8830 0 8944 0 8962 0 8980 0 8997 0 9015 0 9115 0 9131 0 9147 0 9162 0 9177 0 9265 0 9279 0 9292 0 9306 0 9319 0 9406 0 9418 0 9429 0 9441 1 4 0 9192 0 9207 0 9222 1 5 0 9332 0 9345 0 9357 0 9370 0 9382 0 9394 1 6 0 9452 0 9463 0 9474 0 9484 0 9495 0 9505 0 9515 0 9525 0 9535 0 9545 0 9599 0 9608 0 9616 0 9625 0 9633 1 7 0 9554 0 9564 0 9573 0 9582 0 9591 Round the final answer to two decimal places Provide your answer below

Statistics
StatisticsSuppose 30 of all households in a certain town own 3 or more vehicles What is the probability that a random sample of 60 households in that town will contain exactly 20 that have 3 or more vehicles Use Excel to find the probability Round your answer to four decimal places

Statistics
Statistics8 900 income freshman to a university take an entrance exam with the top 10 being offered admission to the university s honors program The average test score is 78 with a standard deviation of 11 What must a student score to be invited to join the honors program if only 65 scores are looked at to determine the honors admissions requirement Use the z table below 0 00 0 01 0 02 0 03 0 04 0 05 0 06 0 07 0 08 0 09 1 1 0 864 0 867 0 869 0 871 0 873 0 875 0 877 0 879 0 881 0 883 1 2 0 885 0 887 0 889 0 891 0 893 0 894 0 896 0 898 0 900 0 901 1 3 0 903 0 905 0 907 0 908 0 910 0 911 0 913 0 915 0 916 0 918 1 4 0 919 0 921 0 922 0 924 0 925 0 926 0 928 0 929 0 931 0 932 1 5 0 933 0 934 0 936 0 937 0 938 0 939 0 941 0 942 0 943 0 944 1 6 0 945 0 946 0 947 0 948 0 949 0 951 0 952 0 953 0 954 0 954 Round the 2 score o and I to two decimal places Z score 1 28 Z Sorry that s incorrect Try again 0 78 96 X


Statistics
StatisticsThe following data set provides information about the City of Somerville Assessors Valuation for the fiscal year 2016 Building Type Condominium Condominium Condominium Condominium Condominium Condominium Condominium Residential Residential Land Area in Acres Provide your answer below standard deviation A1 0 0 0 0 0 0 0 0 05502755 0 03826905 Help Living Area 792 0 0 0 0 0 0 0 0 0 0 0 0 0 0 0 0 1818 1400 1280 1850 1089 892 2296 1620 Copy to Clipboard Total Assessed Land Value fx For commercial buildings what is the sample standard deviation of the living area Round your answer to the nearest hundred not hundredth 0 0 0 0 0 0 0 395800 345400 Download CSV FEEDBACK Building Type 395800 345400 A C F B D G 1 Building TlLand Area Living Are Total Asse Total Assessed Parcel Value 2 Commerci 0 208609 3 Commerci 0 217516 4 Commerci 5 547498 5 Commerci 0 186823 6 Commerci 0 552273 7 Condomir 318 625900 730700 3630 423700 741100 59506 10253200 13547100 3780 293300 460200 22017 681300 1214000 1776 0 579500 8 Condomir 0 512100 9 Condomir 0 578900 10 Condomir 11 Condomir 1270 2076 1132 957 1128 1235 1264 678 0 281800 0 266800 481100 12 Condomin 0 0 0 13 Condomir 14 Condomin 470400 442500 0 244300 15 Condomir 16 Condomir 0 323800 0 500000 17 Condomir 18 Condomir 19 Condomir 792 1818 1400 1280 1850 1089 892 0 473000 0 328100 0 644900 0 477300 20 Condomir 21 Condomir 22 Condomir 0 372900 23 Residenti 0 055028 2296 24 Residenti 0 038269 1620 Total Assessed Parcel 746200 557800 MORE INSTRUCTION 323800 500000 473000 328100 644900 477300 372900 746200 557800 SUBMIT

Statistics
StatisticsThe following data set provides information of Households by Total Money Income Race and Hispanic Origin of Householder Race and Hispanic orign of householder and year ALL RACES 2015 Select the correct answer below The data are skewed to the left The data are skewed to the right Not enough infr The data are symetrical Number thousands 125 819 Help Copy to Clipboard Download CSV Percent distribution Looking at the data set for household income for all races in 2015 you see that the median is 56 516 and the mean is 79 263 Which of the following is most likely Total 100 Under 15 11 6

Statistics
StatisticsAssume that X is a Poisson random variable with 6 Calculate the following probabilities Do not round intermediate calculations Round your final answers to 4 decimal places a P X 7 b P X 2 C P X 1

Statistics
StatisticsA video game company sells an average of 132 games a month per store with a standard deviation of 9 games The company is looking to reward stores that are selling in the top 7 How many video games must a store sell in order to b eligible for a reward if the company is only looking at 36 of their stores Use the x table below Round the z score and a to two decimal places Round up to the nearest whole number z score D Provide your answer below X 0 00 0 01 0 02 0 03 0 04 0 05 0 06 0 07 0 08 0 09 1 1 0 864 0 867 0 869 0 871 0 873 0 875 0 877 0 879 0 881 0 883 1 2 0 885 0 887 0 889 0 891 0 893 0 894 0 896 0 898 0 900 0 901 1 3 0 903 0 905 0 907 0 908 0 910 0 911 0 913 0 915 0 916 0 918 1 4 0 919 0 921 0 922 0 924 0 925 0 926 0 928 0 929 0 931 0 932 1 5 0 933 0 934 0 936 0 937 0 938 0 939 0 941 0 942 0 943 0 944 1 6 0 945 0 946 0 947 0 948 0 949 0 951 0 952 0 953 0 954 0 954 games Z games

Statistics
Statistics18 0C 7 13 36 11 23 10 5 24 16 3 22 18 29 14 3138982182192 1 20 14 31 28 12 35 3 2 26 0 32 15 1 0 2587 8 1st 12 CASINO NEWS 1to18 EVEN 13 15 16 17 18 19 20 2nd 12 31 32 33 34 35 36 2 1 2 1 2 1 3rd 12 ODD 19t036 a What is the probability of winning the bet b What is the probability of losing the bet c How much money would one win if the bet succeeds d How much money would one lose if the bet fails e What is the expected value of the bet f If you repeat 20 trials of this experiment what is the probability that you will win at leas once g What is the expected value of the full 20 trial experiment from part f

Statistics
Statisticshe table below lists the height h in cm the age a in years the gender g 1 Male 0 Female and the weight w in kg some college students Height Age Gender Weight 20 79 22 47 20 87 19 86 20 59 We wish to fit a linear function of the form o these data Find the best approximation of this form using least squares 50 6 1 0 8 2 16 8 16 8 171 155 181 178 167 1 0 1 1 0 f t co c h c a c3g

Statistics
StatisticsThe estimated regression equation 6 1 9 36x was obtained using the x y pairs of observations in the table below Determine the missing values Report x and y as whole numbers Report and residuals accurate to 2 decimal places x 66 49 Y 611 545 60 427 30 754 90 Residual 39 70 27 90 37 74

Statistics
StatisticsThe following table shows the mean standard deviation 10 25 75 and 90 percentiles for students grades in classes A and B Class A Class B Mean SD P10 P25 P75 P90 67 10 37 58 76 97 26 36 41 67 89 74 Do not enter symbol into the answer boxes Round to 1 decimal place if necessary to round a If the distribution of scores in Class A is symmetric then their median is b The top 25 of students in Class A scored at least C of students in Class A scored between 37 and 97 d The interquartile range for Class A is e The coefficient of variation for Class A is f Scores in Class B are positively skewed symmetric negatively skewed O

Statistics
StatisticsEnergy consumption The following table presents the average annual energy expenditures in dollars for housing units of various sizes in square feet Energy Expenditure 1148 1269 1726 1866 1971 2141 2210 2534 Size 250 750 1250 1750 2250 2750 3250 3750 Send data to Excel Part 0 2 Part 1 of 2 a Compute the coefficient of determination Round the answer to at least three decimal places The coefficient of determination is
Statistics
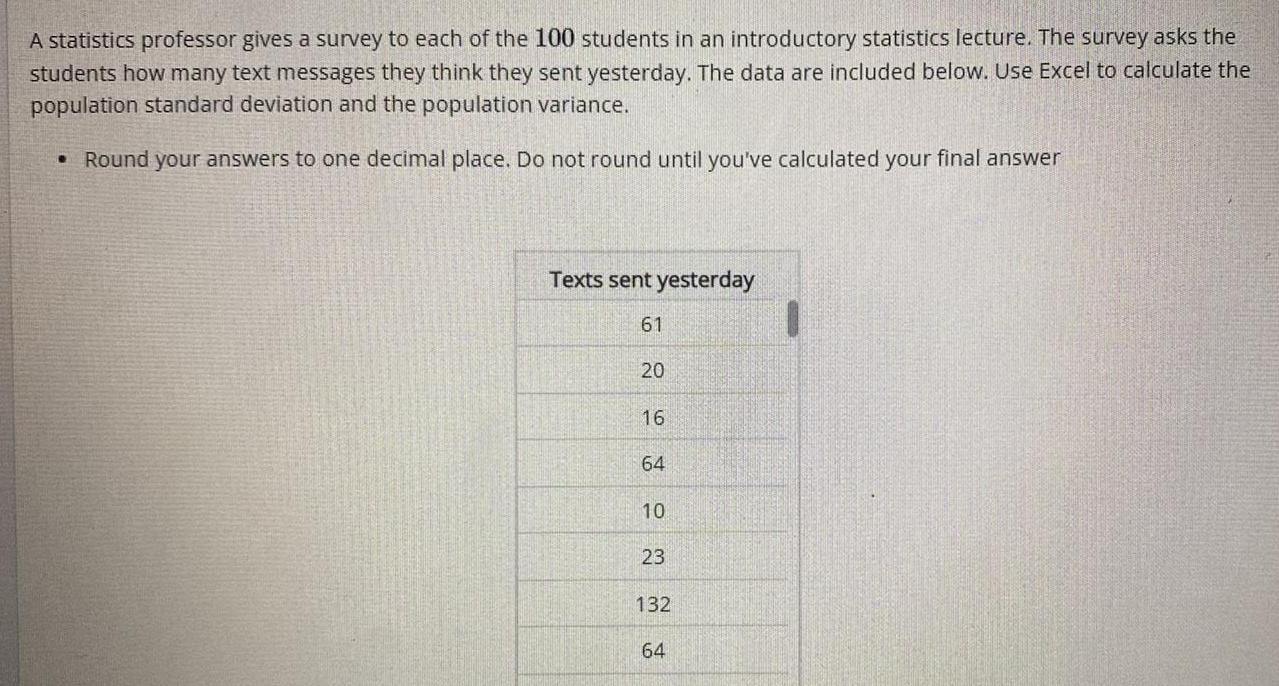
StatisticsA statistics professor gives a survey to each of the 100 students in an introductory statistics lecture The survey asks the students how many text messages they think they sent yesterday The data are included below Use Excel to calculate the population standard deviation and the population variance Round your answers to one decimal place Do not round until you ve calculated your final answer R Texts sent yesterday 61 20 16 64 10 23 132 64

Statistics
StatisticsTwo swimmers Angie and Beth from different teams wanted to find out who had the fastest time when compared to her team Swimmer Angie Beth Time sec Angie z 26 2 27 3 Beth z Team Mean Time 27 2 30 1 Provide your answer below Team Standard Compute the z scores for Angie and Beth Deviation 0 8 1 4

Statistics
StatisticsSuppose the shipping periods in days for medical equipment are normally distributed If the population standard deviation is 3 days what minimum sample size is needed to be 90 confident that the sample mean is within 1 day of the true population mean Use the table above for the z score Round only at the final step Provide your answer below 20 10 20 05 70 025 20 01 20 005 1 282 1 645 1 960 2 326 2 576 medical equipment

Statistics
ProbabilityThe time it takes for a fisherman to catch a fish is exponentially distributed with an average wait time of 33 minutes Identify the parameters of the exponential distribution Enter your answer for A as a fraction Provide your answer below 2 0 4 0 0 0

Statistics
StatisticsFor the following data set 8 4 X y Send data to Excel Part 0 2 Part 1 of 2 4 3 6 31 12 36 9 0 3 4 5 3 11 16 a Use a TI 84 calculator to compute the coefficient of determination Round the answer to at least three decimal places

Statistics
ProbabilityAs in the previous problem 56 customers are randomly selected at Sun Valley Bank If X is the number of customers who have a high yield savings account then the distribution of X can be approximated with a normal distribution N 28 3 7 where the mean u is 28 and standard deviation o is 3 7 Using this approximation find the probability of 30 or 31 customers having a high yield savings account You may use the portion of the Standard Normal Table below Z 0 00 0 01 0 02 0 03 0 04 0 05 0 06 0 07 0 08 0 09 0 3 0 6179 0 6217 0 6255 0 6293 0 6331 0 6368 0 6406 0 6443 0 6480 0 6517 0 4 0 6554 0 6591 0 6628 0 6664 0 6700 0 6736 0 6772 0 6808 0 6844 0 6879 0 5 0 6915 0 6950 0 6985 0 7019 0 7054 0 7088 0 7123 0 7157 0 7190 0 7224 0 6 0 7257 0 7291 0 7324 0 7357 0 7389 0 7422 0 7454 0 7486 0 7517 0 7549 0 7 0 7580 0 7611 0 7642 0 7673 0 7704 0 7734 0 7764 0 7794 0 7823 0 7852 0 8 0 7881 0 7910 0 7939 0 7967 0 7995 0 8023 0 8051 0 8078 0 8106 0 8133 0 9 0 8159 0 8186 0 8212 0 8238 0 8264 0 8289 0 8315 0 8340 0 8365 0 8389 Round the final answer to two decimal places

Statistics
StatisticsAs stated in the previous problem in a small town 50 of single family homes have a front porch 48 single family houses are randomly selected If X represents the number of single family homes with a porch then the distribution of X can be approximated with a normal distribution N 24 3 5 where the mean is 24 and standard deviation o is 3 5 Using this approximation find the probability that 27 or 28 single family homes will have a porch You may use the portion of the Standard Normal Table below Z 0 00 0 01 0 02 0 03 0 04 0 05 0 06 0 07 0 08 0 09 0 6 0 7257 0 7291 0 7324 0 7357 0 7389 0 7422 0 7454 0 7486 0 7517 0 7549 0 7 0 7580 0 7611 0 7642 0 7673 0 7704 0 7734 0 7764 0 7794 0 7823 0 7852 0 8 0 7881 0 7910 0 7939 0 7967 0 7995 0 8023 0 8051 0 8078 0 8106 0 8133 0 9 0 8159 0 8186 0 8212 0 8238 0 8264 0 8289 0 8315 0 8340 0 8365 0 8389 1 0 0 8413 0 8438 0 8461 0 8485 0 8508 0 8531 0 8554 0 8577 0 8599 0 8621 1 1 0 8643 0 8665 0 8686 0 8708 0 8729 0 8749 0 8770 0 8790 0 8810 0 8830 1 2 0 8849 0 8869 0 8888 0 8907 0 8925 0 8944 0 8962 0 8980 0 8997 0 9015 1 3 0 9032 0 9049 0 9066 0 9082 0 9099 0 9115 0 9131 0 9147 0 9162 0 9177 1 4 0 9192 0 9207 0 9222 0 9236 0 9251 0 9265 0 9279 0 9292 0 9306 0 9319 Round the final answer to two decimal places

Statistics
StatisticsSuppose that the weight X in pounds of a 40 year old man is a normal random variable with mean 147 and standard deviation 16 Calculate P 120 x 153 Round your answer to four decimal places Provide your answer below P 120 x 153

Statistics
StatisticsThe following table is set up to calculate the standard deviation of a sample of 6 credit card balances a A negative balance indicates an overpayment 1 Fill in the missing values Card 1 2 3 4 5 6 Total X 33 82 53 258 x 10 5 46 12 1521 2 The sample standard deviation 8 25 2116 144 100 Report the sample standard deviation accurate to 2 decimal places
Statistics
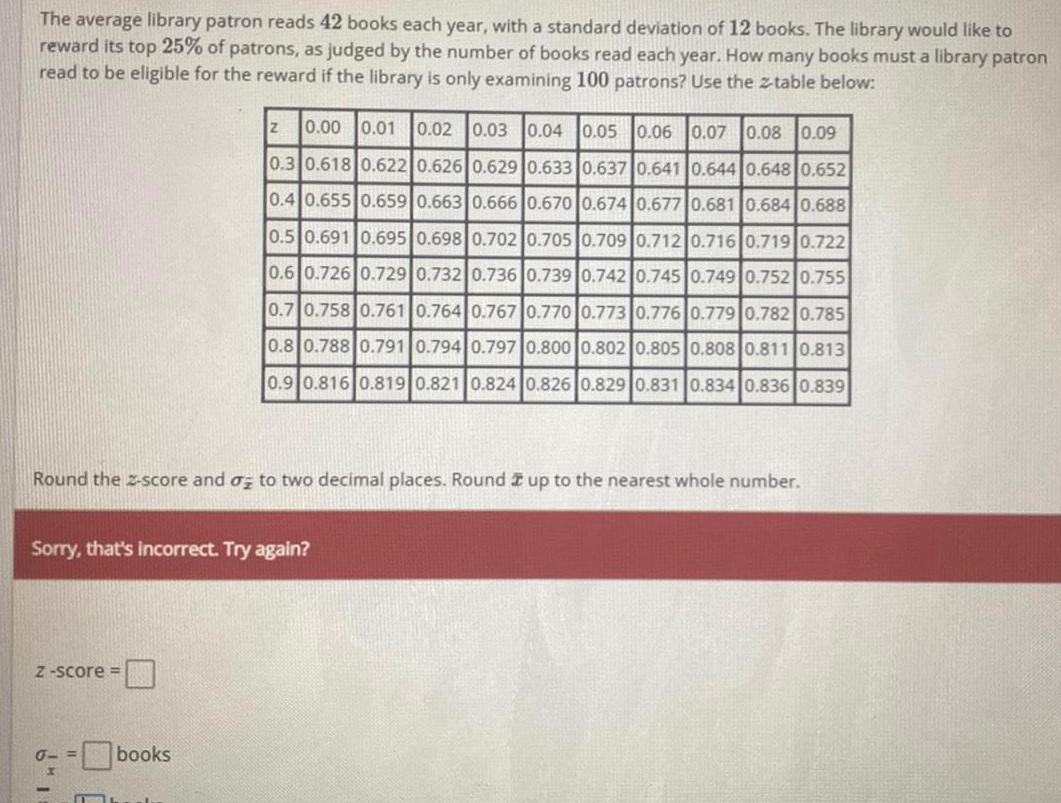
StatisticsThe average library patron reads 42 books each year with a standard deviation of 12 books The library would like to reward its top 25 of patrons as judged by the number of books read each year How many books must a library patron read to be eligible for the reward if the library is only examining 100 patrons Use the z table below 0 00 0 01 0 02 0 03 0 04 0 05 0 06 0 07 0 08 0 09 0 3 0 618 0 622 0 626 0 629 0 633 0 637 0 641 0 644 0 648 0 652 0 4 0 655 0 659 0 663 0 666 0 670 0 674 0 677 0 681 0 684 0 688 0 5 0 691 0 695 0 698 0 702 0 705 0 709 0 712 0 716 0 719 0 722 0 6 0 726 0 729 0 732 0 736 0 739 0 742 0 745 0 749 0 752 0 755 0 7 0 758 0 761 0 764 0 767 0 770 0 773 0 776 0 779 0 782 0 785 0 8 0 788 0 791 0 794 0 797 0 800 0 802 0 805 0 808 0 811 0 813 0 9 0 816 0 819 0 821 0 824 0 826 0 829 0 831 0 834 0 836 0 839 Round the z score and a to two decimal places Round up to the nearest whole number Z score Z Sorry that s incorrect Try again 0 books

Statistics
StatisticsThe height of seaweed of all plants in a body of water are normally distributed with a mean of 10 cm and a standard deviation of 2 cm Which length separates the lowest 30 of the means of the plant heights in a sampling distribution C sample size 15 from the highest 70 Round your answer to the nearest hundredth Use the z table below Z 0 00 0 01 0 02 0 03 0 04 0 05 0 06 0 07 0 08 0 09 0 8 0 212 0 209 0 206 0 203 0 201 0 198 0 195 0 192 0 189 0 187 0 7 0 242 0 239 0 236 0 233 0 230 0 227 0 224 0 221 0 218 0 215 0 6 0 274 0 271 0 268 0 264 0 261 0 258 0 255 0 251 0 248 0 245 0 5 0 309 0 305 0 302 0 298 0 295 0 291 0 288 0 284 0 281 0 278 0 4 0 345 0 341 0 337 0 334 0 330 0 326 0 323 0 319 0 316 0 312 0 3 0 382 0 378 0 374 0 371 0 367 0 363 0 359 0 356 0 352 0 348 Round the z score and to two decimal places Provide your answer below Z score

Statistics
StatisticsAs in the previous problem a fair coin is flipped 60 times If X is the number of heads then the distribution of X can be approximated with a normal distribution N 30 3 9 where the mean u is 30 and standard deviation o is 3 9 Using this approximation find the probability of flipping 34 or 35 heads You may use the portion of the Standard Normal Table below 0 10 Select the correct answer below 0 28 O 0 35 0 44 Z 0 01 0 02 0 03 0 04 0 05 0 07 0 06 0 08 0 09 0 8078 0 8106 0 8133 0 8 0 7910 0 7939 0 7967 0 8051 0 7995 0 8023 0 8238 0 8264 0 8289 0 8315 0 8340 0 8365 0 8389 0 9 0 8159 0 8186 0 8212 1 0 0 8413 0 8438 0 8461 0 8485 0 8508 0 8531 0 8554 0 8577 0 8599 0 8621 1 1 0 8643 0 8665 0 8686 0 8708 0 8729 0 8749 0 8770 0 8790 0 8810 0 8830 1 2 0 8849 0 8869 0 8888 0 8907 0 8925 0 8944 0 8962 0 8980 0 8997 0 9015 1 3 0 9032 0 9049 0 9066 0 9082 0 9099 0 9115 0 9131 0 9147 0 9162 0 9177 1 4 0 9192 0 9207 0 9222 0 9236 0 9251 0 9265 0 9279 0 9292 0 9306 0 9319 0 73 0 00 0 7881

Statistics
StatisticsSuppose heights of seasonal pine saplings have an unknown distribution with mean 265 and standard deviation 18 millimeters A sample of size n 41 is randomly taken from the population and the mean is taken What is the probability that the resulting mean is less than 262 9 millimeters 0 00 0 01 0 8 0 2119 0 2090 0 7 0 2420 0 2389 0 6 0 2743 0 2709 0 5 0 3085 0 3050 Z You may use a calculator or the portion of the 2 table given above Round the final answer to four decimal places Provide 0 02 0 03 0 04 0 05 0 2061 0 2033 0 2005 0 1977 0 2358 0 2327 0 2296 0 2266 0 2676 0 2643 0 2611 0 2578 0 3015 0 2981 0 2946 0 2912 your answer below 0 06 0 07 0 08 0 1949 0 1922 0 1894 0 2236 0 2206 0 2177 0 2546 0 2514 0 2483 0 2877 0 2843 0 2810 0 09 0 1867 0 2148 0 2451 0 2776

Statistics
ProbabilityQUESTION 9 S POINTS The weight of a chocolate bar is 4 4 ounces but can vary Let W be a random variable that represents the weight of a chocolate bar The probability density function of Wis given below Move the left and right sliders so that the area of the blue shaded region represents the probability that a chocolate bar is at least 3 ounces but no more than 10 ounces Provide your answer below 0 2 0 18 0108 10 RESET 12 13 left Area under ourve 0 79046592 14 4 11 8 right 9 11 12 10 Weight s

Statistics
StatisticsFor employees at a large company the mean number of overtime hours worked each week is 9 2 hours with a population standard deviation of 1 6 hours A random sample of 49 employees was taken and the probability that the mean number of overtime hours will exceed 9 3 hours was determined Was the probability a Left tail Right tail or Interval Probability What is the probability that the mean overtime hours for the sample will exceed 9 3 hours Select all that apply below Select the two correct answers that apply below You may use a calculator or the portion of the z table given below Round your answer to three decimal places if necessary Select all that apply Left Tail Right Tail Interval P Z 9 3 0 330 P Z 9 3 0 476 P Z 9 3 0 670 z 0 00 0 01 0 02 0 03 0 04 0 05 0 06 0 07 0 08 0 09 0 00 500 0 504 0 508 0 5120 516 0 520 0 524 0 528 0 532 0 536 0 1 0 540 0 544 0 548 0 5520 556 0 560 0 564 0 567 0 571 0 575 0 2 0 579 0 583 0 587 0 591 0 595 0 599 0 603 0 606 0 610 0 614 0 3 0 618 0 622 0 626 0 629 0 633 0 637 0 641 0 644 0 648 0 652 0 4 0 655 0 659 0 663 0 6660 670 0 674 0 677 0 681 0 684 0 688 0 5 0 691 0 695 0 698 0 702 0 705 0 709 0 712 0 716 0 719 0 722 0 6 0 726 0 729 0 732 0 736 0 739 0 742 0 745 0 749 0 752 0 755 0 7 0 758 0 761 0 764 0 7670 770 0 773 0 776 0 779 0 782 0 785

Statistics
StatisticsAs in the previous problem a fair coin is flipped 68 times If X is the number of heads then the distribution of X can be approximated with a normal distribution N 34 4 1 where the mean is 34 and standard deviation o is 4 1 Using this approximation find the probability of flipping 38 or 39 heads You may use the portion of the Standard Normal Table below Z 0 00 0 01 0 02 0 03 0 04 0 7 0 7580 0 7611 0 7642 0 8 0 7881 0 7910 0 7939 0 7673 0 7704 0 7967 0 7995 0 9 0 8159 0 8186 0 8212 0 8238 0 8264 1 0 0 8413 0 8438 0 8461 0 8485 0 8508 0 8531 0 8554 0 8577 0 8599 0 8621 1 1 0 8643 0 8665 0 8686 0 8708 0 8729 0 8749 0 8770 0 8790 0 8810 0 8830 1 2 0 8849 0 8869 0 8888 0 8907 0 8925 0 8944 0 8962 0 8980 0 8997 0 9015 1 3 0 9032 0 9049 0 9066 0 9082 0 9099 0 9115 0 9131 0 9147 0 9162 0 9177 Round the final answer to two decimal places Provide your answer below 0 05 0 06 0 07 0 08 0 09 0 7734 0 7764 0 7794 0 7823 0 7852 0 8051 0 8078 0 8106 0 8133 0 8023 0 8289 0 8315 0 8340 0 8365 0 8389

Statistics
Statisticshe table below shows the frequency distribution of the rainfall on 52 consecutive uesdays in a certain city Use the frequency distribution to construct a istogram Do the data appear to have a distribution that is pproximately normal Class 0 0 19 0 20 0 39 0 40 0 59 0 60 0 79 0 80 0 99 1 00 1 19 1 20 1 39 Part 1 of 2 Frequency 25 11 5 3 5 2 1 Choose the correct histogram below A OB O C Points 0 of 1 30 20 10 0 0 0 0 2 0 4 0 6 0 8 1 0 1 2 1 4 30 20 10 0 0 0 0 2 0 4 0 6 0 8 1 0 1 2 1 4 30 20 10 0 0 0 0 2 0 4 0 6 0 8 1 0 1 2 1 4 Q Q 20 Q Q

Statistics
Statisticsstudy was conducted to determine how people get jobs The table below lists ata from 400 randomly selected subjects ob Sources Help wanted ads H Executive search firms E Networking N Mass mailing M 00 50 00 50 00 50 0 MNHE Frequency 43 17 68 294 Choose the correct pie chart C Mass mailing M Networking N Help wanted ads H Executive search firms E Help wanted ads H Executive search firms E Networking N Mass mailing M Help wanted ads H Executive search firms E Networking N Mass mailing M

Statistics
Statistics8 r t sin 3t cos 3t 3t find a the arc length from 1 0 1 5m to 0 1 67 b the unit tangent vector at point 0 1 67 c the velocity acceleration vectors at point 0 1 67 d the curvaturekat point 0 1 67 16

Statistics
StatisticsGiven below are the numbers of indoor movie theaters listed in order by row for each year Use the given data to onstruct a time series graph What is the trend How does this trend compare to the trend for drive in movie theaters Click the icon to view the indoor movie theater data Construct a time series graph with the year on the horizontal axis and the number of theaters on the vertical axis A OB O C 36000 32000 28000 24000 20000 0 4 8 1216 Q 36000 32000 28000 24000 20000 0 4 8 1216 Q Q Indoor Movie Theater Data Year 1 2 3 4 5 6 7 8 9 www 10 11 12 13 14 15 16 17 36000 32000 28000 24000 20000 0 4 8 1216 Number of Indoor Theaters 20 595 20 382 21 907 22 701 23 740 26 335 24 789 28 141 26 995 28 632 31 050 32 377 36 448 33 917 34 490 36 722 35 361 O R D X Number of Drive in Mo m 3000 360003 32000 280005 240005 20000 0 4 8 1216 2000 1000 0 Q Year

Statistics
StatisticsFor the given cata a find the test statistic b find the standardized test statistic c decide whether the standardized test statistic is in the rejection region and d decide whether you should rejec fail to reject the null hypothesis The samples are random and independent Claim x 0 01 Sample statistics x 1230 n 30 x 1200 and n 50 Population parameters a 80 and 0 110 a The test statistic for is 30 b The standardized test statistic for is CO

Statistics
StatisticsClick on the icon to view the data sets etermine the boxplot for the actors data A Q O C 20 30 40 50 60 70 80 90 20 30 40 50 60 70 80 90 Q Q Q Data table Actors Age Data 42 38 44 45 38 43 47 45 40 51 60 38 60 44 34 44 37 53 42 54 Actresses Age Data 23 34 32 35 35 42 43 43 36 35 78 25 44 32 62 24 36 26 44 36 54 47 61 32 Print OB O D 20 30 40 50 60 70 80 90 20 30 40 50 60 70 80 90 27 33 52 38 47 42 34 35 31 42 48 34 44 75 55 47 55 29 25 32 31 25 33 35 26 40 26 30 29 29 30 26 32 76 28 33 Done Full data set Q O Q Q G X

Statistics
Statisticsf The mode in the distribution of scores below is X 5 543210 True False akaunt DEPUTA Ganthandel DE SGE L 1 2 3 4 5 6 7 8 9 10 X

Statistics
StatisticsConstruct a 95 confidence interval for with the sample statistics for mean calorie content of wo bakeries specialty pies and confidence interval construction formula below Assume the populations are approximately normal with equal variances Confidence interval when variances are equal 1 to H H x x t 1 1 n n n2 x1 x2 t where 1 n2 n 1 s n 1 s 2 n n 2 Enter the endpoints of the interval H H H H Round to the nearest integer as needed and d f n n 2 Bakery A X 1863 cal S 167 cal n 7 Bakery B x2 1666 cal S2 203 cal n n2 14

Statistics
StatisticsA population with a mean of 9 has EX 54 How many scores are in the population N 9 N 7 ON 6 N 14

Statistics
StatisticsQUESTIONS 31 THRU 33 An Internet based e learning company has begun using new online statistics content to replace a textbook Since the main competition is hardback textbooks before the company decides what price to charge students for the new product it wants to know the average price of all hardback statistics textbooks currently on the market The research department at this e learning company took a random sample of 20 such textbooks and collected information on their prices The data could then be used to compute a confidence interval for the true mean price of hardback statistics textbooks Assume the population of these textbook prices is normally distributed Question 31 Choose the formula that should be used to calculate a confidence interval for the true mean price of hardback statistics textbooks Can t answer this question based on the information given p z p 1 p 1 pts

Statistics
Probabilitymagazine claims that the mean amount spent by a customer at Burger Stop is greater than the mean amount spent by a customer at Fry World The results for samples of customer transactions for the wo fast food restaurants are shown below At 0 10 can you support the magazine s claim Assume the population variances are equal Assume the samples are random and independent and the opulations are normally distributed Complete parts a through e below Burger Stop X 11 36 S1 0 81 n 17 Fry World X2 10 73 S2 0 65 n2 8 he null hypothesis Ho is The alternative hypothesis Ha is Which hypothesis is the claim The null hypothesis Ho The alternative hypothesis Ha o Find the critical value s and identify the rejection region s Enter the critical value s below

Statistics
StatisticsFor a data set of brain volumes cm and IQ scores of nine males the linear correlation coefficient is r 0 373 Use the table available below to find the critical values of r Based on a comparison of the linear correlation coefficient r and the critical values what do you conclude about a linear correlation Click the icon to view the table of critical values of r The critical values are Type integers or decimals Do not round Use a comma to separate answers as needed Table of Critical Values of r Number of Pairs of Data n 4 5 6 7 8 9 10 11 12 Critical Value of r 0 950 0 878 0 811 0 754 0 707 0 666 0 632 0 602 0 576 Save X

Statistics
ProbabilityWaiting times in minutes of customers at a bank where all customers enter a single waiting line and a bank where customers wait in individual lines at th different teller windows are listed below Find the coefficient of variation for each of the two sets of data then compare the variation Bank A single line 6 6 6 6 6 7 6 9 7 2 7 3 7 4 7 7 7 7 7 8 Bank B individual 4 0 5 3 5 8 6 3 6 7 7 7 7 7 8 6 9 3 9 9 lines The coefficient of variation for the waiting times at Bank A is Round to one decimal place as needed

Statistics
StatisticsClick the icon The margin of erro d f 1 2 3 4 5 6 7 8 9 10 11 12 13 14 15 16 17 18 19 20 21 22 23 24 25 26 27 28 29 30 31 32 33 34 35 36 37 confidence c One tail a Two tails a Homework Homework 4 Chapter 06 0 80 0 90 0 99 0 95 0 98 0 025 0 01 0 005 0 10 0 05 0 20 0 10 0 05 0 02 0 01 3 078 6 314 12 706 31 821 63 657 2 920 4 303 6 965 9 925 1 886 1 638 2 353 3 182 4 541 5 841 1 533 2 132 2 776 3 747 4 604 1 476 2 015 2 571 3 365 4 032 5 1 440 1 943 2 447 3 143 1 415 1 895 2 365 2 998 1 397 1 860 2 306 2 896 3 355 1 383 1 833 2 262 2 821 3 250 1 372 1 812 2 228 2 764 3 169 10 1 363 1 796 2 201 2 718 3 106 11 3 055 12 1 356 1 782 2 179 1 350 1 771 2 160 1 345 1 761 2 145 1 341 1 753 2 681 2 650 2 624 2 977 1 323 1 721 21 1 321 1 717 1 319 1 714 1 318 1 711 2 064 2 492 3 012 13 14 2 131 2 602 2 947 15 1 337 1 746 2 120 2 583 2 921 16 1 333 1 740 2 110 2 567 2 898 17 1 330 1 734 2 101 2 552 2 878 18 1 328 1 729 2 093 2 539 2 861 19 1 325 1 725 2 086 2 528 2 845 20 2 080 2 518 2 831 2 074 2 508 2 819 22 2 069 2 500 2 807 23 2 797 24 2 060 2 485 2 787 25 2 479 2 779 26 2 052 2 473 2 771 27 2 048 2 467 2 763 28 2 045 2 462 2 756 29 1 310 1 697 2 042 2 457 2 750 30 1 309 1 696 2 040 2 453 2 744 31 1 309 1 694 2 037 2 449 2 738 32 2 035 2 445 2 733 33 2 032 2 441 2 728 34 2 438 2 724 35 2 434 2 719 36 2 715 37 1 316 1 708 1 315 1 706 2 056 1 314 1 703 1 313 1 701 1 311 1 699 1 308 1 692 1 307 1 691 1 306 1 688 1 306 1 690 2 030 2 028 2 026 1 305 1 687 2 431 Click the icon to view the t distribution table Question 5 6 2 5 Find the margin of error for the given values of c s and n c 0 90 s 6 n 13 The margin of error is Round to one decimal place as needed d f 1 234890 3 707 3 499 7 6 HW Score 14 29 of 7 points O Points 0 of 1

Statistics
StatisticsDetermine the force P required to start the 125 lb crate moving if the coefficient of static friction between the crate and the floor is 0 30 30 P