Statistics Questions
The best high school and college tutors are just a click away, 24×7! Pick a subject, ask a question, and get a detailed, handwritten solution personalized for you in minutes. We cover Math, Physics, Chemistry & Biology.

Statistics
Statistics5 The cost of electricity x in June for a random sample of 50 one bedroom apartments in a city in the central portion of New Jersey is summarized by a histogram Complete the following questions Electricity Cost Frequency 15 10 99 120 140 160 180 Utility Charge S 200 220 Note the sample mean is 150 and the sample variance is 1024 a Does the monthly electricity cost seem to have approximately a symmetric distribution YES NO b If x 150 and s 322 find the interval that contains 95 of the data Answer c Did you have to use Chebyshev s Rule to find the answer to b above d If one electricity bill is x 118 what is the corresponding z score Answer e If the minimum monthly bill is 86 and the range is 140 find the z score of the maximum monthly bill Answer f Do you think there are possible outliers in this sample YES NO Why YES NO

Statistics
Statistics3 Students gave the following affirmative answer to the question Do you prefer classes on Saturdays A graph was used to present the data Which graph is misleading Answer the left one none is misleading Relative frequency in 51 0 50 5 50 0 49 5 49 0 48 5 Part 1 male female Relative frequency in 100 80 60 40 20 0 Part 49 male circle your answer the right one 51 female

Statistics
Probability7 The work force of the Superior Corporation has the following distribution among type of work and gender of workers Gender Male Female Total Type of work Sales 825 Clerical Production Total 675 1 675 825 2 500 1 500 750 250 1 000 2 250 2 750 5 000 The company randomly chooses a worker Find a P Is a Female working on Sales Department Answer b P is a worker from Sales Department given that the worker is a Female Answer c In order to promote loyalty to the company the company randomly chooses a worker to receive an all expenses paid vacation next month Is the event of choosing a Female independent of the event of choosing a Sales Department worker Answer YES NO Why

Statistics
Statistics2 A physiologist randomly selects 16 runners who finish the New York Marathon then she measures the height of each selected person Please circle your answer a These data are qualitative quantitative b These data are discrete c The researcher uses the sample data to infer something about a population What is that population 1 the New York City population 3 the runners that finished the N Y Marathon continuous 2 the N Y City Marathon runners 4 the healthy New Yorkers
Statistics
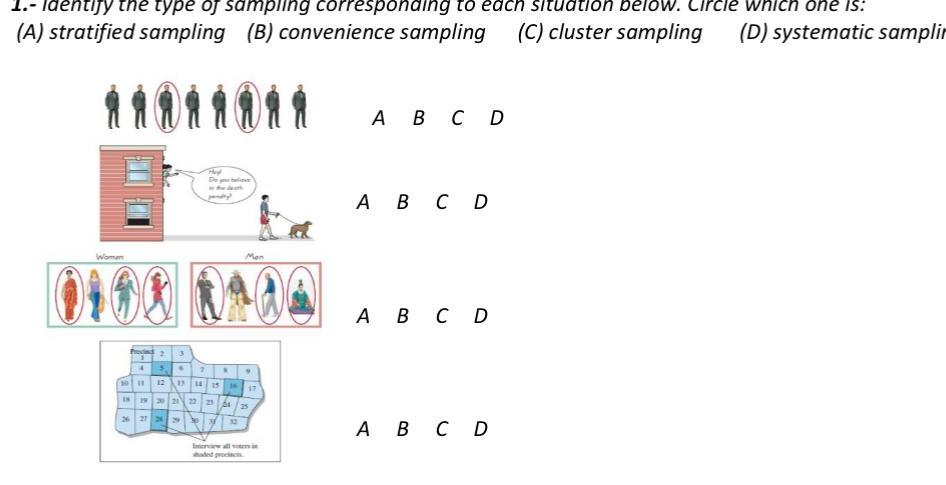
Probability1 Identify the type of sampling corresponding to each situation below Circle which one is A stratified sampling B convenience sampling C cluster sampling D systematic samplin Women 3 5 7 N E De 10 11 12 1u 18 19 20 21 22 23 24 25 N 15 9 17 Interview all voters in A B C D A B C D A B C D A B C D

Statistics
StatisticsFind the variance of the data 251 224 237 255 268 X 247 Variance 0 Variance Enter

Statistics
StatisticsA random sample of 860 births in a state included 425 boys Construct a 95 confidence interval estimate of the proportion of boys in all births It is believed that among all births the proportion of boys is 0 511 Do these sample results provide strong evidence against that belief Construct a 95 confidence interval estimate of the proportion of boys in all births p Round to three decimal places as needed C

Statistics
Statisticsin a test of on tech this technique Does it appear that the technique is effective in increasing the likelihood that a baby will be a female The probability that a female will be born using this technique is approximately 0 495 Type an integer or decimal rounded to three decimal places as needed Does the technique appear effective in improving the likelihood of having a female baby Yes No D

Statistics
Statistics14 Given in the table are the BMI statistics for random samples of men and women Assume that the two samples are independent simple random samples selected from normally distributed populations and do not assume that the population standard deviations are equal Complete parts a and b below Use a 0 01 significance n level for both parts x H H H OC Ho H H2 H H H The test statistic t is Round to two decimal places as needed Round to three decimal places as needed The P value is State the conclusion for the test GEITE H HH OD Ho H H H H H OA Fail to reject the null hypothesis There is not sufficient evidence to warrant rejection of the claim that men and women have the same mean BMI B Fail to reject the null hypothesis There is sufficient evidence to warrant rejection of the claim that men and women have the same mean BMI OC Reject the null hypothesis There is not sufficient evidence to warrant rejection of the claim that men and women have the same mean BMI OD Reject the null hypothesis There is sufficient evidence to warrant rejection of the claim that men and women have the same mean BMI P 40 27 3626 7 087305 b Construct a confidence interval suitable for testing the claim that males and females have the same mean BMI 0 44 1 0 Round to three decimal places as needed Does the confidence interval support the conclusion of the test because the confidence interval contains H 4 24 6 5 02 Demaining 00 56 02

Statistics
StatisticsK An experiment was conducted to determine whether giving candy to dining parties resulted in greater tips The mean tip percentages and standard deviations are given in the accompanying table along with the sample sizes Assume that the two samples are independent simple random samples selected from normally distributed populations and do not assume that the population standard deviations are equal Complete parts a and b UA Mo H H2 H H H OC Ho H H H H H Round to two decimal places as needed The P value is Round to three decimal places as needed The test statistic t is State the conclusion for the test SCIEN b Construct the confidence interval suitable for testing the claim in part a 0 H1 H 0 Round to two decimal places as needed Does the confidence interval support the conclusion found with the hypothesis test because the confidence interval contains No candy Two candies UD Mo H H2 H H H 2 OD Ho H H H H H H H n 22 X 18 84 S 1 53 22 21 15 2 41 OA Fail to reject the null hypothesis There is sufficient evidence to support the claim that giving candy does result in greater tips OB Reject the null hypothesis There is not sufficient evidence to support the claim that giving candy does result in greater tips OC Reject the null hypothesis There is sufficient evidence to support the claim that giving candy does result in greater tips D Fail to reject the null hypothesis There is not sufficient evidence to support the claim that giving candy does result in greater tips

Statistics
StatisticsThree distributions labeled a b and c are represented below by their histograms Each distribution is symmetrical and is made of 10 measureme Without performing any calculations order their respective standard deviations and a a a 1 2 3 4 5 6 7 8 9 10 11 12 13 14 c b 1 2 3 4 5 6 7 8 9 10 11 12 13 14 1 2 3 4 5 6 7 8 9 10 11 12 13 14

Statistics
StatisticsA marriage counselor Traditionally seen that the proportion p of all married couples for whom her communication program can prevent divorce 79 After making s cent changes the marriage counselor now claims that her program can prevent divorce in more than 79 of married couples In a random sample of 220 married couples who completed her program 178 of them stayed together Based on this sample is there enough evidence to support the marriage counselor s claim at the 0 10 level of significance Perform one tailed test Then complete the parts below Carry your intermediate computations to three or more decimal places If necessary consult a list of formulas a State the null hypothesis Ho and the alternative hypothesis H HO H 0 b Determine the type of test statistic to use Choose one c Find the value of the test statistic Round to three or more decimal places 0 d Find the critical value Round to three or more decimal places e Is there enough evidence to support the marriage counselor s claim that the proportion of married couples for whom her program can prevent divorce is more than 79 X 0 0 a X S 0 0 0 0 P S Q OSO 020 010 O

Statistics
StatisticsInterpreting percentile ranks Government agencies keep data about the income distribution of the population The Martin family and Wong family live in a county with 14 000 families The Martin family s income is at the 21st percentile The Wong family s income is at the 13th percentile a Which of the following must be true about the Martin family s and the Wong family s incomes The Martin family earns 8000 more than the Wong family The Wong family earns 8000 more than the Martin family Both the Martin family and the Wong family earn more than the men income Both the Martin family and the Wong family earn less than the median income b Which of the following must be true about the Martin family s income The Martin family earns about 21 of the highest income in their county O The Martin family s income is in the top half of incomes in their county The Martin family earns 21 000 The Martin family earns less than about 79 of families in their county

Statistics
ProbabilityLast year over 7000 students took an entrance exam at a certain state university Mary s score was at the percentile 74th a Which of the following must be true about Mary s score Mary scored higher than about 26 of the students who took the exam About 26 of the students who took the exam scored higher than Mary O Mary got about 74 of the questions correct O Mary got about 74 of the questions wrong b Which of the following must be true about Mary s and Rafael s scores Mary scored higher than Rafael Both Mary and Rafael scored higher than the median O Mary got 33 more questions correct than Rafael O Mary s and Rafael s scores were both in the bottom half of all scores X 5 percentile Rafael s score was at the 41st

Statistics
Statisticsperform loudness judgments for tones of different frequencies For each listener the output of these judgments is a number measured in sones that gives the loudness of the tone relative to the loudness of a reference tone You have in front of you data from an experimental study in which 60 listeners were asked to perform such loudness judgments for tones of various intensities and frequencies Of these 60 listeners 20 had normal hearing 20 used hearing aids and 20 had some hearing loss at low frequencies but didn t use hearing aids Here is a summary of the data obtained for a 50 dB SPL 500 Hz tone the data are the sone values corresponding to this tone Sample Sample size mean Groups Normal hearing 20 Hearing aid 20 Some hearing loss 20 Send data to calculator V F 2 15 2 14 1 90 Sample variance 0 2 0 3 Variation between the samples Variation within the samples For the data summarized above F 1 38 0 4 Send data to Excel Are there differences in the mean sone values for this tone for the populations of listeners with normal hearing listeners with hearing aids and listeners with low frequency hearing loss We can perform a one way independent samples ANOVA test to answer this question Such a test uses the following statistic a Give the p value corresponding to this value of the 10 F statistic Round your answer to at least three decimal places b Based on these data and using the 0 05 level of significance should you conclude that there are Juan for this tone O Yes O No X

Statistics
Statisticsby decreasing the size of the paper napkins they provide to patrons Papel Paper Products is considering pitching the smaller napkin idea to potential restaurant clients To determine the receptiveness of different restaurants to the idea Papel surveyed 400 fast food establishments chosen at random and looked at the data according to two variables type of fast food restaurant burger sandwich Chinese Mexican or other and attitude toward the smaller napkin idea receptive or not receptive The data are summarized in the contingency table below Each of the 6 cells of the table contains three numbers the first number is the observed cell frequency o the second number is the expected cell frequency g under the assumption that the two variables type of fast food restaurant and attitude toward the smaller napkin idea are not associated and the third number is the following value fo fe observed cell frequency Expected cell frequency TE Expected cell frequency The numbers labeled Total are totals for observed frequency Part 1 Fill in the missing values in the contingency table Round your expected frequencies to two or more decimal places and round your values to three or more decimal places Send data to Excel Attitude toward smaller napkin idea Receptive Not receptive Total Type of fast food restaurant Chinese Burger Sandwich Mexican 53 109 0 0 0 0 45 81 0 0 0 98 a Determine the type of test statistic to use Type of test statistic Choose one 0 0 190 Other 81 68 04 2 469 31 43 96 3 821 112 Total 243 157 Part 2 Answer the following to summarize the test of the hypothesis that the two variables type of fast food restaurant and attitude toward the smaller napkin idea are not associated For your test use the 0 05 level of significance 400 b Find the value of the test statistic Round to two or more decimal places 0 c Find the critical value for a test at the 0 05 level of significance Round to two or more decimal places d Can we conclude that the variables type of fast food restaurant and attitude toward the smaller napkin idea are associated Use the 0 05 level of significance O Yes No 5

Statistics
Statisticsis an annual survey given to a random selection of about 1500 adults in the United States Among the many questions asked are What is the highest level of education you ve completed and If you re employed full time how many hours do you spend working at your job during a typical week In a recent year 1112 respondents answered both questions The summary statistics are given in the chart below The sample data consist of the times in hours per week that were given by the respondents Groups Less than h s High school Bachelor s Graduate Sample Sample Sample size mean variance 297 273 262 280 Send data to calculator F 43 2 123 7 42 2 41 5 41 8 Send data to Excel Variation between the samples Variation within the samples For the data from the survey F 1 51 To decide if there are any differences in the mean hours per week worked by these different groups we can perform a one way independent samples ANOVA test Such a test uses the following statistic 95 4 103 4 90 7 10 10 b Give the denominator degrees of freedom of this F statistic a Give the numerator degrees of freedom of this F statistic c From the survey data can we conclude that at least one of the groups differs significantly from urs worked in a typical OYes O No X BEE A 8 2 13

Statistics
StatisticsMandrake is interested in evaluating the course s effectiveness in propagating safety in the laboratories During regular lab classes lab instructors have recorded harmful lab incidents accidents misuse of lab equipment etc The school is looking at the data and examining two variables laboratory performance involved in no incident involved in exactly one incident or involved in 2 incidents and status regarding lab techniques course took the techniques course or didn t take the techniques course The contingency table below gives a summary of the data that have been gathered so far In each of the 6 cells of the table are three numbers the first number is the observed cell frequency the second number is the expected cell frequency v under the assumption that there is no relationship between students laboratory performances and whether or not they took the techniques course and the third number is the following value fo Se Observed cell frequency Expected cell frequency Expected cell frequency The numbers labeled Total are totals for observed frequency Part 1 Fill in the missing values in the contingency table Round your expected frequencies to two or more decimal places and round your Jo JE values to three or more decimal places JE Send data to Excel Status regarding lab techniques course Took the techniques course Didn t take the techniques course Total 0 Laboratory performance Involved in 2 incidents Involved in no incident 45 10 0 59 0 0 104 a Determine the type of test statistic to use Type of test statistic Choose one Involved in exactly one incident 17 0 0 40 10 0 57 13 14 63 0 182 26 24 38 0 108 39 Total 75 125 200 Part 2 Answer the following to summarize the test of the hypothesis that there is no relationship between students laboratory performances and whether or not they took the techniques course For your test use the 0 10 level of significance b Find the value of the test statistic Round to two or more decimal places c Find the critical value for a test at the 0 10 level of significance Round to two or more decimal places X d Can Mandrake conclude that there is a relationship between students laboratory performances and whether or not they took the techniques course Use the 0 10 level of significance Yes O No 5 X

Statistics
StatisticsSuppose a doctor measures the height x and head circumference y of 11 children and obtains the data below The correlation coefficient is 0 793 and the least squares regression y 0 214x 11 547 Complete parts a and b below C Height x 27 5 25 75 26 75 25 5 27 75 26 75 26 25 27 27 25 27 25 27 Head Circumference y 17 6 16 9 17 1 17 1 17 4 17 4 17 2 17 4 17 3 17 3 17 3 a Compute the coefficient of determination R2 R Round to one decimal place as needed b Interpret the coefficient of determination Approximately of the variation in Round to one decimal place as needed is explained by the least squares regression model head circumference height

Statistics
Statisticsrelative successfulness of males and females in quitting smoking A study of 400 adults who began various smoking cessation programs produced the data in the contingency table below The table shows data from the study regarding two variables the smoker s sex male or female and the length of the smoking cessation period less than two weeks between two weeks and one year or at least one year In the table less than two weeks means that the individual returned to smoking within two weeks of beginning the program between two weeks and one year means that the individual survived the first two weeks but returned to smoking within a year and at least one year means that the individual did not smoke for at least a year after beginning the program The cells of the table each contain three numbers The first number in each cell is the observed cell frequency fo the second number is the expected cell frequency f under the assumption that there is no association between sex and the length of the smoking cessation period and the third number is the following value So f Observed cell frequency Expected cell frequency JE Expected cell frequency The numbers labeled Total are totals for observed frequency Part 1 Fill in the missing values in the contingency table Round your expected frequencies to two or more decimal places and round your values to three or more decimal places Send data to Excel Sex Male Female Total Length of smoking cessation period Less than two weeks 72 0 1 29 0 10 101 Between two weeks At least one and one year year 132 a Determine the type of test statistic to use Type of test statistic Choose one 0 60 0 0 192 53 68 75 3 608 54 38 25 6 485 107 Total 257 143 400 Part 2 Answer the following to summarize the test of the hypothesis that there is no association between sex and the length of the smoking cessation period For your test use the 0 05 level of significance b Find the value of the test statistic Round to two or more decimal places 0 c Find the critical value for a test at the 0 05 level of significance Round to two or more decimal places X 0 d Can we conclude that there is an association between sex and the length of the smoking cessation period Use the 0 05 level of significance Yes O No X E E

Statistics
StatisticsWill the following variables have positive correlation negative correlation or no correlation number of toddlers in the household and expenditures on diapers outside temperature and the number of people wearing coats size of TV in living room and amount for heating bill negative correlation positive correlation no correlation negative correlation Drag each of the r values given above into the appropriate area below II number of toddlers in the household and expenditures on diapers outside temperature and the number of people wearing coats size of TV in living room and amount for heating bill

Statistics
StatisticsMandrake only 75 have been able to take the techniques course Mandrake is interested in evaluating the course s effectiveness in propagating safety in the laboratories During regular lab classes lab instructors have recorded harmful lab incidents accidents misuse of lab equipment etc The school is looking at the data and examining two variables laboratory performance involved in no incident involved in exactly one incident or involved in 2 incidents and status regarding lab techniques course took the techniques course or didn t take the techniques course The contingency table below gives a summary of the data that have been gathered so far In each of the 6 cells of the table are three numbers the first number is the observed cell frequency the second number is the expected cell frequency under the assumption that there is no relationship between students laboratory performances and whether or not they took the techniques course and the third number is the following value fo Observed cell frequency Expected cell frequency fe Expected cell frequency The numbers labeled Total are totals for observed frequency Part 1 Fill in the missing values in the contingency table Round your expected frequencies to two or more decimal places and round your values to three or more decimal places JE Send data to Excel Took the techniques course Status regarding lab techniques the course Didn t take techniques course Total Yes Laboratory performance Involved in 2 incidents Involved in no incident 33 0 65 0 0 98 a Determine the type of test statistic to use Type of test statistic Choose one No Involved in exactly one incident 17 0 0 41 0 58 25 16 50 4 379 19 27 50 2 627 44 Total c Find the p value Round to three or more decimal places 0 75 Part 2 Answer the following to summarize the test of the hypothesis that there is no relationship between students laboratory performances and whether or not they took the techniques course For your test use the 0 10 level of significance 125 b Find the value of the test statistic Round to two or more decimal places 0 200 d Can Mandrake conclude that there is a relationship between students laboratory performances and whether or not they took the techniques course Use the 0 10 level of significance 5

Statistics
Statisticsand rather immobile so advertisers of arthritis medications face limitations in ways to get their messages across Currently their best modes of advertisement are commercials on daytime TV advertisements in select magazines fliers in convalescent homes and advertisements on certain Web pages Marketing managers for Jointsoft are investigating these four modes of advertisement in four small communities with a different mode of advertisement in each community The marketing managers have selected 43 days at random and are looking at the daily sales in dollars in each of the communities on each of these days Here is what they have to work with Groups TV Magazines Sample Sample Sample size variance mean 43 580 5 2097 9 43 566 8 3925 1 43 584 9 2389 0 43 558 7 1748 0 Send data to Excel Fliers Web pages Send data to calculator Suppose that the marketing managers perform a one way independent samples ANOVA test to decide if there are differences in the mean daily sales arising from the four modes of advertisement So they re assuming that the only difference among the four communities is the mode of advertisement used in it Such a test uses the following statistic Variation between the samples Variation within the samples For the information in the chart above F 2 49 F Give the p value corresponding to this value of the F statistic Round your answer to at least three decimal places b Using the 0 10 level of significance can the marketing managers conclude that the mean daily sales arising from at least one of the modes of O Yes O No X S

Statistics
Statisticsfrom last Monday Tuesday and Wednesday with the aim of testing whether price movements of stocks on a given day are influenced by movements in the prices on previous days The contingency table below displays some information for a random sample of 500 stocks The variables examined in the table are closing price movement from Monday to Tuesday closing price is up on Tuesday or closing price is not up on Tuesday and closing price movement from Tuesday to Wednesday closing price is up on Wednesday or closing price is not up on Wednesday Each cell of the table has three numbers the first number is the observed cell frequency o the second number is the expected cell frequency under the assumption that there is no association between the two variables closing price movement from Monday to Tuesday and closing price movement from Tuesday to Wednesday and the third number is the following value fo fE Observed cell frequency Expected cell frequency Expected cell frequency The numbers labeled Total are totals for observed frequency Part 1 Fill in the missing values in the contingency table Round your expected frequencies to two or more decimal places and round your fo JE values to three or more decimal places Send data to Excel Closing price movement from Monday to Tuesday Closing price up on Tuesday Closing price not up on Tuesday Total Closing price movement from Tuesday to Wednesday Closing price up on Wednesday 134 0 0 104 0 0 238 Closing price not up on Wednesday 128 0 0 134 a Determine the type of test statistic to use Type of test statistic Choose one 0 0 262 Total 262 238 500 Part 2 Answer the following to summarize the test of the hypothesis that there is no association between the two variables closing price movement from Monday to Tuesday and closing price movement from Tuesday to Wednesday For your test use the 0 05 level of significance b Find the value of the test statistic Round to two or more decimal places 0 c Find the critical value for a test at the 0 05 level of significance Round to two or more decimal places 0 X d Can we conclude that there is an association between the variables closing price movement from Monday to Tuesday and closing price movement from Tuesday to Wednesday Use the 0 05 level of X

Statistics
StatisticsSeveral months ago while shopping I was interviewed to see whether or not I d be interested in signing up for a subscription to a yoga app I fall in the category of people who have a membership at a local gym and guessed that like me many people in that category would not be interested in the app My friend Mary falls in the category of people who do not have a membership at a local gym and I was thinking that she might like a subscription to the app After being interviewed I looked at the interviewer s results Of the 89 people in my market category who had been Interviewed 12 said they would buy a subscription and of the 113 people in Mary s market category 29 said they would buy a subscription Assuming that these data came from independent random samples can we conclude at the 0 10 level of significance that the proportion p of all mall shoppers in my market category who would buy a subscription is less than the proportion p2 of all mall shoppers in Mary s market category wh vould a subscription Perform a one tailed test Then complete the parts below Carry your intermediate computations to three or more decimal places and round your answers as specified in the parts below If necessary cons list of formulas a State the null hypothesis Ho and the alternative hypothesis H H 0 H 0 b Determine the type of test statistic to use Choose one c Find the value of the test statistic Round to three or more decimal places 0 d Find the p value Round to three or more decimal places 0 e Can we conclude that the proportion of mall shoppers in my market category who would buy a subscription is less than the proportion in Mary s market category who would XI 0 O X S 0 0 OSO 020 P 0 0 8 0 0

Statistics
Statisticsi are Co la 16 3 This graph represents the first hypothetical described in the video Imagine someone invests 10 000 with 7 returns compounding each year for 30 years 1 aran Sun 40000 40000 40000 30000 20000 000 years a Approximately how much does their investment grow in the first 15 years ate 25 000 b Approximately how much does their investment grow between year 15 and 30 80 000 c This investor started with 10 000 and ended up with 74 500 after 30 years just from the growth of that initial investment Now imagine they tried to use savings to reach that same 30 year goal If they start with 10 000 how much would they need to save each year to have 74 500 after 30 years Assume they don t earn interest on savings 4 What is the advantage of starting to invest early ACTIVITY ANALYZE Inequalities in Investing As you ve learned investing is a critical tool for building wealth Unfortunately not everyone has the same opportunities to take advantage of that So who currently benefits from investing Follow the directions on the worksheet to complete this activity

Statistics
Probabilitya coin is flipped 8 times what is the probability that it will show all heads or all tails Show your work

Statistics
Probability4 If a coin is flipped 8 times what is the probability that it will show all heads or all tails Show your work

Statistics
Statisticsa majo university in rnia are complaining abou a serious housing crunch They are stating that many of the university s students have to commute too far to school because there is not enough housing near campus The university officials response is to perform a study The study reported in the school newspaper contains the following histogram summarizing the commute distances for a sample of 100 students at the university Relative frequency 1 0 8 0 6 0 4 0 3 0 2 0 2 0 1 0 0 0 00 0 25 0 4 0 27 Based on this histogram draw the ogive the cumulative relative frequency polygon for the data in the study Cumulative relative frequency Jm 0 18 0 00 8 12 16 Commute distance in miles A 0 13 0 00 0 12 8 0 00 20 0 05 12 24 0 00 16 Commute distance in miles 0 00 20 0 00 24 X G

Statistics
Statisticsin the twentieth century it was a common practice in Southern California for houses to be built with pools in the backyard For new homes however that practice may be changing possibly as a measure to help reduce climate change A recent study examined a random sample of 159 houses built in Southern California in the twentieth century and an independent random sample of 67 new houses built in Southern California The sample of twentieth century houses contained 78 houses with pools and the sample of new houses contained 29 houses with pools Based on this survey can we conclude at the 0 05 level of significance that the proportion p of all Southern California twentieth century houses that were built with pools is greater than the proportion p of all new Southern California houses that were built with pools Perform a one tailed test Then complete the parts below Carry your intermediate computations to three or more decimal places and round your answers as specified in the parts below If necessary consult a list of formulas a State the null hypothesis Ho and the alternative hypothesis H Ho O H b Determine the type of test statistic to use Choose one c Find the value of the test statistic Round to three or more decimal places d Find the critical value at the 0 05 level of significance Round to three or more decimal places e Can we conclude that the proportion of Southern California twentieth century houses built with pools is greater than the proportion for new homes Yes No x X 0 a X S p 0 0 OSO 020 O Q olo

Statistics
StatisticsA marketing researcher wants to estimate the mean amount spent on a certain retail website by members of the website s premium program A random sample of 99 members of the website s premium program who recently made a purchase on the website yielded a mean of 1200 and a standard deviation of 250 Complete parts a and b below C a Construct a 90 confidence interval estimate for the mean spending for all shoppers who are members of the website s premium program Sus Round to two decimal places as needed b Interpret the interval constructed in a Choose the correct answer below OA With 90 confidence the mean spending in dollars for all shoppers who are members of the website s premium program is between the lower and upper limits of the confidence interval OB 90 of all shoppers who are members the website s premium program have spent an amount in dollars that is between the lower and upper limits of the confidence interval OC The sample mean spending in 90 of all samples of 99 members of the website s premium program will be between the lower and upper limits of the confidence interval D There is a 90 probability that mean spending in dollars for all shoppers who are members of the website s premium program is between the lower and upper limits of the confidence interval

Statistics
ProbabilityThe table shows the relationship between weight and lifespan for several dog breeds Use DESMOS to find an equation of the line of best fit Let pounds be the x value and lifespan be y Breed Yorkshire Terrier Shih Tzu Pug Boston Terrier Welsh Corgi Pembroke Bulldog Siberian Husky Golden Retriever German Shepherd Dog Rottweiler Great Dane Oy 0 04x 13 62 Oy 0 04x 13 62 Oy 04x 13 62 OYN 0 04x 13 62 Typical Weight pounds Typical Lifespan years 5 5 15 12 5 13 13 5 There is no correct answer given 16 20 26 45 47 5 65 72 5 107 5 135 13 13 7 12 12 11 10 8 5

Statistics
Statisticsne Genera Social Survey is an annual survey given to a random selection of about 1500 adults in the United States Among the many questions asked are What is the highest level of education you ve completed and If you re employed full time how many hours do you spend working at your job during a typical week In a recent year 1098 respondents answered both questions The summary statistics are given in the chart below The sample data consist of the times in hours per week that were given by the respondents Groups Less than h s High school Bachelor s Graduate Sample Sample Sample size mean variance 273 41 6 105 7 257 92 8 295 86 8 273 92 7 Send data to calculator V 40 1 F 43 2 41 1 Send data to Excel To decide if there are any differences in the mean hours per week worked by these different groups we can perform a one way independent samples ANOVA test Such a test uses the following statistic Variation between the samples Variation within the samples For the data from the survey F 4 95 a Give the p value corresponding to this value of the F statistic Round your answer to at least three decimal places 10 b From the survey data can we conclude that at least one of the groups differs significantly from the others in mean hours worked in a typical week Use the 0 05 level of significance O Yes O No X
Statistics
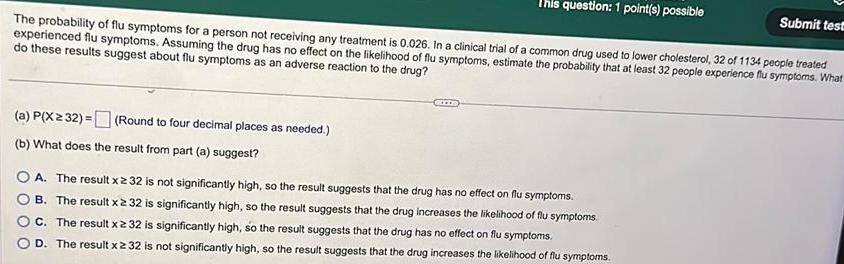
ProbabilityThis question 1 point s possible The probability of flu symptoms for a person not receiving any treatment is 0 026 In a clinical trial of a common drug used to lower cholesterol 32 of 1134 people treated experienced flu symptoms Assuming the drug has no effect on the likelihood of flu symptoms estimate the probability that at least 32 people experience flu symptoms What do these results suggest about flu symptoms as an adverse reaction to the drug a P X2 32 b What does the result from part a suggest Round to four decimal places as needed A The result x 32 is not significantly high so the result suggests that the drug has no effect on flu symptoms B The result x 32 is significantly high so the result suggests that the drug increases the likelihood of flu symptoms C The result x 232 is significantly high so the result sug ests that the drug has no effect on flu symptoms D The result x 232 is not significantly high so the result suggests that the drug increases the likelihood of flu symptoms Submit test

Statistics
StatisticsIf X 135 o 22 and n 30 construct a 95 confidence interval estimate of the population mean sps Round to two decimal places as needed

Statistics
StatisticsDetermine the upper tail critical value to 2 in each of the following circumstances a 1 0 90 n 46 d 1 0 90 n 66 b 1 0 95 n 46 e 1 0 99 n 26 c 1 0 90 n 14 Click here to view page 1 of the table of critical values for the t distribution Click here to view page 2 of the table of critical values for the t distribution Round to four decimal places as needed b t Round to four decimal places as needed Round to four decimal places as needed Round to four decimal places as needed Round to four decimal places as needed a t c t d t e t

Statistics
StatisticsIf you want to be 95 confident of estimating the population mean to within a sampling error of 2 and the standard deviation is assumed to be 16 what sample size is required The sample size required is Round up to the nearest integer CIE

Statistics
Statisticspolitical pollster is conducting an analysis of sample results in order to make predictions on election night Assuming a two candidate election if a specific candidate receives at least 55 of the wote in the sample that candidate will be forecast as the winner of the election You select a random sample of 100 voters Complete parts a through c below a What is the probability that a candidate will be forecast as the winner when the population percentage of her vote is 50 1 The probability is that a candidate will be forecast as the winner when the population percentage of her vote is 50 1 Round to four decimal places as needed b What is the probability that a candidate will be forecast as the winner when the population percentage of her vote is 60 The probability is that a candidate will be forecast as the winner when the population percentage of her vote is 60 Round to four decimal places as needed What is the probability that a candidate will be forecast as the winner when the population percentage of her vote is 49 and she will actually lose the election The probability is that a candidate will be forecast as the winner when the population percentage of her vote is 49 Round to four decimal places as needed Suppose that the sample size was increased to 400 Repeat process a through c using this new sample size Comment on the difference The probability is that a candidate will be forecast as the winner when the population percentage of her vote is 50 1 Round to four decimal places as needed C d The probability is that a candidate will be forecast as the winner when the population percentage of her vote is 60 Round to four decimal places as needed The probability is that a candidate will be forecast as the winner when the population percentage of her vote is 49 Round to four decimal places as needed

Statistics
StatisticsSiven a normal distribution with 102 and o 15 and given you select a sample of n 9 complete parts a through d a What is the probability that X is less than 90 P X 90 Type an integer or decimal rounded to four decimal places as needed b What is the probability that X is between 90 and 92 5 P 90 X 92 5 Type an integer or decimal rounded to four decimal places as needed c What is the probability that X is above 102 8 P X 102 8 Type an integer or decimal rounded to four decimal places as needed d There is a 61 chance that X is above what value X Type an integer or decimal rounded to two decimal places as needed

Statistics
StatisticsAccu Rating has just released its webcast report for last month The report details the aggregate tuning hours for each of the top 20 radio stations broadcast over the web The aggregate tuning hours for a station is the sum total of all hours that listeners tuned to the station The report displays the following histogram Frequency 1 0 8 0 6 0 4 8 0 6 4 2 0 0 2 Based on this histogram draw the ogive the cumulative relative frequency polygon for the Accu Rating data Cumulative relative frequency 3 0 00 200 200 400 600 800 1000 Aggregate tuning hours in thousands of hours Str 4 0 00 3 400 0 00 3 600 0 00 800 1200 0 00 1000 Aggregate tuning hours in thousands of hours 0 00 1200 X

Statistics
StatisticsA man surveyed a sample of 36 high school students and asked How many days in the past week have you consumed an alcoholic beverage The results of the survey are shown to the right Use these results to answer parts a through f 0 1 1 1 1 0 Par 1 0 5 d Compute the mean and median What does this tell you The mean is Type an integer or decimal rounded to two decimal places as needed The prediction was 0 0 1 The median is 0 Type an integer or decimal rounded to two decimal places as needed 0 0 1 0 1 1 0 0 1 1 0 2 0 0 0 0 1 3 0 4 1 1 0 1 What do the computed mean and median tell you Fill in the blanks below Use a 25 difference as the criterion for a substantial difference between the mean and median because the mean the median in U

Statistics
StatisticsSusan has just completed her second semester in college She earned a grade of D in her 2 hour topology course a grade of B in her 5 hour sociology course a grade of B in her 3 hour engineering course and a grade of F in her 2 hour studio art course Assuming that A equals 4 points B equals 3 points C equals 2 points D equals 1 point and F is worth no points determine Susan s grade point average for the semester Susan s grade point average is Round to two decimal places as needed

Statistics
StatisticsOften frequency distributions are reported using unequal class widths because the frequencies of some groups would otherwise be small or very large Consider the following data which represent the daytime household temperature the thermostat is set to when someone is home for a random sample of 737 households Determine the class midpoint if necessary for each class and approximate the mean and standard deviation temperature Click the icon to view the frequency distribution for the daytime household temperature Class 61 64 65 67 68 69 70 71 72 73 76 77 90 Class Midpoint

Statistics
ProbabilityFor the histogram on the right determine whether the mean is greater than less than or approximately equal to the median 201 Justify your answer 16 12 8 4 0 Which of the following is correct OA x M because the histogram is symmetric OC x M because the histogram is skewed right OE x M because the histogram is skewed right OB x M because the histogram is skewed left O D x M because the histogram is symmetric OF x M because the histogram is skewed left O

Statistics
StatisticsComplete the paragraph below The standard deviation is used in conjunction with the distributions that are bell shaped The standard deviation measures the to numerically describe measures the center of the distribution while the of the distribution Choose the correct answers below The standard deviation is used in conjunction with the distributions that are bell shaped The the distribution while the standard deviation measures the to numerically describe measures the center of of the distribution

Statistics
StatisticsUse the side by side boxplots shown to complete parts a through e Q X y 0 30 60 a What is the median of variable x The median of variable x is 90 b What is the third quartile of variable y The third quartile of variable y is 120 Q Round to the nearest integer as needed Round to the nearest integer as needed

Statistics
StatisticsT Find the indicated IQ score The graph to the right depicts IQ scores of adults and those scores are normally distributed with a mean of 100 and a standard deviation of 15 COO A 00808 2

Statistics
Statisticsthe indicated 2 score The graph depicts the standard normal distribution with mean 0 and standard deviation 1 GEIDS

Statistics
StatisticsThe noon temperatures in Fahrenheit for two cities were recorded over a given month The box and whisker plots below sometimes called boxplots summarize the noon temperatures for each city Use the box and whisker plots to answer the questions 55 60 65 70 80 85 Noon temperature in Fahrenheit 75 a Which city had more noon temperatures above 82 F b Which city had the highest noon temperature c Which city had noon temperatures with a larger interquartile range IQR d Which city had a larger median noon temperature 90 City A City B 95 Choose one Choose one Choose one Choose one City A City B both had tho

Statistics
StatisticsA hospital implements a medical triage model that uses check in questionnaire answers to identify patients that have symptoms that are consistent with having a novel viral infection The model continuously learns from new confirmed cases and gets updated weekly The output of a model is a binary risk label O Classification O Regression Clustering