Statistics Questions
The best high school and college tutors are just a click away, 24×7! Pick a subject, ask a question, and get a detailed, handwritten solution personalized for you in minutes. We cover Math, Physics, Chemistry & Biology.

Statistics
Statisticsnd the regression line associated with the set of points Round all coefficients to four decimal places HINT See Example 2 4 6 6 10 10 14 12 2 x
Statistics
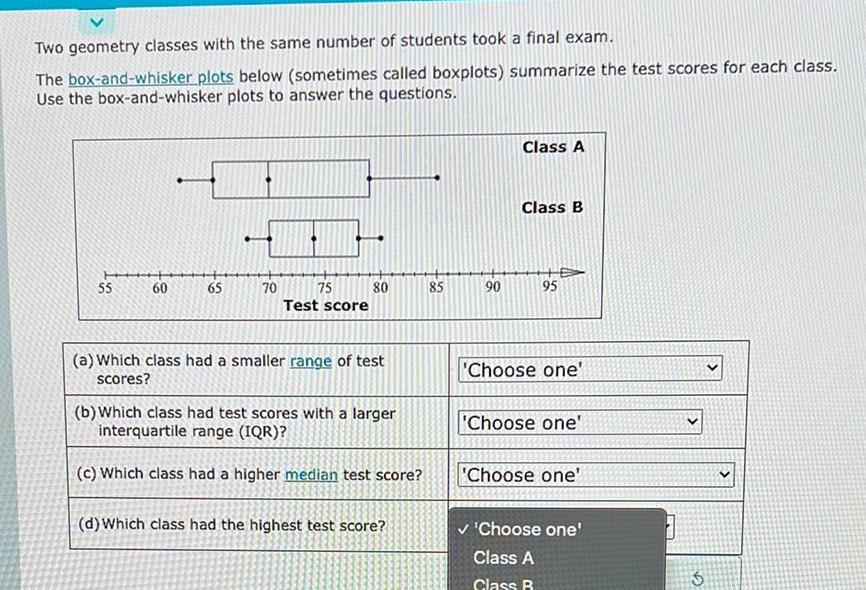
StatisticsTwo geometry classes with the same number of students took a final exam The box and whisker plots below sometimes called boxplots summarize the test scores for each class Use the box and whisker plots to answer the questions 55 60 65 70 75 Test score 80 a Which class had a smaller range of test scores b Which class had test scores with a larger interquartile range IQR c Which class had a higher median test score d Which class had the highest test score 899 5 90 Class A Class B 95 Choose one Choose one Choose one Choose one Class A Class B 3 3

Statistics
StatisticsEach year taxpayers are able to contribute money to various charities via their IRS tax forms The following list contains the amounts of money in dollars donated via IRS tax forms by 23 taxpayers 8 23 29 37 38 44 53 59 59 61 61 61 72 74 95 98 99 108 113 126 155 176 186 Send data to calculator Frequency 10 8 6 4 2 0 0 5 40 80 120 160 Donation amount in dollars a For these data which measures of central tendency take more than one value Choose all that apply 2 b Suppose that the measurement 186 the largest measurement in the data set were replaced by 246 Which measures of central tendency would be affected by the change Choose all that apply c Suppose that starting with the original data set the largest measurement were removed Which measures of central tendency would be changed from those of the original data set Choose all that apply d Which of the following best describes the distribution of the original data Choose only one 2 Mean Median Mode None of these measures OMean 200 Median Mode ONone of these measures OMean Median Mode ONone of these measures ONegatively skewed OPositively skewed ORoughly symmetrical

Statistics
StatisticsThis question 1 point s possible Assume that females have pulse rates that are normally distributed with a mean of u 76 0 beats per minute and a standard deviation of a 12 5 beats per minute Complete parts a through c below CELLS a If 1 adult female is randomly selected find the probability that her pulse rate is less than 83 beats per minute The probability is Round to four decimal places as needed b If 16 adult females are randomly selected find the probability that they have pulse rates with a mean less than 83 beats per minute The probability is Round to four decimal places as needed c Why can the normal distribution be used part b even though the sample size does not exceed 30 O A Since the mean pulse rate exceeds 30 the distribution of sample means is a normal distribution for any sample size OB Since the distribution is of individuals not sample means the distribution is a normal distribution for any sample size OC Since the original population has a normal distribution the distribution of sample means is a normal distribution for any sample size OD Since the distribution is of sample means not individuals the distribution is a normal distribution for any sample size Submit tes

Statistics
ProbabilityQuestion 11 of 16 A survey found that women s heights are normally distributed with mean 63 9 in and standard deviation 2 2 in A branch of the military requires women s heights to be between 58 in and 80 in a Find the percentage of women meeting the height requirement Are many women being denied the opportunity to join this branch of the military because they are too short or too tall b If this branch of the military changes the height requirements so that all women are eligible except the shortest 1 and the tallest 2 what are the new height requirements Click to view page 1 of the table Click to view page 2 of the table a The percentage of women who meet the height requirement is 9931 Round to two decimal places as needed Are many women being denied the opportunity to join this branch of the military because they are too short or too tall This test 16 point s possible This question 1 point s possible A No because only a small percentage of women are not allowed to join this branch of the military because of their height B No because the percentage of women who meet the height requirement is fairly small C Yes because a large percentage of women are not allowed to join this branch of the military because of their height D Yes because the percentage of women who meet the height requirement is fairly large b For the new height requirements this branch of the military requires women s heights to be at least in and at most in Round to one decimal place as needed Sub

Statistics
StatisticsThe following data were randomly drawn from an approximately normal population 10 12 16 18 24 28 Send data to calculator Send data to Excel Based on these data find a 95 confidence interval for the population standard deviation Then give its lower limit and upper limit Carry your intermediate computations to at least three decimal places Round your answers to at least two decimal places If necessary consult a list of formulas Lower limit Upper limit X

Statistics
Statisticsquestion 1 point s possible GILD An airliner carries 350 passengers and has doors with a height of 76 in Heights of men are normally distributed with a mean of 69 0 in and a standard deviation of 2 8 in Complete parts a through d a If a male passenger is randomly selected find the probability that he can fit through the doorway without bending The probability is Round to four decimal places as needed b If half of the 350 passengers are men find the probability that the mean height of the 175 men is less than 76 in The probability is Round to four decimal places as needed c When considering the comfort and safety of passengers which result is more relevant the probability from part a or the probability from part b Why Submit test OA The probability from part a is more relevant because it shows the proportion of flights where the mean height of the male passengers will be less than the door height OB The probability from part b is more relevant because it shows the proportion of male passengers that will not need to bend OC The probability from part a is more relevant because it shows the proportion of male passengers that will not need to bend OD The probability from part b is more relevant because it shows the proportion of flights where the mean height of the male passengers will be less than the door height d When considering the comfort and safety of passengers why are women ignored in this case OA There is no adequate reason to ignore women A separate statistical analysis should be carried out for the case of women OB Since men are generally taller than women a design that accommodates a suitable proportion of men will necessarily accommodate a greater proportion of women OC Since men are generally taller than women it is more difficult for them to bend when entering the aircraft Therefore it is more important that men not have to bend than it is important that women not have to bend

Statistics
ProbabilityWhich statement below indicates the area to the left of 19 5 before a continuity correction is used Choose the correct answer below At least 19 At least 20 At most 19 Less than 19 C

Statistics
ProbabilityDr Szyslak is a very demanding statistics professor Only 65 of students who take his class pass Assuming that the chance of passing is independent among all students if five students are randomly sampled from Dr Szyslak s class what is the probability that exactly three of them will pass

Statistics
ProbabilityOn December 5th in Champlain MO the probability of snow is 28 the probability that the maximum temperature for the day will be above zero is 80 and the probability that it will both snow and be above zero is 60 What is the probability that it will snow OR the temperature will be above zero Show your work

Statistics
ProbabilityLease Terms Monthly fee Deposit Registration and Title Disposition fee Acquisition fee Cost What is the total cost of a 48 month lease with the terms 350 described in the table 450 300 2 500 300 A 15 500 B 24 750 C 14 400 D 18 000

Statistics
StatisticsDealer s Costs for New Vehicles Base sticker price 90 of price Options Destination Fee Calculate the dealer s cost for a car with 20 000 sticker price and 2 000 in options A 19 600 B 18 600 80 of included options 800 00 C 20 000 D 20 400

Statistics
Statisticsby the federal government Several groups disagree with this and would like to privatize the air traffic control system Among the arguments given for privatization is that flight delays are much too common in the United States A first step in deciding if indeed delays in the U S are too common might be to compare the flight delay information from the U S and other nations You have in front of you the following chart which summarizes the information from three samples of flights from the past six weeks One of the samples is composed of domestic U S flights one is composed of domestic Canadian flights and one is composed of domestic British flights The information recorded for each flight is the time in minutes that the plane was late to the arrival gate If the plane was early the time recorded was negative Groups ing United States Canada Great Britain Sample Sample Sample size mean variance 206 15 9 111 6 217 18 3 105 2 214 17 7 99 9 Send data to calculator F Send data to Excel You perform a one way independent samples ANOVA test to decide if ther are differences in the mean flight delay times among the three countries Such a test uses the following statistic Variation between the samples Variation within the samples For the flight delay information you ve been given F 3 1 a Give the numerator degrees of freedom of this F statistic 0 10 b Give the denominator degrees of freedom of this F statistic c Using the 0 05 level of significance can you conclude from your ANOVA test that there are differences in the mean flight delay times among the three countries O Yes O No E X

Statistics
StatisticsEvery year all incoming high school freshmen in a large school district take a math placement test For this year s test the district has prepared two possible versions Version 1 that covers more material than last year s test and Version 2 test that is similar to last year s test The district suspects that the mean score for Version 1 will be less than the mean score for Version 2 To examine this over the summer the district randomly selects 35 incoming freshmen to come to its offices to take Version 1 and it randomly selects 75 incoming freshmen to come take Version 2 The 85 Incoming freshmen taking Version 1 score a mean of 113 0 points with a standard deviation of 17 0 The 75 incoming freshmen taking Version 2 score a mean of 117 0 points with a standard deviation of 18 2 Assume that the population standard deviations of the test scores from the two versions can be estimated to be the sample standard deviations since the samples that are used to compute them are quite large At the 0 05 level of significance is there enough evidence to support the claim that the mean test score for Version 1 is less than the mean test score for Version 2 Perform a one tailed test Then complete the parts below A Carry your intermediate computations to at least three decimal places If necessary consult a list of formulas a State the null hypothesis Ho and the alternative hypothesis H H H b Determine the type of test statistic to use Choose one c Find the value of the test statistic Round to three or more decimal places 0 d Find the critical value at the 0 05 level of significance Round to three or more decimal places e Can we support the claim that the mean test score for Version 1 is less than the mean test score of Version 2 OYes No 3 XI 0 S X 0 0 OSO 020 P O O olo O 0
Statistics
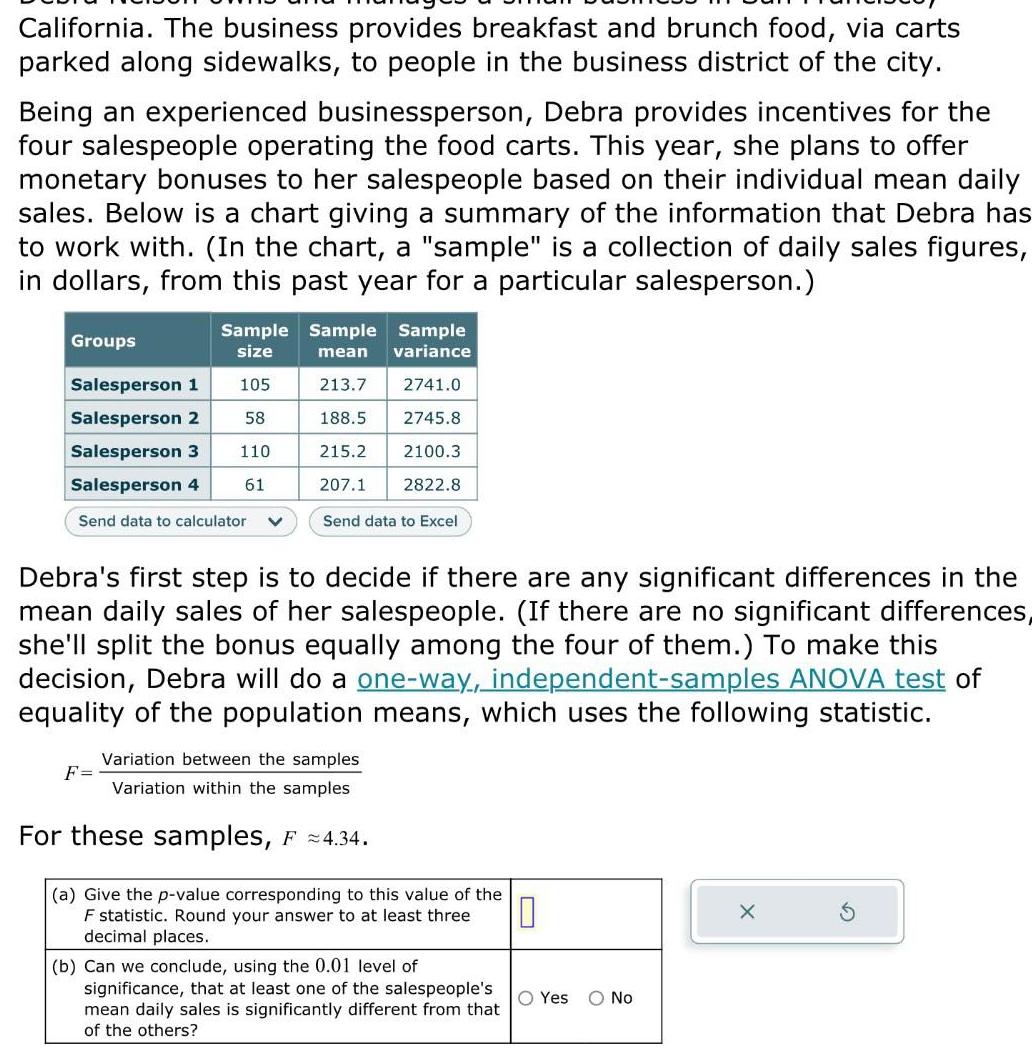
StatisticsCalifornia The business provides breakfast and brunch food via carts parked along sidewalks to people in the business district of the city Being an experienced businessperson Debra provides incentives for the four salespeople operating the food carts This year she plans to offer monetary bonuses to her salespeople based on their individual mean daily sales Below is a chart giving a summary of the information that Debra has to work with In the chart a sample is a collection of daily sales figures in dollars from this past year for a particular salesperson Sample Sample Sample mean variance size Salesperson 1 105 213 7 2741 0 Salesperson 2 58 188 5 2745 8 Salesperson 3 110 215 2 2100 3 Salesperson 4 61 207 1 2822 8 Send data to calculator Groups Send data to Excel Debra s first step is to decide if there are any significant differences in the mean daily sales of her salespeople If there are no significant differences she ll split the bonus equally among the four of them To make this decision Debra will do a one way independent samples ANOVA test of equality of the population means which uses the following statistic Variation between the samples Variation within the samples For these samples F 4 34 F a Give the p value corresponding to this value of the F statistic Round your answer to at least three decimal places 10 b Can we conclude using the 0 01 level of significance that at least one of the salespeople s mean daily sales is significantly different from that of the others O Yes O No

Statistics
ProbabilityJames sees a truck at the dealership for 51 000 base price 1 300 premium interior 1 900 navigation touch screen and 2 400 smart traffic sensors If his current vehicle is worth 8 000 and he s offered a 80 trade in rate what is the total cost of the car after the 1 200 destination fee A 51 400 B 40 200 C 57 800 D 49 800

Statistics
Statisticsne owner of a ch of mini markets wants to compare the sales performance of two of her stores Store 1 and Store 2 Though the two stores have been comparable in the past the owner has made several improvements to Store 2 and wishes to see if the improvements have made Store 2 more popular than Store 1 Sales can vary considerably depending on the day of the week and the season of the year so she decides to eliminate such effects by making sure to record each store s sales on the same 10 days chosen at random She records the sales in dollars for each store on these days as shown in the table below Day Store 1 Store 2 Difference Store 1 Store 2 Send data to calculator 1 2 3 48 4 527 967 654 645 575 1152 783 887 5 789 700 185 129 242 89 6 286 941 446 722 487 1179 630 848 a State the null hypothesis Ho and the alternative hypothesis H H H 0 b Determine the type of test statistic to use Type of test statistic Choose one 201 238 184 126 30 Based on these data can the owner conclude at the 0 10 level of significance that the mean daily sales of Store 2 exceeds that of Store 1 Answer this question by performing a hypothesis test regarding Hd which is u with a letter d subscript the population mean daily sales difference between the two stores Assume that this population of differences Store 1 minus Store 2 is normally distributed c Find the value of the test statistic Round to three or more decimal places 0 10 865 Perform a one tailed test Then complete the parts below Carry your intermediate computations to three or more decimal places and round your answers as specified If necessary consult a list of formulas d Find the critical value at the 0 10 level of significance Round to three or more decimal places 895 e At the 0 10 level can the owner conclude that the mean daily sales of Store 2 exceeds that of Store 1 OYes No H X 5 0 0 0 0 X a S 2 OSO 0 0 P Q olo 020 O

Statistics
Statisticsof tires Brand 1 and Brand 2 Though the two brands have been comparable in the past some technological advances were recently made in the Brand 2 manufacturing process and the consumer group is testing to see if Brand 2 will outperform Brand 1 Tread wear can vary considerably depending on the type of car and the group is trying to eliminate this effect by installing the two brands on the same 12 cars chosen at random In particular each car has one tire of each brand on its front wheels with half of the cars chosen at random to have Brand 1 on the left front wheel and the rest to have Brand 2 there After all of the cars are driven over the standard test course for 20 000 miles the amount of tread wear in inches is recorded as shown in the table below Car Brand 1 Brand 2 1 2 Difference Brand 1 Brand 2 Send data to calculator 3 4 5 6 0 40 0 58 0 56 0 62 0 35 0 45 0 45 7 0 35 0 50 0 43 0 35 0 39 0 42 0 28 8 a State the null hypothesis Ho and the alternative hypothesis H Ho H b Determine the type of test statistic to use Type of test statistic Choose one 0 05 0 08 0 13 0 27 0 04 0 03 0 17 0 16 0 37 0 45 0 34 0 61 0 32 0 21 0 41 0 41 0 47 9 10 c Find the value of the test statistic Round to three or more decimal places 0 Based on these data can the consumer group conclude at the 0 10 level of significance that the mean tread wear of Brand 1 exceeds that of Brand 2 Answer this question by performing a hypothesis test regarding which is with a letter d subscript the population mean difference in tread wear for the two brands of tires Assume that this population of differences Brand 1 minus Brand 2 is normally distributed d Find the critical value at the 0 10 level of significance Round to three or more decimal places 0 Perform a one tailed test Then complete the parts below Carry your intermediate computations to three or more decimal places and round your answers as specified If necessary consult a list of formulas e At the 0 10 level can the consumer group conclude that the mean tread wear of Brand 1 exceeds that of Brand 2 OYes No 0 04 0 07 0 14 0 09 1 12 X O 0 41 0 0 OSO 0 0 P Q olo 20 O

Statistics
StatisticsThe standard deviation of the daily demand for a product is an important factor for inventory control for the product Suppose that a pharmacy wants to estimate the standard deviation of the daily demand for a certain antibiotic It is known that the daily demand for this antibiotic follows an approximately normal distribution A random sample of 26 days has a sample mean of 123 orders for this antibiotic with a standard deviation of 10 orders Find a 90 confidence interval for the population standard deviation of the daily demand for this antibiotic Then give its lower limit and upper limit Carry your intermediate computations to at least three decimal places Round your answers to at least two decimal places If necessary consult a list of formulas Lower limit Upper limit X

Statistics
StatisticsReyesburg Corporation is contemplating using a new glue in the construction of its laminated veneer lumber Of importance to the company is the carrying load of the lumber The company has tested 25 beams using the new glue recording for each beam the pressure in pounds per square foot at which the beam broke The data collected are presented in the following histogram Relative frequency 1 0 8 0 6 0 4 0 2 0 4 0 0 3 0 2 0 1 0 Based on the histogram draw the ogive the cumulative relative frequency polygon for the Reyesburg data Cumulative relative frequency 0 00 Lo 0 16 860 0 2 0 00 0 36 860 880 900 920 940 Carrying load in pounds per square foot 880 0 16 0 00 900 0 00 0 12 920 960 0 00 940 Carrying load in pounds per square foot 0 00 960 X

Statistics
Statisticsthat the population of weights of all the plastic medals is approximately normally distributed The manufacturer claims that the standard deviation of this population is 0 23 grams You are a quality control specialist who wants to test this claim with a random sample of 21 plastic medals Based on your sample follow the steps below to construct a 90 confidence interval for the population standard deviation of the weights of all the plastic medals Then state whether the confidence interval you construct contradicts the manufacturer s claim If necessary consult a list of formulas a Click on Take Sample to see the results from the random sample Take Sample Point estimate of the population variance 1 Sample size 0 Left critical value 0 To find the confidence interval for the population standard deviation first find the confidence interval for the population variance Right critical value 0 Enter the values of the point estimate of the population variance the sample size the left critical value and the right critical value you need for your 90 confidence interval for the population variance Choose the correct critical values from the table of critical values provided When you are done select Compute Compute Number of plastic medals 21 Sample mean 0 00 34 87 0 00 90 confidence interval for the population variance Sample standard Sample variance deviation 0 46 90 confidence interval for the population standard deviation b Based on your sample graph the 90 confidence interval for the population standard deviation of the weights of all the plastic medals Critical values Left Right 0 995 7 434 0 005 39 997 X0 975 9 591 0 025 34 17 0 950 10 851 0 050 31 41 Enter the values for the lower and upper limits on the graph to show your confidence interval Round the values to two decimal places For the point enter the claim 0 23 made by the manufacturer on your graph 0 50 90 confidence interval for the population standard deviation 0 2116 O No the confidence interval does not contradict the claim The claimed standard deviation 0 23 is inside the 90 confidence interval O No the confidence interval does not contradict the claim The claimed standard deviation 0 23 is outside the 90 confidence interval c Does the 90 confidence interval you constructed contradict the manufacturer s claim Choose the best answer from the choices below O Yes the confidence interval contradicts the claim The claimed standard deviation 0 23 is inside the 90 confidence interval X O Yes the confidence interval contradicts the claim The claimed standard deviation 0 23 is outside the 90 confidence interval X 5 1 00 1 00

Statistics
StatisticsPilots who cannot maintain regular sleep hours due to their work schedule often suffer from insomnia A recent study on sleeping patterns of pilots focused on quantifying deviations from regular sleep hours A random sample of 24 commercial airline pilots was interviewed and the pilots in the sample reported the time at which they went to sleep on their most recent working day The study gave the sample mean and standard deviation of the times reported by pilots with these times measured in hours after midnight Thus if the pilot reported going to sleep at 11 p m the measurement was 1 The sample mean was 0 8 hours and the standard deviation was 1 6 hours Assume that the sample is drawn from a normally distributed population Find a 99 confidence interval for the population standard deviation that is the standard de tion of the time hours after midnight at which pilots go to sleep on their work days Then give its lower limit and upper limit Carry your intermediate computations to at least three decimal places Round your answers to at least two decimal places If necessary consult a list of formulas Lower limit Upper limit X Aa

Statistics
StatisticsMultiple myeloma is a form of cancer Doctors surmise that the drug Thalidomide may extend the lives of those afflicted with multiple myeloma In an extensive clinical trial 25 patients diagnosed as having multiple myeloma were treated with Thalidomide and the subsequent number of months that each survived was recorded Suppose that the following histogram summarizes the data from the sample Frequency 8 0 1 0 6 0 8 0 4 0 0 2 0 00 7 0 10 Based on the histogram draw the ogive the cumulative relative frequency polygon for the survival time data Cumulative relative frequency 8 6 20 30 Survival time in months 0 00 10 3 0 00 20 40 0 00 50 30 0 00 40 0 00 50

Statistics
StatisticsThe scores on an examination in finance are approximately normally distributed with mean 500 and an unknown standard deviation The following is a random sample of scores from this examination 447 465 491 529 565 572 Send data to calculator Send data to Excel Find a 90 confidence interval for the population standard deviation Then give its lower limit and upper limit Carry your intermediate computations to at least three decimal places Round your answers to at least two decimal places If necessary consult a list of formulas Lower limit Upper limit X

Statistics
StatisticsElectricity 15 kwh 1 100 ft3 03 10 Gal Gas Water A 208 50 B 601 35 Utilities Maintenance Jeff owns an apartment and uses 300 kwh of electricity 1000 ft of gas 450 gallons of water and internet and phone plans as described in the table He typically spends about 120 per month on maintenance costs Calculate his monthly utility and maintenance expenses C 196 35 D 316 35 Phone Internet 40 month 100 month 120 month

Statistics
Statisticsobjective of improving its response to complaints The variabl interest was defined as the number of days between when the complaint was made and when it was resolved Data were collected from 40 complaints that were made in the last year Use the data to complete parts a through d bel Click the icon to view the data table a Construct a 99 confidence interval estimate for the population mean number of days between the receipt of a complaint and the resolution of the complaint The 99 confidence interval estimate is from Round to one decimal place as needed Complaint Data 34 19 9 28 45 138 10 39 Days Between Complaint and Resolution of Complaint 25 7 118 17 7 96 59 24 43 108 42 131 6 15 23 19 days to 723BINAS 77 22 38 59 14 24 days 20 6 27 26 19 21 91 19 37 X

Statistics
StatisticsA political pollster is conducting an analysis of sample results in order to make predictions on election night Assuming a two candidate election if a specific candidate receives at least 55 of the vote in the sample that candidate will be forecast as the winner of the election You select a random sample of 100 voters Complete parts a through c below CIDO a What is the probability that a candidate will be forecast as the winner when the population percentage of her vote is 50 1 The probability is 0 1635 that a candidate will be forecast as the winner when the population percentage of her vote is 50 1 Round to four decimal places as needed b What is the probability that a candidate will be forecast as the winner when the population percentage of her vote is 59 The probability is 0 7920 that a candidate will be forecast as the winner when the population percentage of her vote is 59 Round to four decimal places as needed c What is the probability that a candidate will be forecast as the winner when the population percentage of her vote is 49 and she will actually lose the election The probability is that a candidate will be forecast as the winner when the population percentage of her vote is 49 Round to four decimal places as needed 4 th

Statistics
Statisticshave a lifetime of months but the lifetime varies slightly from battery to battery It is known that the population of all lifetimes of this model of car battery is approximately normally distributed A consumer report claims that the standard deviation of this population is 0 31 months You are a product reviewer who wants to test this claim with a random sample of 37 car batteries Based on your sample follow the steps below to construct a 99 confidence interval for the population standard deviation of all lifetimes of this model of car battery Then state whether the confidence interval you construct contradicts the report s claim If necessary consult a list of formulas a Click on Take Sample to see the results from the random sample Take Sample Point estimate of the population variance 0 Sample size 0 Left critical value 0 Right critical value 0 To find the confidence interval for the population standard deviation first find the confidence interval for the population variance Compute Number of car batteries 37 Enter the values of the point estimate of the population variance the sample size the left critical value and the right critical value you need for your 99 confidence interval for the population variance Choose the correct critical values from the table of critical values provided When you are done select Compute Sample mean 62 11 0 00 0 00 99 confidence interval for the population variance Sample standard deviation 0 53 99 confidence interval for the population standard deviation 0 50 Sample variance Critical values Left Right X0 995 17 887 X0 005 61 581 X0 975 21 336 X0025 54 437 b Based on your sample graph the 99 confidence interval for the population standard deviation of all lifetimes of this model of car battery 2 X0 950 23 269 0 050 50 998 Enter the values for the lower and upper limits on the graph to show your confidence interval Round the values to two decimal places For the point enter the claim 0 31 from the report on your graph 99 confidence interval for the population standard deviation 0 2809 O No the confidence interval does not contradict the claim The claimed standard deviation 0 31 is inside the 99 confidence interval O No the confidence interval does not contradict the claim The claimed standard deviation 0 31 is outside the 99 confidence interval x Yes the confidence interval contradicts the claim The claimed standard deviation 0 31 is inside the 99 confidence interval Yes the confidence interval contradicts the claim The claimed standard deviation 0 31 is outside the X c Does the 99 confidence interval you constructed contradict the report s claim Choose the best answer from the choices below X 3 5 5 1 00 1 00

Statistics
ProbabilityReal Estate Tax Property Tax 1 5 Purchase Price 200 000 Market Value 250 000 A 30 000 B 3 000 C 3 750 D 37 500 How much money will the owner of the home shown in the table have to pay in property taxes per year

Statistics
StatisticsMortgage Details How much of the first 180 000 payment for the 30 years mortgage described in the table will go 5 966 towards interest Principal Loan Length Interest Rate Monthly Payment A 750 00 B 216 00 C 386 40 D 579 60

Statistics
StatisticsMortgage Details Principal Loan Length Interest Rate Monthly Payment After 10 years the principal on this 150 000 30 years mortgage is 113 900 How much of the next 4 716 A 379 67 B 336 33 C 404 39 D 455 61 payment will go towards principal
Statistics
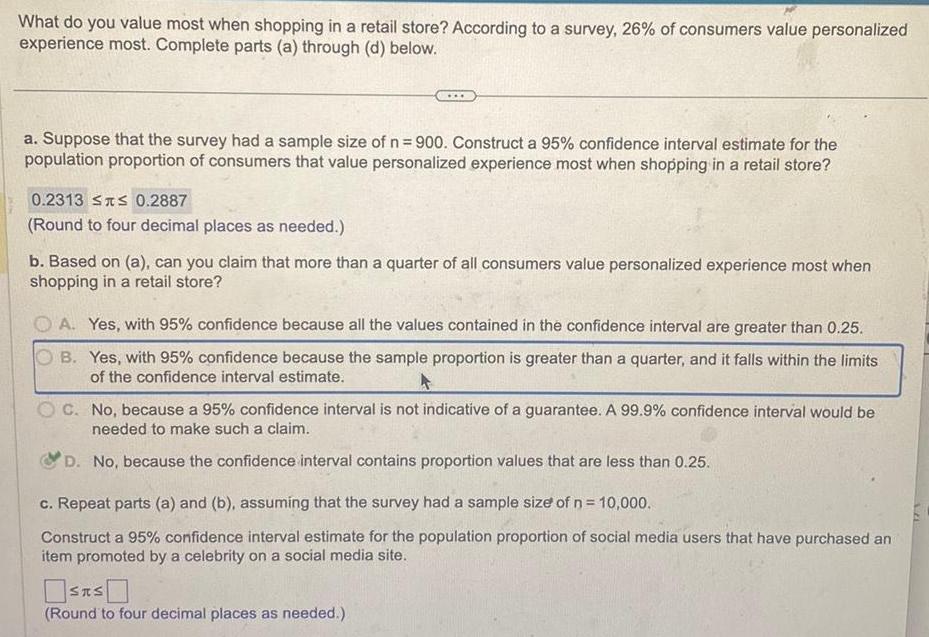
StatisticsWhat do you value most when shopping in a retail store According to a survey 26 of consumers value personalized experience most Complete parts a through d below a Suppose that the survey had a sample size of n 900 Construct a 95 confidence interval estimate for the population proportion of consumers that value personalized experience most when shopping in a retail store 0 2313 ST 0 2887 Round to four decimal places as needed b Based on a can you claim that more than a quarter of all consumers value personalized experience most when shopping in a retail store OA Yes with 95 confidence because all the values contained in the confidence interval are greater than 0 25 B Yes with 95 confidence because the sample proportion is greater than a quarter and it falls within the limits of the confidence interval estimate A C No because a 95 confidence interval is not indicative of a guarantee A 99 9 confidence interval would be needed to make such a claim D No because the confidence interval contains proportion values that are less than 0 25 c Repeat parts a and b assuming that the survey had a sample size of n 10 000 Construct a 95 confidence interval estimate for the population proportion of social media users that have purchased an item promoted by a celebrity on a social media site SAS Round to four decimal places as needed

Statistics
StatisticsClosing Costs Credit report Loan origination fee Attorney and notary Documentation stamp Processing fee 100 00 1 500 00 0 50 500 00 A 294 850 B 275 150 C 270 000 D 258 400 What is the total mortgage for a 300 000 purchase a 10 down payment and the closing costs shown in the table

Statistics
StatisticsA research center survey of 2 489 adults found that 1 880 had bought something online Of these online shoppers 1 226 are weekly online shoppers Complete parts a through c below a Construct a 95 confidence interval estimate of the population proportion of adults who had bought something online STS Round to four decimal places as needed

Statistics
Probability4 Pai rolls two dice then flips a coin then pulls a card out from a deck of cards What is the probability that she gets a odd number for the sum of the dice a heads for the coin flip and a spade from the deck of cards Note There are 4 suits in a deck of cards spades hearts clubs and diamonds
Statistics
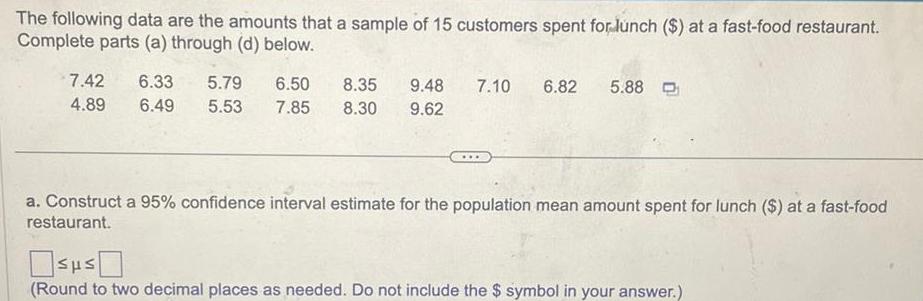
StatisticsThe following data are the amounts that a sample of 15 customers spent for lunch at a fast food restaurant Complete parts a through d below 7 42 6 33 5 79 6 50 8 35 9 48 7 10 6 82 4 89 6 49 5 53 7 85 8 30 9 62 5 88 a Construct a 95 confidence interval estimate for the population mean amount spent for lunch at a fast food restaurant Mps Round to two decimal places as needed Do not include the symbol in your answer

Statistics
StatisticsA large family held department store had the business objective of improving its response to complaints The variable of interest was defined as the number of days between when the complaint was made and when it was resolved Data were collected from 40 complaints that were made in the last year Use the data to complete parts a through d below Click the icon to view the data table a Construct a 95 confidence interval estimate for the population mean number of days between the receipt of a complaint and the resolution of the complaint The 95 confidence interval estimate is from Round to one decimal place as needed days to days

Statistics
Probability4 You buy two icecream cones one for you and one for your friend The probability that both both icecream cones are chocolate is 10 If you choose chocolate the probability that your friend also chooses chocolate is 20 What is the probability that you choose chocolate Show your work

Statistics
Statistics2 Each month a retail store awards a blue ribbon to its employee of the month The probability that Roberta is the employee of the month is 50 in May and 60 in April a Label the events in the word problem A and B b Write the formula as A B or BIA c What is the probability that she is awarded a blue ribbon in both May and April Show your work

Statistics
Probability5 Of the 102 customers at a restaurant 35 ate french fries and 55 ate hamburgers Of these customers 14 ate both Find the probability that a customer chosen at random ate french fries given that they ate a hamburger Show your work

Statistics
Probability6 You roll a dice 3 times What is the probability of rolling a 5 all three times Show your work

Statistics
StatisticsStandard Normal Table Page 2 2 8888888889 993995998 0 0 0 1 0 2 0 3 0 4 0 5 0 6 0 7 0 8 0 9 1 0 1 1 12 1 3 14 1 5 16 17 18 19 2 0 0 00 Standard Normal z Distribution Cumulative Area from the LEFT 5000 5398 5793 6179 6554 6915 6915 7257 7580 7881 8159 8413 8643 8849 9032 9192 9192 9332 9452 9554 9641 9713 9772 603 01 5040 5438 5832 6217 6591 6950 7291 7611 7910 8186 8438 RECE 8665 0060 8869 9049 9207 9345 9463 9564 9649 9719 9778 Gane 02 5080 5478 5871 6255 Click to view page 1 of the table Click to view page 2 of the table 6628 6985 7324 7642 7939 8212 8461 8686 8888 9066 9222 spor 9357 9474 9573 9656 9726 9783 0070 POSITIVE z Scores 03 5120 5517 5910 6293 6664 7019 7357 7673 7967 8238 8485 8708 8907 9082 9236 137 50 19910 9370 9484 9582 9664 9732 9788 2874 04 5160 5557 5948 6331 0931 cardo 6700 05 5199 5596 5987 6368 6736 7088 7422 7734 8023 7954 7054 7389 7704 7995 8264 8508 8729 8925 9099 9251 9382 9495 9505 9591 9599 9671 9678 9738 9793 0878 8289 8289 8531 8749 8944 COSMIN 9115 9265 9394 9744 9798 0045 06 5239 5636 6026 6406 6772 7123 7454 7764 8051 8315 20994 8554 8770 8962 9131 9279 9406 9515 9608 9686 9750 9803 ODAC 07 5279 5675 6064 6443 6808 7157 7486 7794 8078 6070 8340 8577 8790 8980 9147 9292 9418 9525 9616 9693 9756 9808 0050 08 5319 5714 6103 6480 6844 7190 7517 7823 8106 8365 8599 8810 8997 9162 0706 9306 9429 9535 9625 9699 9761 9812 GOCA 09 5359 5753 6141 6517 6879 7224 7549 7852 8133 8389 8621 8830 9015 9177 9319 9441 9545 9633 9706 9767 9817 0027 X Standard Normal Table Page 1 NEGATIVE z Scores 2 3 50 and lower 3 4 23 4 3 3 3 2 3 1 3 0 120 2 9 2 8 2 7 2 6 2 5 2 4 2 3 2 2 21 20 Standard Normal z Distribution Cumulative Area from the LEFT 00 0001 0003 0005 0007 0010 0013 0019 0026 0035 0047 0062 0082 0107 0139 0179 0228 01 0003 0005 0007 0009 0013 0018 0025 0034 0045 0060 0080 0104 0136 0174 0222 02 0003 0005 0006 0009 0013 0018 0024 0033 0044 0044 0059 0078 0102 0132 0170 0217 03 0003 0004 0006 0009 0012 0017 0023 0023 0032 0043 0057 0075 0099 0129 0166 0212 04 05 0003 0004 0006 0003 0004 0006 0008 0012 0016 0016 0023 0031 0041 0055 0073 0071 0096 0094 0125 0122 0162 0158 0207 0008 0011 0016 0022 0030 0040 0054 0202 06 0003 0004 0006 0008 0011 com LOUB 0015 0021 0029 0039 0052 0069 0091 0119 0154 0197 07 0003 0004 0005 0008 0011 0015 0021 0028 www w 0038 0051 0068 0089 0116 70 0150 0192 08 0003 0004 0005 0007 0010 0014 0020 0027 0037 0049 0066 0087 0113 0146 0188 115 09 0002 0003 0005 0007 0010 0014 0019 Cons 0026 0036 0036 0048 0064 0084 0110 0143 0183

Statistics
ProbabilityThe function f x 4 x 2 6 X 2 has an inverse f x defined on the domain x2 6 Find the inverse function Provide your answer below

Statistics
Statisticsperformance of two of her stores Store 1 and Store 2 Sales can vary considerably depending on the day of the week and the season of the year so she decides to eliminate such effects by making sure to record each store s sales on the same 10 days chosen at random She records the sales in dollars for each store on these days as shown in the table below Day Store 1 Store 2 Difference Store 1 Store 2 Send data to calculator 1 2 480 631 3 706 4 5 6 899 907 694 158 289 278 61 7 89 10 326 575 322 342 428 838 585 592 327 663 673 454 a State the null hypothesis Ho and the alternative hypothesis H Ho D H 0 b Determine the type of test statistic to use Type of test statistic Choose one 322 102 1 88 51 111 724 Based on these data can the owner conclude at the 0 10 level of significance that the mean daily sales of the two stores differ Answer this question by performing a hypothesis test regarding which is u with a letter d subscript the population mean daily sales difference between the two stores Assume that this population of differences Store 1 minus Store 2 is normally distributed 565 Perform a two tailed test Then complete the parts below Carry your intermediate computations to three or more decimal places and round your answers as specified If necessary consult a list of formulas c Find the value of the test statistic Round to three or more decimal places 0 d Find the two critical values at the 0 10 level of significance Round to three or more decimal places 0 and 0 e At the 0 10 level can the owner conclude that the mean daily sales of the two stores differ OYes O No X 4 X O S O O P Q OSO 020 S 00 O

Statistics
ProbabilityScatter plot shows the nur cars or expe Vrite an approximate equation of the line of best fit for the data It doesn t have to be the exact line of best fit Using your equation from part a predict the amount charged per hour by a dog sitter with 18 years of experience that you can use the graphing tools to help you approximate the line Amount charged in dollars ner per hour 20 18 16 14 12 10 erience X and the amount charged per hour y for each of 23 dog sitters in Ne y 6 0 X 8 x X X X X xx X X y X X Years of experience X x 8 10 12 14 16 18 20 22 X X a Write an approximate equation of the line of best fit 0 b Using your equation from part a predict the amount charged per hour by a dog sitter with 18 years experience

Statistics
Statisticsemployee It is known that the population of all these employee commute distances is approximately normally distributed The corporation claims that the standard deviation of this population is 8 44 km You are a recruiter who wants to test this claim with a random sample of 32 employees Based on your sample follow the steps below to construct a 90 confidence interval for the population standard deviation of all the employee commute distances Then state whether the confidence interval you construct contradicts the corporation s claim If necessary consult a list of formulas a Click on Take Sample to see the results from the random sample Take Sample Point estimate of the population variance 0 Sample size 0 Left critical value 0 Right critical value 0 Compute To find the confidence interval for the population standard deviation first find the confidence interval for the population variance Number of employees 32 Enter the values of the point estimate of the population variance the sample size the left critical value and the right critical value you need for your 90 confidence interval for the population variance Choose the correct critical values from the table of critical values provided When you are done select Compute 0 00 Sample mean t 0 00 17 95 90 confidence interval for the i population variance 2 00 90 confidence interval for the population standard deviation Sample standard deviation 5 79 4 00 2 5 00 Critical values Left Right 0 995 14 458 0 005 55 003 b Based on your sample graph the 90 confidence interval for the population standard deviation of all the employee commute distances 6 00 70 975 17 539 2 Enter the values for the lower and upper limits on the graph to show your confidence interval Round the values to two decimal places For the point enter the claim 8 44 made by the corporation on your graph 90 confidence interval for the population standard deviation Sample variance s 17 539 2 025 48 232 2 70 950 19 281 0 050 44 985 33 5241 O No the confidence interval does not contradict the claim The claimed standard deviation 8 44 is inside the 90 confidence interval 2 O No the confidence interval does not contradict the claim The claimed standard deviation 8 44 is outside the 90 confidence interval O Yes the confidence interval contradicts the claim The claimed standard deviation 8 44 is inside the 90 confidence interval 5 00 O Yes the confidence interval contradicts the claim The claimed standard deviation 844 is outside the X c Does the 90 confidence interval you constructed contradict the corporation s claim Choose the best answer from the choices below X 10 00 10 00 1 E


Statistics
Statisticstake action Over the course of the next few months he records the waiting times for each of a random selection of 25 post office visits made by him and other customers These waiting times in minutes are summarized in the following histogram 25 15 6 10 4 5 2 20 0 0 0 0 00 4 Based on the histogram draw the ogive the cumulative frequency polygon for Archie s data Cumulative frequency 0 6 8 8 12 18 Waiting time in minutes 0 00 6 2 0 00 12 24 0 00 30 18 0 00 24 0 00 30

Statistics
StatisticsIng x and the quiz score y for each of 25 students a Write an approximate equation of the line of best fit for the data It doesn t have to be the exact line of best fit b Using your equation from part a predict the quiz score for a student who spent 70 minutes studying Note that you can use the graphing tools to help you approximate the line Quiz score 100 90 80 70 60 50 40 30 20 10 0 J X XX X X 10 X X XX X X x x X 1 X XX xx X X X X 20 30 40 50 60 70 80 90 100 Time spent studying in minutes X a Write an approximate equation of the line of best fit b Using your equation from part a predict the quiz score for a student who spent 70 minutes studying

Statistics
Statisticsnew In the twentieth century it was a common practice in Southern California for houses to be built with pools in the back however that practice may be changing possibly as a measure to help reduce climate change A recent study examined a random sample of 13 houses built in Southern California in the twentieth century and an independent random sample of 65 new houses built in Southern California The sample of twentieth century houses contained 73 houses with pools and the sample of new houses contained 28 houses with pools Based on this survey can we conclude at the 0 05 level of significance that the proportion p of all Southern California twentieth century house that were built with pools is greater than the proportion p of all new Southern California houses that were built with pools Perform a one tailed test Then complete the parts below Carry your intermediate computations to three or more decimal places and round your answers as specified in the parts below If necessary consult a list of formulas a State the null hypothesis Ho and the alternative hypothesis H H 0 H 0 b Determine the type of test statistic to use Choose one c Find the value of the test statistic Round to three or more decimal places d Find the p value Round to three or more decimal places e Can we conclude that the proportion of Southern California twentieth century houses built with pools is greater than the proportion for new homes H x X 119 0 0 X O S 00 OSO P Q 010 A O O O