Statistics Questions
The best high school and college tutors are just a click away, 24×7! Pick a subject, ask a question, and get a detailed, handwritten solution personalized for you in minutes. We cover Math, Physics, Chemistry & Biology.
Statistics
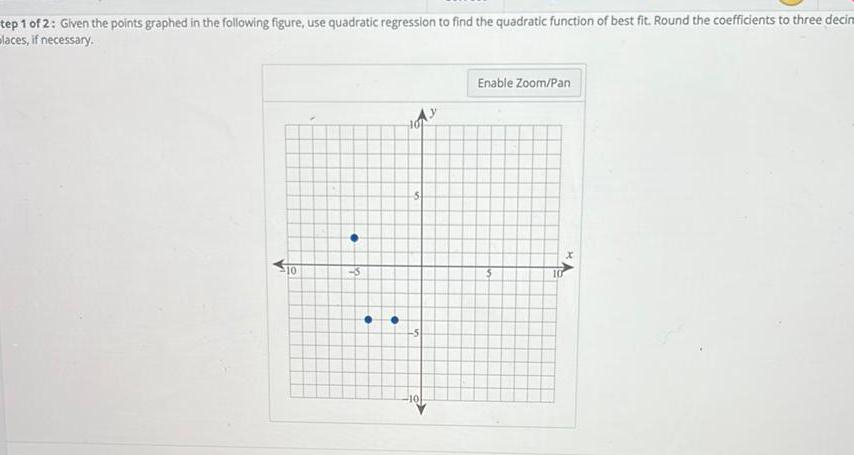
Statisticstep 1 of 2 Given the points graphed in the following figure use quadratic regression to find the quadratic function of best fit Round the coefficients to three decirm laces if necessary 10 5 5 Enable Zoom Pan KA 10

Statistics
StatisticsAssume a population of 2 4 and 9 Assume that samples of size n 2 are randomly selected with replacement from the population Listed below are the nine different samples Complete parts a through d below 2 2 2 4 2 9 a Find the value of the population standard deviation a Round to three decimal places as needed 4 2 4 4 Type integers or fractions c Find the mean of the sampling distribution of the sample standard deviations erros 4 9 9 2 9 4 b Find the standard deviation of each of the nine samples then summarize the sampling distribution of the standard deviations in the format of a table representing the probability distribution of the distinct standard deviation values Use ascending order of the sample standard deviations Probability 9 9

Statistics
Probability1 When two births are randomly selected the sample space for genders is bb bg gb and gg Assume that those four outcomes are equally likely Construct a table that describes the sampling distribution of the sample proportion of girls from two births Does the mean of the sample proportions equal the proportion of girls in two births Does the result suggest that a sample proportion is 1 an unbiased estimator of a population proportion For the entire population assume the probability of having a boy is the probability of having a girl is and this is not affected by how many boys or girls have previously been born 2 2 Determine the probabilities of each sample proportion Sample proportion of girls Does the mean of the sample proportions equal the proportion of girls in two births 1 OA Yes both the mean of the sample proportions and the population proportion are 2 OB No the mean of the sample proportions and the population proportion are not equal OC Yes both the mean of the sample proportions and the population proportion are 1 4 1 OD Yes both the mean of the sample proportions and the population proportion are Probability Type integers or simplified fractions

Statistics
Statistics3 A gamer wants to study how long he can play games between urination breaks He finds out that his mean gaming sprees lasts 5 hours with a standard deviation of 0 25 hours A What percentage of gaming sprees are between 4 5 hours and 5 25 hours Souler 230b 02 3104 cm 101 song sila n B What percent of gaming sprees are less than 4 75 hours nuo vam nil fimot so nes neli noll sileme nt thised inal noll syns ni jos 10 16 Sobotasem 4 200 25w froll nullsmo adipil 359 8 71 C What is the z score of a gaming spree lasting 4 25 hours D What proportion of gaming sprees last longer than 4 25 hours 4 The secretary at a company tries her best to answer all the phone calls she receives at the front desk Most calls are answered immediately but a few have to wait 5 or even 10 minutes to be answered Would the answer times be normally distributed Why or why not

Statistics
ProbabilityBased on a smartphone survey assume that 47 of adults with smartphones use them in theaters In a separate survey of 300 adults with smartphones it is found that 140 use them in theaters a If the 47 rate is correct find the probability of getting 140 or fewer smartphone owners who use them in theaters b Is the result of 140 significantly low O a If the 47 rate is correct the probability of getting 140 or fewer smartphone owners who use them in theaters is Round to four decimal places as needed b Is the result of 140 significantly low because the probability of this event is than the probability cutoff that corresponds to a significant event which is

Statistics
Statistics56 55 ere are the quiz scores from a period of geometry students at North High School 89 98 90 65 32 34 95 88 96 73 67 48 55 76 74 88 87 91 Find the percentile for someone who scores a 50 What does this value mean 57 74 84 74 2 Lions can be found in many countries in Africa Two examples are Somalia and Kenya Scientists wish to study lengths of lions in these two countries because it is an indication of good health In Somalia lion length has a mean of 8 feet with a standard deviation of 0 7 feet In Kenya lion length has a mean of 7 5 feet and a standard deviation of 1 1 feet Two lions were measured one from Kenya one from Somalia The Kenyan lion was 7 8 feet long The Somalian lion was 7 feet long A Find the z score for the Kenyan lion B Find the z score for the Somalian lion

Statistics
Probability3 Is a heart rate above 80 bpm independent of being below 10 000 ft How do you know Tell me with the math rule for independence

Statistics
Probability4 If the P A 0 4 the P B 0 3 and the P A and B 0 2 what is the P A or B addition rule

Statistics
ProbabilityA grocery store records the type of eggs purchased by every customer during the month of August Using the collected data the manager developed the following probability model Egg type Small Medium Large Jumbo Probability 0 14 0 28 0 45 Directions 1 What is the probability a randomly selected customer buys jumbo eggs 2 What is the probability a randomly selected customer buys a small or medium egg

Statistics
Statistics37 of 50 Opal has a Personal Auto Policy with Underinsured Motorists limits of 100 000 per person 300 000 per accident Opal is hit by a vehicle and suffers 250 000 in bodily injury The at fault vehicle has Liability Coverage with a 100 000 combined single limit How much can Opal receive from her UIM Coverage if her policy has a damages offset Opal s UIM coverage will pay damages in excess of the at fault party s limits up to her 300 000 per accident limit Opal s UIM coverage will pay damages in excess of the at fault party s limits up to her 100 000 per person limit Opal s policy will not pay anything since the at fault party has Liability Coverage Opal s UIM will not pay because her 100 000 per person limit will be reduced by their 100 000 CSL limit For 2 points

Statistics
Probabilityof Carol was sitting in her parked car when it was hit by a driver operating an 50 uninsured motor vehicle As a result Carol sustained injuries as did the driver of the other car Carol s Uninsured Motorists Coverage is available to provide coverage to whom Carol only the driver of the uninsured vehicle Carol and the driver of the uninsured vehicle no one since Carol s vehicle was parked For 2 points

Statistics
Probability7 Perform the indicated goodness of fit test In studying the responses to a multiple choice test question the following sample data were obtained At the 0 05 significance level test the claim that the responses occur with the same frequency Determine the test statistic and critical value Response A B C D E Frequency 12 15 16 18 19 Test statistic x 1 875 Critical value x 9 488 Test statistic x 1 875 Critical value x 11 071 O Test statistic x 9 488 Critical value x 11 071 O Test statistic x 0 178 Critical value x 9 488

Statistics
Statistics8 Formulate the indicated conclusion in nontechnical terms Be sure to address the original 1 point claim The owner of a football team claims that the average attendance at games is over 69 400 and he is therefore justified in moving the team to a city with a larger stadium Assuming that a hypothesis test of the claim has been conducted and that the conclusion is failure to reject the null hypothesis state the conclusion in nontechnical terms There is not sufficient evidence to support the claim that the mean attendance is greater than 69 400 There is sufficient evidence to support the claim that the mean attendance is less than 69 400 There is not sufficient evidence to support the claim that the mean attendance is less than 69 400 There is sufficient evidence to support the claim that the mean attendance is greater than than 69 40

Statistics
Statistics1 Which statement is true about using simulation to compare two populations 1 point The experimental probability must equal the theoretical probability O Simulations can only be used if a population is uniformly distributed OIt is possible to observe how probability works with real items One trial of a simulation is usually sufficient for drawing conclusions

Statistics
Statistics10 Use the traditional method to test the given hypothesis Assume that the population is normally distributed and that the sample has been randomly selected Select the appropriate response Heights of men aged 25 to 34 have a standard deviation of 2 9 Use a 0 05 significance level to test the claim that the heights of women aged 25 to 34 have a different standard deviation The heights in inches of 16 randomly selected women aged 25 to 34 are listed below Round the sample standard deviation to five decimal places 62 13 65 09 64 18 66 72 63 09 61 15 67 50 64 65 63 80 64 21 60 17 68 28 66 49 62 10 65 73 64 72 Select the correct test statistic and critical value Test statistic x 12 5689 Critical values x 6 262 27 488 Test statistic x 9 2597 Critical values x 5 162 279 570 O Test statistic x 6 2989 Critical values x 6 262 27 488 O Test statistic x 9 2597 Critical values x 6 262 27 488 1

Statistics
Statistics15 Find the slope of the equation of the least squares regression line for the dataset in the table 1 point x y 1 15 3 17 6 18 7 18 9 20 15 24 16 23 22 26 23 27 28 30 33 32 00 52 01 91 O15 14

Statistics
Statistics6 Construct a scatterplot and identify the mathematical model that best fits the data Assume that the model is to be used only for the scope of the given data and consider only linear quadratic logarithmic exponential and power models Use a calculator or computer to obtain the regression equation of the model that best fits the data You may need to fit several models and compare the values of R x 4 8 12 16 20 y 40 20 11 37 97 Oy 0 33x 0 24x 44 8 Oy 82 38 275x Oy 8 275 82 3x Oy 163 26 76 91 In x

Statistics
StatisticsAt a high school debate tournament half of the teams were asked to wear suits and ties and the rest were asked to wear jeans and t shirts The results are given in the table below At the 0 05 significance level test the hypothesis that the proportion of wins is the same for teams wearing suits as for teams wearing jeans Win Loss Suit 22 28 T shirt 28 22 Select the correct degrees of freedom Odf 4 Odf 1 Odf 2 16

Statistics
StatisticsAssume that a hypothesis test of the given claim will be conducted Identify the type I or type II error for the test A medical researcher claims that 6 of children suffer from a certain disorder Identify the type I error for the test 1 point Reject the claim that the percentage of children who suffer from the disorder is equal to 6 when percentage is actually 6 Reject the claim that the percentage of children who suffer from the disorder is different from 6 when that percentage really is different from 6 OFail to reject the claim that the percentage of children who suffer from the disorder is equal to 6 when that percentage is actually different from 6 OFail to reject the claim that the percentage of children who suffer from the disorder is equal to 6 when that percentage is actually 6

Statistics
StatisticsCandidates who wish to be elected to the United States Senate expect that a certain type of ballot will be used to elect them Which of the following best describes that type of ballot O alternative ballot Otraditional ballot O conventional ballot
Statistics
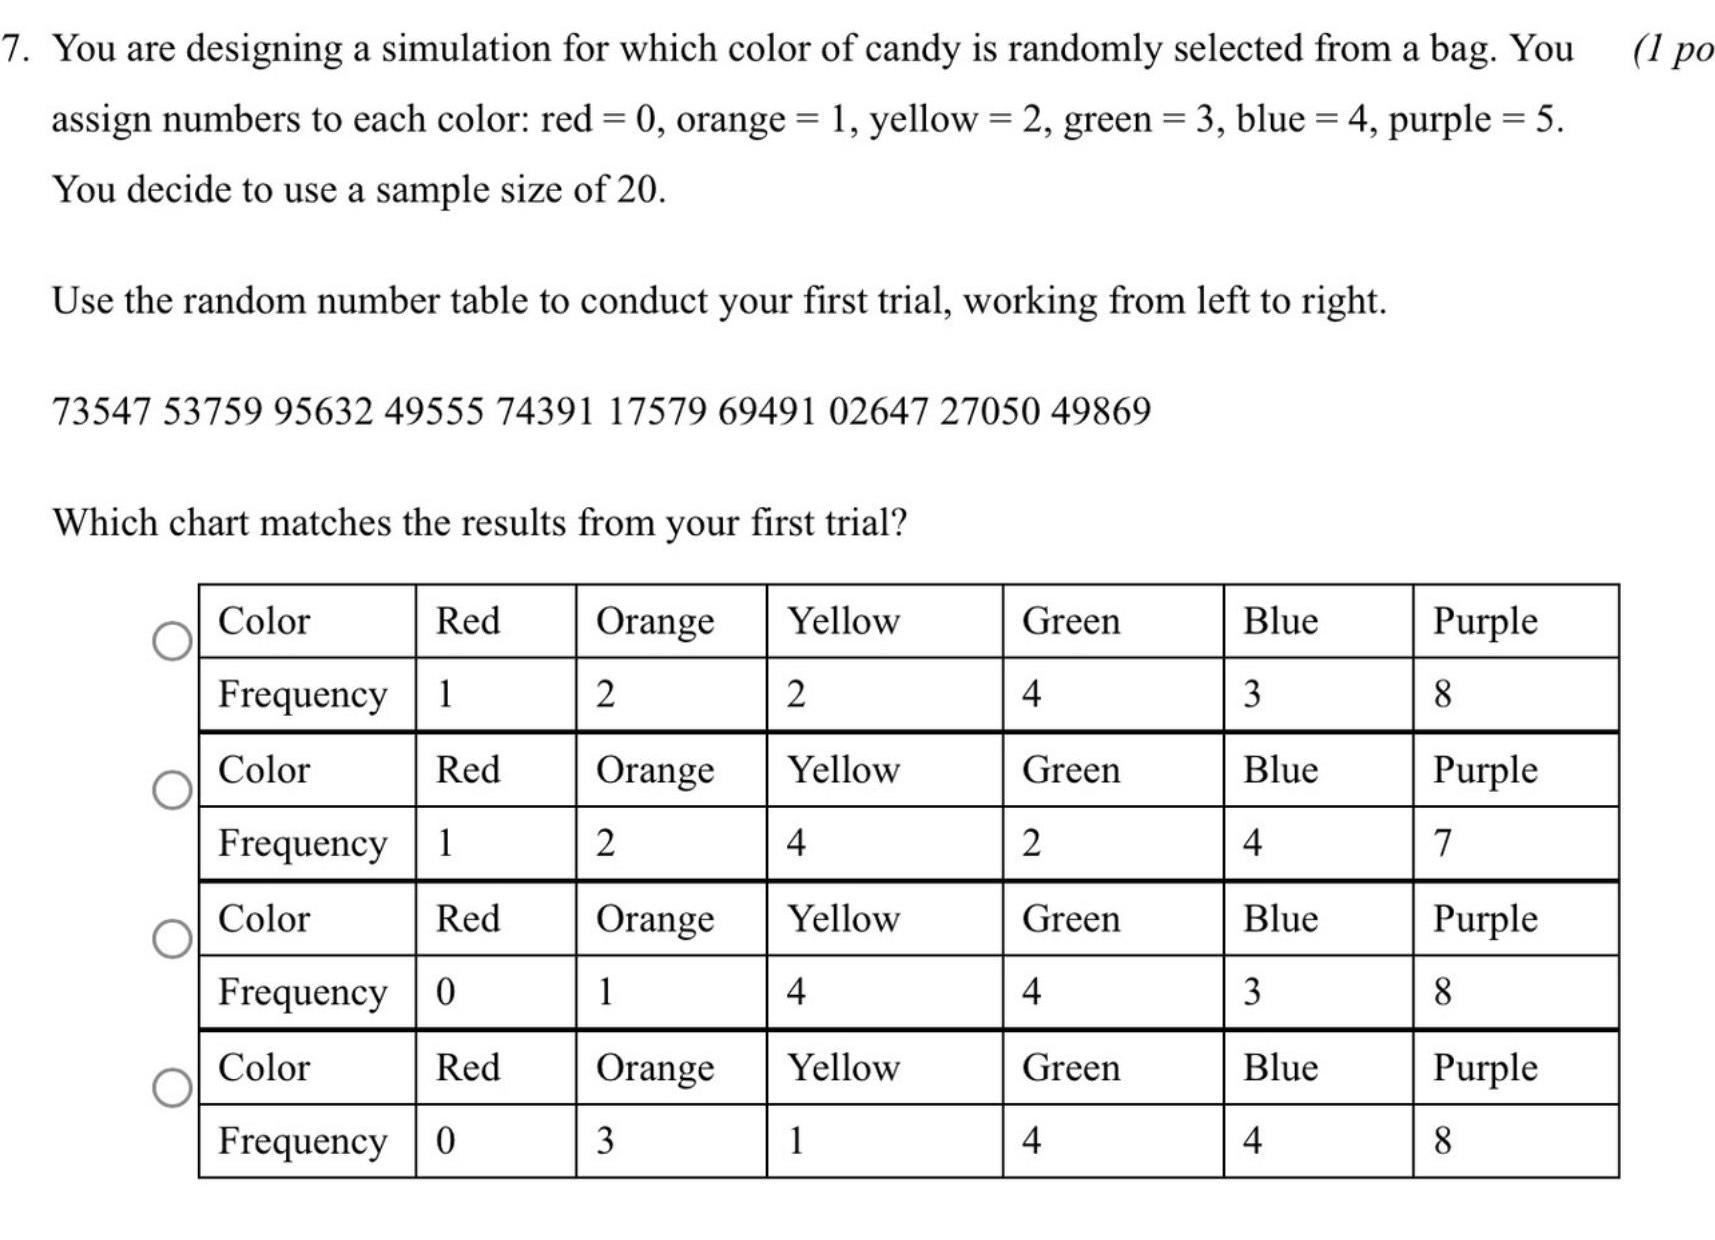
Statistics7 You are designing a simulation for which color of candy is randomly selected from a bag You assign numbers to each color red 0 orange 1 yellow 2 green 3 blue 4 purple 5 You decide to use a sample size of 20 Use the random number table to conduct your first trial working from left to right 73547 53759 95632 49555 74391 17579 69491 02647 27050 49869 Which chart matches the results from your first trial Color Frequency Color Frequency Color Red 1 Red 1 Red Frequency 0 Color Red Frequency 0 Orange 2 Orange 2 Orange 1 Orange 3 Yellow 2 Yellow 4 Yellow 4 Yellow 1 Green 4 Green 2 Green 4 Green 4 Blue 3 Blue 4 Blue 3 Blue 4 Purple 8 Purple 7 Purple 8 Purple 8 1 po

Statistics
Probability3 Simon constructed an online survey for campers to determine which sports were the most popular at his sports camp Simon is almost finished creating the preference schedule shown Using a Borda count which of the following is the correct point amount for swimming number of votes 1st 2nd 3rd 150 15 100 30 50 45 O100 45 50 15 soccer swimming baseball baseball swimming soccer

Statistics
StatisticsUse the given degree of confidence and sample data to find a confidence interval for the population standard deviation 6 Assume that the population has a normal distribution Round the confidence interval limits to the same number of decimal places as the sample standard deviation College students annual earnings 98 confidence n 9 x 3959 s 886 O 539 o 1734 598 o 1697 O 697 o 1156 O 559 o 1953

Statistics
StatisticsRandornly selected individuals at a fashion store were asked how many fashion accessories they currency are displayed in the following frequency table Which histogram accurately summarizes the data Value 9 40 12 13 3 Frequency 4 0 2 16 10

Statistics
Statistics0 Use the given process data to construct a control chart for p Data was collected for the number of births per 10 000 people in the United States of America for 20 consecutive years Below is the data for those 20 consecutive years Construct a p chart and answer the question below 157 160 164 167 167 162 158 154 150 146 144 142 143 142 144 141 139 141 140 140 Select the correct overall mean proportion OP 0 012 OP 0 025 OP 0 005 OP 0 015

Statistics
ProbabilityDo Generation X and Boomers differ in how they use credit cards A sample of 1 000 Generation X and 1 000 Boomers revealed the results in the accompanying table a If a respondent selected is a member of Generation X what is the probability that he or she pays the full amount each month b If a respondent selected is a Boomer what is the probability that he or she pays the full amount each month c Is payment each month independent of generation Click the icon to view the table a If a respondent selected is a member of Generation X what is the probability that he or she pays the full amount each month Round to three decimal places as needed

Statistics
StatisticsThe editor of a textbook publishing company is trying to decide whether to publish a proposed business statistics textbook Information on previous textbooks published indicate that 20 are huge successes 30 are modest successes 40 break even and 10 are losers However before a publishing decision is made the book will be reviewed In the past 99 of the huge successes received favorable reviews 60 of the moderate successes received favorable reviews 50 of the break even books received favorable reviews and 20 of the losers received favorable review Complete parts a and b a If the proposed textbook receives a favorable review how should the editor revise the probabilities of the various outcomes to take this information into account The probability that if the proposed textbook receives a favorable review the book will be a huge success is 331 Round to three decimal places as needed The probability that if the proposed textbook receives a favorable review the book will be a modest success is 301 Round to three decimal places as needed The probability that if the proposed textbook receives a favorable review the book will break even is 334 Round to three decimal places as needed The probability that if the proposed textbook receives a favorable review the book will be a loser is 0 033 Round to three decimal places as needed b What proportion of textbooks receives favorable reviews The proportion of textbooks that receive a favorable reviews is 59 8 Round to three decimal places as needed

Statistics
Statistics2 A manager wants to determine if an employee training program has increased her employees customer satisfaction ratings She randomly selects ten of the participating employees and compares their customer satisfaction ratings before and after the training The results are shown in the table Employee Before After Difference 1 2 3 4 5 6 7 8 9 10 4 2 4 3 3 7 3 6 3 2 2 9 3 0 1 3 1 4 1 2 8 2 8 4 3 6 3 3 4 2 2 9 2 7 4 2 0 1 3 7 0 10 0 1 0 10 0 1 0 1 0 10 0 2 0 1 The manager s null hypothesis is that 0 while her alternative hypothesis is D 0 Based on the data in the table and using a significance level of 0 05 what is the correct P value and conclusion 1 point With a t statistic of 1 4639 and a P value of 0 088627 she must reject the null hypothesis With a t statistic of 4 6291 and a P value of 0 000619 she must reject the null hypothesis With a t statistic of 1 4639 and a P value of 0 088627 she must fail to reject the null hypothesis With a t statistic of 4 6291 and a P value of 0 000619 she must fail to reject the null hypothesis

Statistics
Statistics3 Construct a scatterplot for the given data 11 5 19 4 17 2 y 93 37 27 49 55 3 X O 100 O 100 O 100 OHHH 100 100 100 100 O O 100 100 100 100 O O O O O O 100 x 100 x 100 x 100 x 1 point

Statistics
ProbabilityUse the contingency table below to find the probability of the following events a A B b AB c A B d Are events A and B independent a P A B 0 03 Round to two decimal places as needed A A B 10 20 B 20 50

Statistics
Statistics4 A correlation coefficient of 0 15 would indicate what kind of relationship A Strong Positive B Weak Positive C No relationship 5 Sebastian has a chini standard D Weak Negative E Strong Negative

Statistics
StatisticsThe table below shows the increase in calories in a bag of chips over the years Find the line of best fit Oy 1 7a 3 252 Oy 1 7a 3 252 Oy 1 9 3 634 Oy 1 923 634 Year Calories 2000 80 2004 100 2008 2012 2016 110 130 150

Statistics
Statistics23 In the diagram of circle O below diameter RS chord AS tangent TS and secant TAR are drawn Complete the following proof to show RS 2 RA RT Statements Reasons D 10 A S

Statistics
Statistics7 8 Use the Comparison Theorem for improper integrals to determine whether the integral is convergent or divergent Which of following integrals is are convergent Select all of them of tan 12 5 ex x 3 4 x dr 5 e x dr 5x da 23 3 da

Statistics
StatisticsFrequency 6 8 6 2 How many of the test scores are at least 65 0 50 60 70 80 90 100 11 Test Scores What is the most frequent interval for the test scores 65 75 Basic Interval

Statistics
StatisticsYou saw graphs in this lesson such as the one below that compared the recommended amount of dark green vegetables to eat to the average intake for each age group What are some issues that might affect the accuracy of the average intake of people in each age group Cup Equivalents 3 2 5 2 1 5 0 5 0 9 13 Dark Green Vegetables Recommended Intake Ranges 14 18 19 30 Males years 31 50 51 70 71 3 2 5 2 1 5 0 5 Average Intake I III 19 30 31 50 Females years 51 70 71

Statistics
Statistics4 Multiple Regression with Cigarettes Use the sample data given in Review Exercise 1 Cigarette Tar and Nicotine a Find the multiple regression equation with the response y variable of amount of nicotine and predictor x variables of amounts of tar and carbon monoxide Tnt of 1 5 g oi nicotine Tar CO 25 18 27 16 20 16 216 24 20 16 20 16 21 14 24 17

Statistics
StatisticsIl Co manufactures a single product and has drawn up the following flexed budget for me year Level of activity Cost items Direct materials 120 000 160 000 Direct labour 90 000 120 000 Production OH 54 000 62 000 Other OH 40 000 40 000 Total cost 304 000 382 000 What would be the total cost in a budget that is flexed at the 75 level of activity Show our working 60 S 70 S 140 000 105 000 58 000 40 000 343 000 80 S

Statistics
StatisticsConsider a standard form linear programming problem with 6 C2 4 5 Suppose that we are told that the reduced cost coefficient vector corresponding to some basis is r 0 1 0 0 201 1 0 0 0 3 1 0 A 1 b a Find an optimal feasible solution to the problem b Find 0 9

Statistics
StatisticsIn a study investigating a possible relationship between cell phone use and cancers located in the head a research collected data from volunteers What kind of selective reporting is occurring O not reporting all of the data O poorly chosen sample O comparing things that are not comparable O failing to report all results

Statistics
Statisticsof each month is 5000 and the anuity period is 5 years The annual interest rate is calculated every A 3 6 6 months Find the present value and the final value

Statistics
StatisticsThe data in the graph shows the age distribution of veterans living in the state of California with the vertical black line indicating the nationwide data value Which statement below is true 18 to 29 years 30 to 44 years 45 to 54 years 55 to 64 years 65 years or older 0 Age Distribution State 10 20 U S and PR Percent 2018 Gynon Inc O The 65 and older category is the modal class 30 The mean age is between 45 to 54 years old 40 The age group most different from the nation is 30 to 44 years old 50 There are fewer in the 18 to 29 year old age group than typical in the nationwide distribution

Statistics
StatisticsQ6 25 POINTS Consider the following data One of the stores is a proud sponsor of the college soccer team They constantly try to raise money for the team and they want to determine if there is any type of relationship between the amount of contribution and the years that the alumnus has been out of school Years X Contribution Y 300 250 200 150 100 NOTE For the following questions you can use excel analysis or a calculator it is your choice The scatter plot might give you most of the necessary information a Using Excel construct a scatter plot Discuss the output of the scatter plot Chart Title 50 0 1 250 1 2 5 3 10 100 110 0 3 4 6 70 5 6 Years Contribution 6 2 80 175 7 3 e very important Based on the above values in detail draw the conclusion Discuss the correlation coefficient r 8 8 25 9 4 120 b Give or calculate the correlation coefficient c Give or calculate the coefficient of determination d Give or calculate the regression equation coefficients Give the equation of regression Discuss the coefficient of determination r Discuss in detail the meaning of the regression equation f unrelated to the previous data A company has a set of data with employee age X and the corresponding number of annual on the job accidents Y Analysis on the set finds that the regression equation is Y 120 3 0 X

Statistics
Statisticsrt 1 The graphs of f x is shown below 9 8 7 6 5 4 3 2 1 1 2 3 4 5 6 7 8 9 10 x is increasing for x E 10 9 8 7 6 5 4 3 2 1 e average rate of change of y f x over the erval 4 0 is interval notation is decreasing for 1 2 Enter your answer

Statistics
ProbabilitySuppose that the random variables Z Z and Z3 have the sample cor relation matrix R 1 1 5 1 4 1 5 1 1 3 1 4 1 3 1 i Find the exact one factor solution for the correlation matrix R and write down the factor loadings and specific variances for the one factor model 9 ii Use the principal component method to calculate the factor loadings and specific variances of the two factor solution for R 9

Statistics
Statistics2007 Federal Income Tax Table Single Over 0 But not over The tax is 7 825 7 825 31 850 31 850 77 100 77 100 160 850 160 850 349 700 349 700 And Over 10 of the amount over 0 788 15 of the amount over 7 825 4 386 25 of the amount over 31 850 15 699 28 of the amount over 77 100 39 149 33 of the amount over 160 850 101 469 35 of the amount over 349 700 Jason earned 30 900 in taxable income He figured his tax from the single taxpayer table above 1 Found his earned income level 2 Entered the base amount 3 Found the amount over 7 825 4 Multiplied line 3 by 15

Statistics
StatisticsSet up an annual interest rate at 1 8 calculated quarterly If someone wants to receive 100 000 A month for 10 years after the 5th year How much should they deposit

Statistics
StatisticsPlot those points on the graph below 1300 1200 1100 1000 900 800 700 600 500 400 300 200 100 100 10 Clear All Draw Dot 20 OF 30 OF 40 V What was the highest elevation she reached during this hike 1200 feet 50 What was the most common elevation during this hike minutes 900 What was the duration of the entire hike 90 feet per minute 60 During what time interval her elevation increasing 70 During what time interval her elevation decreasing S 80 90

Statistics
Statistics27 10 000 is paid at the beginning of each quenter for a annual V total of 10 years Interest rate is 4 calculated once The 1st payment is set in the 6th year Find the A year present value theek

Statistics
StatisticsIn presenting the following data to the client a market research firm warns that word of mouth plays the strongest re in sales when a group has negative reactions to a product Why would this statement be significant to this study Male Female Total Love 312 214 526 Like 189 59 248 Unsure 32 18 Dislike 10 Hated 13 256 267 Total 556 558 1114 11 50 21 ONearly half of the women polled had strongly negative reactions to the product ONearly half of the women polled had strongly positive reactions to the product ONearly half of the men polled had strongly negative reactions to the product ONearly half of the men polled had strongly positive reactions to the product