Statistics Questions
The best high school and college tutors are just a click away, 24×7! Pick a subject, ask a question, and get a detailed, handwritten solution personalized for you in minutes. We cover Math, Physics, Chemistry & Biology.


Statistics
StatisticsLiva s Lumber Inc manufactures three types of plywood The following table summarizes the production hours per unit in each of three production operations and other data for the probl Operations hours Plywood Grade A I 2 units units II Grade B Grade X 10 Maximum time available 950 450 5 2 5 3 III 4 2 2 700 How many units of each grade of lumber should be produced Grade A Grade B Profit Unit 40 30 20

Statistics
Statisticsa s Lumber Inc manufactures three types of plywood The following table summarizes the production hours per unit in each of three production operations and other data for the pr Plywood ade A ade B Grade A Grade B Grade X Operations hours I units units 2 5 10 II 2 5 3 Maximum time available 950 450 III 4 2 2 w many units of each grade of lumber should be produced 700 Profit Unit 40 30 20

Statistics
StatisticsWhich of the following best describes women s reactions to the product tested Male Female Total 214 526 Love 312 Like 189 59 Unsure 32 18 Dislike 10 Hated 13 256 Total 556 558 1114 11 248 50 21 267 OA large majority loved or hated it OA large majority had positive responses to it OA large majority had negative responses to it A large majority we

Statistics
StatisticsUse the table to find the yearly premium Typical Annual Life Insurance Premiums for Males per 1 000 Face Value Age 10 Year Ordinary Term Whole Life 21 72222222285286585387 24 29 30 31 33 34 39 40 4 02 a 4 06 b 4 10 4 15 4 20 4 29 4 41 4 54 4 69 4 87 5 07 5 29 5 54 5 81 6 11 6 43 6 76 7 12 7 53 8 00 11 01 11 34 11 69 12 05 12 44 12 86 13 30 110 25 558 50 13 77 14 26 14 78 15 33 15 90 16 50 17 13 17 81 18 52 19 26 20 04 20 87 21 75 103 75 20 Payment Life 19 46 19 89 20 32 20 78 21 27 21 79 22 34 22 91 23 51 24 12 24 75 25 40 26 06 26 76 27 48 28 23 28 99 29 79 30 62 31 50 20 Year Endowment 42 07 42 15 42 24 42 34 42 45 42 56 42 67 42 79 Notes 1 For semiannual premiums use 51 of the annual rate 2 For quarterly premiums use 26 of the annual rate 42 92 43 05 43 19 43 33 43 48 Christina is twenty seven years old She wishes to purchase 25 000 of twenty year term insurance What will be her annual premium 43 64 43 81 44 00 44 19 44 40 44 63 44 87 3 For monthly premiums use 9 of the annual rate 4 For females use the age of a male three years younger

Statistics
Probability1 Solve for the following quantities given the matrices below L E X 3 0 5 2 j3 In j3 j123 1 5 1 Im 0 3j 3 2 j 5 5 3 5 j sinj 0 2 j0 5 1 3 5 4 11 7 1 5 9 1 LEX 2 LT XT 3 A23 of L M31 of E A12 of X 4 El use Laplace Cofactor 5 IX use Pivotal Method j 3 j

Statistics
Statistics1 Anthropologists use a linear model that relates femur length to height The model allows an anthropologist to determine the height of an individual when only a partial skeleton including the femur is found In this problem we find the model by analyzing the data on femur length and height for the eight males given in the table a Find and graph a linear equation that models the data y b An anthropologist finds a femur of length 58 cm How tall was the person Femur length cm 50 1 48 3 45 2 44 7 44 5 42 7 39 5 Height cm 178 5 173 6 164 8 163 7 168 3 165 0 155 4

Statistics
Statistics1 Cigarette Tar and Nicotine The table below lists measured amounts mg of tar carbon monoxide CO and nicotine in king size cigarettes of different brands from Data Set 13 Cigarette Contents in Appendix B a Is there sufficient evidence to support a claim of linear correlation between tar and nicotine Tar CO omg I nicotine 25 18 27 16 20 16 24 16 20 16 20 16 NX 21 14 24

Statistics
StatisticsA study was done to study the effect of ambient temperature x on the electric power consumed by a chemical plant y Other factors were held constant and the data were collected from an experimental pilot plant y BTU x F 250 27 285 320 295 Question 4 Complete the table below SU M Elec tric Pow er y 250 285 320 295 265 298 267 321 45 72 58 Bla nk 25 Am bie nt Tem per atu re X 27 45 72 58 31 60 34 74 Bla nk 26 y BTU 265 298 267 321 xy Bla nk 1 Bla nk 4 Bla nk 7 Bla nk 10 Bla nk 13 Bla nk 16 Bla nk 19 Bla nk 22 Bla nk 27 x Bla nk 2 Bla nk 51 29 Points Bla nk 8 00 Bla nk 11 Bla nk 14 Bla nk 17 Bla nk 20 Bla nk 23 Bla nk x F 28 31 60 34 74 y Bla nk MI 3 Bla nk 6 Bla nk 9 Bla nk 12 Bla nk 15 Bla nk 18 Bla nk 21 Bla nk 24 Bla nk 29


Statistics
StatisticsIn the above study researchers simulated road conditions and tested 150 drivers from 49 states Each driver was given a particular technology to use while driving The baseline group did not use any technology Manual refers to manual texting Which of the following would correct the greatest flaw in this study Number of Missed Lights Missed Response Events Across All Participants 10 9 654 32 0 Baseline Manual Siri Vingo 2018 Gynyon Inc O testing a driver from the 50th state O testing each driver using each technology Otesting more drivers O testing drivers outside the laboratory

Statistics
Statistics2 A scatter plot showing the cost of refrigerators based on their capacity is shown below The scatter plot has a line of best fit drawn Predict how much a refrigerator with a capacity of 8 cubic feet would cost Cost is money so make sure you use the correct units 2 points Cost and Capacity of the Refrigerators Total Cost dollars 1000 800 600 400 200 5 10 15 20 Capacity cubic feet 25

Statistics
Statistics2 The table below shows the number of new stores in a coffee shop chain that opened during the years 1986 through 1994 Year 1986 1987 1988 1989 1990 1991 1992 1993 1994 Number of New Stores 14 27 48 80 110 153 261 403 681 Using x 1 to represent the year 1986 and y to represent the number of new stores write the exponential regression equation for these data Round all values to the nearest thousandth

Statistics
StatisticsMarket researchers conducted a study about which words most affected young consumers who regularly bought t Based on the data which words had the most appeal for consumers ages 22 26 Comforting Refreshing Ages 18 22 Ages 22 26 Total Invigorating 31 59 Calming 13 47 Soothing 18 Total 168 62 15 38 11 56 182 O comforting calming soothing O comforting refreshing invigorating O comforting refreshing calming O refreshing calming soothing 93 74 51 58 74 350

Statistics
StatisticsAmong the entire student body of 400 students 230 have taken at least one semester of a foreign language You believe the proportion of seniors who have taken at least one semester for a foreign language is higher compared the entire student body and decide to test your hypothesis with a significance level of 0 05 Of a sample of 80 seni 52 have taken at least one semester of a foreign language Perform the z test and interpret your results Alpha a a 0 1 0 05 0 01 The z score is 1357 You should reject the null hypothesis O The z score is 1357 You should not reject the null hypothesis O The z score is 1 357 You should reject the null hypothesis O The z score is 1 357 You should not reject the null hypothesis 1 28 1 645 1 645 1 96 2 33 2 575

Statistics
ProbabilityIn a school 60 of the students have brown eyes Find the experimental probability that in a group of 4 students at least one of them has brown eyes The problem has been simulated by generating random numbers The digits 0 9 were used Let numbers 2 4 and 8 represent the 30 of students with brown eyes A sample of 20 random numbers is shown 13 20 6075 7918 7910 2546 1390 1230 2386 0793 7359 3048 5621 9732 2816 6147 5978 9436 3806 5971 6173 1430 0 65 Experimental Probability

Statistics
StatisticsWhich of the following best describes the responses of voters who strongly disagreed with the message tested Independent Third Party Strongly agree Agree Unsure Disagree Strongly disagree Total Republican Democrat 10 5 9 13 17 54 22 16 11 24 4 77 1 7 11 15 19 53 Total 33 28 31 52 40 184 Its members are divided relatively evenly among all three political groups Its members primarily belong to the Democratic party Its members primarily belong to the Republican party or are independent Third Party voters O Its members primarily belong to the Democratic party or are Independent Third Party voters

Statistics
Statisticsologists have observed that the chirping rate of crickets of a certain species appears to be related to temperature The table shows the chirping rates for various temperatures a Find and graph the regression line y b Use the linear regression to estimate the chirping rate at 100 F Temperature F 50 55 60 65 70 75 80 85 90 Chirping Rate chirps min 20 46 79 91 113 140 173 198 211

Statistics
StatisticsA leading automaker spends 17 million on a study to test the hypothesis that cars are safer to drive at speeds excess of 90 MPH How would Zillak and McCloskey criticize this study Chose all statements that apply The automakers are too focused on a specific result The automakers are ignoring the spiritual value of the study s results The automakers are ignoring the cost of their study Automakers are not spending enough money on this study to get accurate results It is dangerous to drive a car 90 miles an hour

Statistics
Probability1 10 points Let x be a number of card that a randomly selected auto mechanic repaires in a given day The following table lists the probability distribution of x 2 x P x a Find the value of the missing probability b Find the mean and standard deviation of the random variable x c Find P x 4 3 0 1 4 0 3 5 0 2 6 0 1

Statistics
StatisticsCategory Food Mortgage Car Loan Electric Phone Water Sewer Internet Gas Repairs Movie Newspaper Savings Insurance Donations Miscellaneous O month 1 O month 2 Month 1 275 772 40 152 54 O month 3 225 45 18 20 80 0 20 45 299 240 60 Month 2 300 772 40 152 54 The highest spending for food occurred in 190 65 18 20 80 119 20 0 180 140 60 Month 3 325 772 40 152 54 207 21 75 18 20 80 0 20 0 299 140 60

Statistics
Statistics6 Jean invested 380 in stocks Over the next 5 years the value of her investment grew as shown in the accompanying table Years Since Investment x 0 1 2 0 3 5 Value of Stock in Dollars y 380 395 427 445 462 Write the exponential regression equation for this set of data rounding all values to two decimal places Using this equation find the value of her stock to the nearest dollar 10 years after her initial purchase

Statistics
Statisticsne ff data were collected to determine the relationship between pretture the corresponding deale leadilly for the Jurpave Calibration Precure x lblaq in 10 10 10 10 10 TO 50 00 50 TO Scale reading 13 18 16 15 20 06 90 88 88 92 Question d 4 Find the Pearson Correlation Coefficient Blank 1 6 Find the equation of the regrervion line y Blank dx Blank C the purpose of Calibration in this application is to ertimate preavvie from an obverved reale reading Estimate the pressure for a ucale reading of 4 Prewure Blank 4 16 ka d Text the significance of the correlation coefficient calculated in the given question above at a 0 05 Ve the Steps in conducting Aypothesis ferts

Statistics
StatisticsWhich of the following best describes the group of voters unsure about the message tested Independent Third Party Strongly agree Agree Unsure Disagree Strongly disagree Total Republican Democrat 10 5 9 13 17 54 22 16 11 24 4 77 1 7 11 15 19 53 Total 33 28 31 52 40 184 O Its members are divided relatively evenly among all three political groups O its members primarily belong to the Democratic party O its members primarily belong to the Republican party O its members are primarily Independent Third Party voters

Statistics
StatisticsAmount of Weekly Wages At Least 38 30 36 10 But Less Than 200 00 210 00 38 10 35 00 31 90 28 90 210 00 220 00 40 40 37 10 34 00 31 00 220 00 230 00 42 70 39 30 36 10 33 10 230 00 240 00 45 10 41 60 38 30 35 20 240 00 250 00 47 80 43 90 40 60 37 30 39 30 0 John Zimmerman is a single person with 1 exemption In a week he earns 234 89 Using the chart above John s federal income tax withholding is O 41 60 Number of Withholding Exemptions Claimed 1 2 The Amount of Income Tax to be Withheld 3

Statistics
Statistics1 A cup of soup is left on a countertop to cool The table below gives the temperatures in degrees Fahrenheit of the soup recorded over a 10 minute period Time in Minutes x Temperature in F v 0 2 4 6 8 10 180 2 165 8 146 3 135 4 127 7 110 5 Write an exponential regression equation for the data rounding all values to the nearest thousandth

Statistics
Statisticsmeasure do both the female and male data sets have in common 1 Range O Mode O Median O Mean Female 3 Male

Statistics
Probabilitya What is the equation for the line of best fit b Draw the line of best fit on the following scatterplot 35 30 25 20 15 10 2 1 5 y 5 S 1 GARAGE 2 3 4 5 6 7 8 9 10 11 12 13 14 15 16 17

Statistics
ProbabilityX y 2 1044 1430 APA Use linear regression to find the equation for the linear function that best to two decimal places You y 678x 91 3 LETALONCES 3 4 5 6 1939 2456 3398 4519 DEEREAN ETT LEHET GENENAUS LOKE www

Statistics
Statisticsabout study time and exam score has data as shown on the scatter plot The least squares line was also graphed and the equation is below e 1 04 t 38 4 100 points Exam score e 90 80 70 60 50 10 20 40 30 Study Time t minutes 50 minutes 60 Q For a student who studies for 40 minutes use the equation to predict the exam score Round to the nearest whole number 80 Find the error vertical distance between the point 33 78 and the line by first finding the predicted score for a student who studies 33 minutes What is the percent difference between the estimate line and actual point values Don t enter the percent sign

Statistics
Statistics3 A population of single celled organisms was grown in a Petri dish over a period of 16 hours The number of organisms at a given time is recorded in the table below Time hrs x 0 2 4 6 8 10 12 16 Number of Organisms y 25 36 52 68 85 104 142 260 Determine the exponential regression equation model for these data rounding all values to the nearest ten thousandth Using this equation predict the number of single celled organisms to the nearest whole number at the end of the 18th hour

Statistics
Statistics5 A box containing 1 000 coins is shaken and the coins are emptied onto a table Only the coins that land heads up are returned to the box and then the process is repeated The accompanying table shows the number of trials and the number of coins returned to the box after each trial Trial Coins Returned 1 000 1 3 220 132 6 45 Write an exponential regression equation rounding the calculated values to the nearest ten thousandth Use the equation to predict how many coins would be returned to the box after the eighth trial

Statistics
StatisticsDraw a graph on graphing paper utilizing the data below Take a picture of it and upload it here Or you can simply turn in the paper Skilled Trades Jobs on the Rise Employed in industry 2017 2019 314 509 320 445 248 524 255 297 187 882 191 079 Job Title Machinists Welders Cutters Solderers and Brazers Maintenance and Repair Workers General 50 570 2017 2019 change 5 936 6 773 3 197

Statistics
Statistics1 The following data gives annual salaries in thousands of randomly chosen employees with college degrees Some of these employees have only Bachelors degrees and some have Masters PhDs At a 0 05 can we claim that the mean salaries of employees with Bachelors degrees are lower Bachelors 89 89 78 65 88 45 101 37 112 78 67 100 Masters PhDs 120 130 69 Test using a a hypothesis test b a confidence interval 68 160 68 200 78 80 88

Statistics
StatisticsVolunteers at a food bank package bags of rice The food bank finds that the actual weights of the bags follow a normal distribution with a mean weight of 2 pounds and a standard deviation of 0 25 pounds 2 points Fill in the x axis values for the normal curve for the weights of the bags From left to right the values would be values left of middle middle value values right of middle d e f g Quantify what is the probability of picking up a random bag that weighs 1 75 pounds or less Write your answer as a percentage without rounding your answer 2 points The bank distributes 2 000 bags each month How many bags out of 2 000 would you expect to weigh 2 75 pounds or more 3 points

Statistics
StatisticsThe following bar chart shows the activities to complete a project in 6 months each column represents 1 month The total project cost is 1 480 Activity ABC D E F G H I J Cost 100 200 60 80 40 150 300 100 50 400 Month Month 1 2 Month Month Month 3 4 5 Month 6 After 3 months Activities A B C E and half of F were completed for a cost of 490 What is the status of this project in terms of the schedule and budget Conduct the earned value analysis EVA variance analysis and trend analysis for this project and discuss the result of your analysis

Statistics
StatisticsCritique the following graph Give reasons as to why this graph is misleading What could have been done to make it a good graph Why would someone have made the graph this way Job Loss by Quarter Dec 07 9 MIL Sept 08 135 MIL March 09 15 MIL June 10

Statistics
Statistics7 The number of daylight hours for Iqaluit Nunavut is displayed by month January month 1 Daylight h 20 15 10 5 2 3 Daylight Hours in Iqaluit Nunavut 9 a Describe the trend 1 mark 10 11 W 12 Month Source Based on data from time and date Iqaluit Nunavut Canada Sunrise Sunset and Daylength

Statistics
StatisticsFind the value of z that would be used to test the difference between the proportions given the following Use G H Give your answer correct to two decimal places Sample G H 7 389 412 X 321 320

Statistics
Probability0 1 2 3 A survey of 125 students yields the following data for the number of classes they took in the Spring Number of classes taken Frequency of students responding 4 5 6 4 8 12 36 29 24 12 What probability that a randomly chosen student from the survey was taking at most 2 classes Write your answer as decimal rounded to three places

Statistics
Statisticsone thousand people in the population and the female life expectancy y in years are given These data are displayed in the Figure 1 scatter plot Also given is the product of the birthrate and the female life expectancy for each of the twelve countries These products written in the column labelled xy may aid in calculations Birthrate x number of births per 1000 pop 13 5 51 0 42 2 Female life expectancy y in years 27 0 18 7 45 8 15 8 51 5 30 3 35 3 23 1 50 3 Send data to calculator 71 5 53 8 64 0 71 9 74 0 58 6 75 0 61 3 63 8 66 0 74 8 62 5 xy 965 25 2743 8 2700 8 1941 3 1383 8 2683 88 1185 3156 95 1933 14 2329 8 1727 88 3143 75 Female life expectancy in years 85 Figure 1 80 65 60 55 50 1 10 15 20 25 30 25 30 35 40 45 A ist of s Birthrate number of births per 1000 pop What is the slope of the least squares regression line for these data Carry your intermediate computations to at least four decimal places and round your answer to at least two decimal places If necessary consult a list of formulas

Statistics
StatisticsFor 7 8 find the slopes of the graphs provided 8 7 4 3 2 y 1 2 3 4 x 4 31 2 1 y 10 1 2 3 4 x

Statistics
Statisticsmeans 10 0 7 5 5 0 2 5 0 0 9 5 5 IV2 X IV1 The above graph shows 4 means that are the outcome of a 2x2 design Consider an effect main effect or interaction effec be present if the appropriate difference is greater than zero Check all of the options that apply to this graph a There is a main effect of IV1 b There is not a main effect of IV1 c There is a main effect of IV2 d There is not a main effect of IV2 e There is an IV1 IV2 interaction f There is not an IV1 IV2 interaction

Statistics
ProbabilityA 2 According to the Venn Diagram above P A P B Select Select P A B P A B 1 Select Select 4 V 3 B

Statistics
Statistics9 4 y www Q Given the line and points above state the equation of the line in the fo 14 15 x

Statistics
StatisticsH Ontext A physician visit has estimated its expected reimbursement and variable cost per visit and total fixed cost roblem Using the table below calculate breakeven output given the information below and calculate net income All calculations must be demonstrated Problem Using the table below calculate breakeven output given the information below and calculate net income All calculations must be demonstrated Assumptions The original investment amount was 210 000 Operations began in Jan Numbers about patient visits delivered are 4 000 4 500 and 5 000 per month Jan Feb Mar respectively The price reimbursed per patient is 75 00 Total Fixed costs are 225 000 per month and the variable costs in average per patient is 24 00 Original Investment Reimbursement per patient or Unit Price 3 Total fixed cost per month Average variable cost per patient 10 Based on the information determine the Unadjusted Rate of Return based 11 on Average Investment 12 13 Calculate operating income at 14 Quantity of Patients 15 Total Revenue 16 Total variable cost 17 Gross Margin or Contribution Margin 18 Total fixed cost given 19 Net income 20 21 22 Reimbursement per Patient or Unit Price 23 Total fixed cost per month 24 Average variable cost 25 Breakeven output BE 26 27 28 29 30 31 Jan Feb Mar G Annualised Gross Marging Total Review Total Variable Costs Net Income Gross Margin Total Fixed Cost K Breakeven output Fixed Costs Unit Price Variable Costs L M N

Statistics
StatisticsMay 21 9 46 05 PM Watch help video Magan has a bag that contains pineapple chews cherry chews and lime chews He performs an experiment Magan randomly removes a chew from the bag records the result and returns the chew to the bag Magan performs the experiment 68 times The results are shown below A pineapple chew was selected 59 times A cherry chew was selected 3 times A lime chew was selected 6 times Based on these results express the probability that the next chew Magan removes from the bag will be cherry chew as a decimal to the nearest hundredth

Statistics
Statisticsstatistics consists of organizing and summarizing information collected while d measure the reliability of the results statistics uses methods that generalize results obtained from a sample to the population inferential descriptive qualitative
Statistics
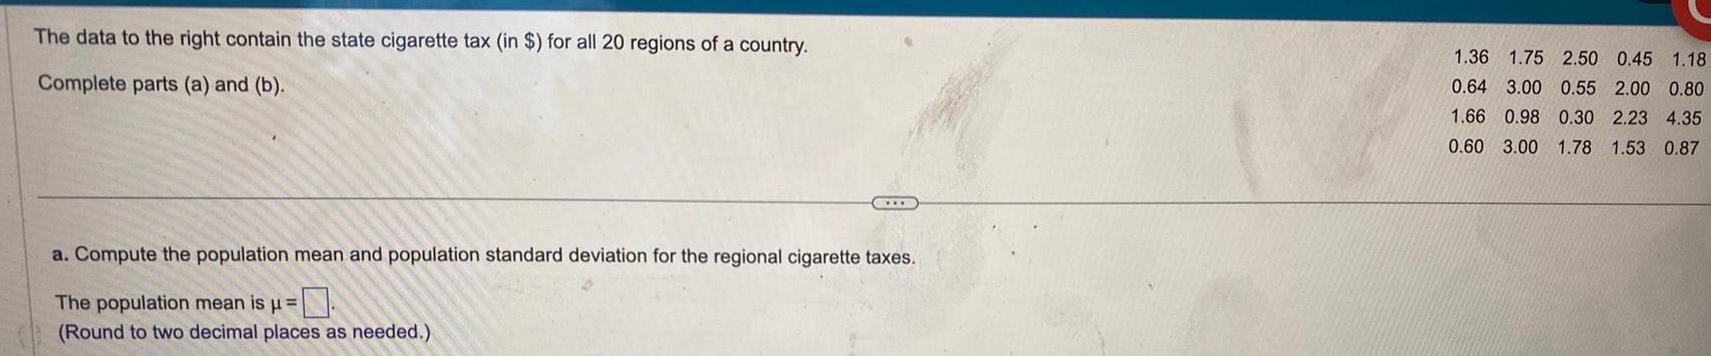
StatisticsThe data to the right contain the state cigarette tax in for all 20 regions of a country Complete parts a and b G a Compute the population mean and population standard deviation for the regional cigarette taxes The population mean is Round to two decimal places as needed 1 36 1 75 2 50 0 45 1 18 0 64 3 00 0 55 2 00 0 80 1 66 0 98 0 30 2 23 4 35 0 60 3 00 1 78 1 53 0 87
Statistics
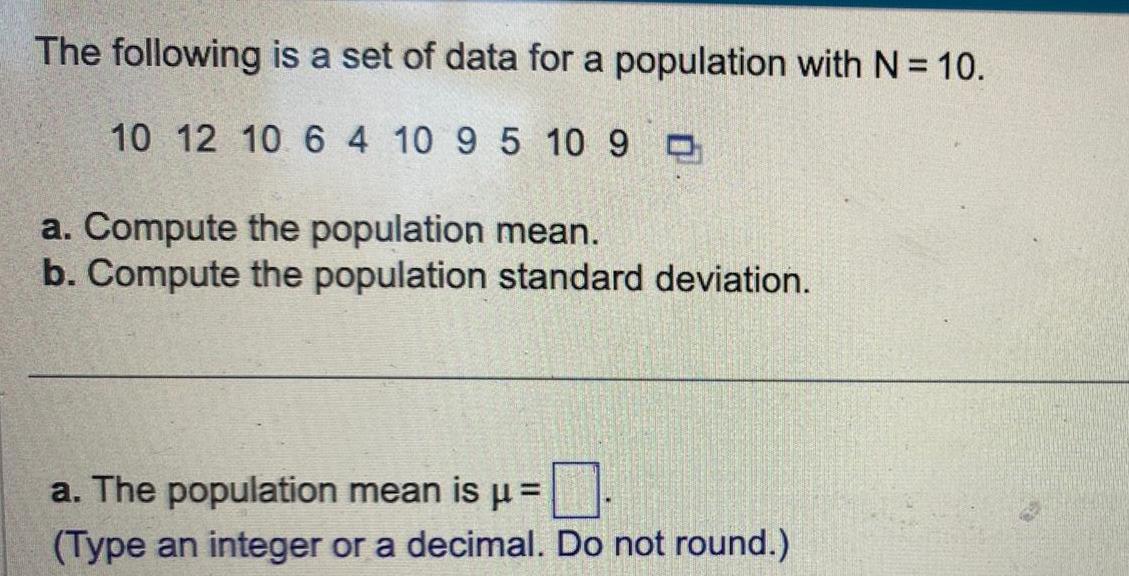
StatisticsThe following is a set of data for a population with N 10 10 12 10 6 4 10 9 5 10 9 a Compute the population mean b Compute the population standard deviation a The population mean is Type an integer or a decimal Do not round