Statistics Questions
The best high school and college tutors are just a click away, 24×7! Pick a subject, ask a question, and get a detailed, handwritten solution personalized for you in minutes. We cover Math, Physics, Chemistry & Biology.

Statistics
StatisticsA questionnaire was given to students The first question asked was How stressed have you been in the last week on a scale of 0 to 10 with 0 being not stressed at all and 10 being as stressed as possible The responses are shown in the table a Which stress rating describes the greatest number of students 7 out of 10 Type a whole number b How many students responded with this rating students Type a whole number Stress Rating 0 1 2 3 4 5 6 7 8 9 10 Frequency 6 2 1 PPPERONN 20 19 19 11 30 29 12 14 O

Statistics
StatisticsIn a science fair project Emily conducted an experiment in which she tested professional touch therapists to see if they could sense her energy field She flipped a coin to select either her right hand or her left hand and then she asked the therapists to identify the selected hand by placing their hand just under Emily s hand without seeing it and without touching it Among 350 trials the touch therapists were correct 169 times Complete parts a through d CITE a Given that Emily used a coin toss to select either her right hand or her left hand what proportion of correct responses would be expected if the touch therapists made random guesses 0 5 Type an integer or a decimal Do not round b Using Emily s sample results what is the best point estimate of the therapists success rate 0 483 Round to three decimal places as needed c Using Emily s sample results construct a 90 confidence interval estimate of the proportion of correct responses made by touch therapists 0 439 p 0 527 Round to three decimal places as needed d What do the results suggest about the ability of touch therapists to select the correct hand by sensing energy fields OA Since the confidence interval is not entirely above 0 5 there does not appear to be sufficient evidence that touch therapists can select the correct hand by sensing energy fields OB Since the upper confidence limit is above 0 5 there appears to be evidence that touch therapists can select the correct hand by sensing energy fields OC Since the confidence interval not entirely below 0 5 there appears to be evidence that touch therapists can select the correct hand by sensing energy fields OD Since the lower confidence limit is below 0 5 there does not appear to be sufficient evidence that touch therapists

Statistics
ProbabilityA food safety guideline is that the mercury in fish should be below 1 part per million ppm Listed below are the amounts of mercury ppm found in tuna sushi sampled at different stores in a major city Construct a 98 confidence interval estimate of the mean amount of mercury in the population Does it appear that there is too much mercury in tuna sushi 0 52 0 73 0 10 0 95 1 29 0 58 0 93 What is the confidence interval estimate of the population mean 0 277 ppm 1 180 ppm Round to three decimal places as needed Does it appear that there is too much mercury in tuna sushi OA Yes because it is possible that the mean is not greater than 1 ppm Also at least one of the sample values exceeds 1 ppm so at least some of the fish have too much mercury OB No because it is not possible that the mean is greater than 1 ppm Also at least one of the sample values is less than 1 ppm so at least some of the fish are safe OC No because it is possible that the mean is not greater than 1 ppm Also at least one of the sample values is less than 1 ppm so at least some of the fish are safe OD Yes because it is possible that the mean is greater than 1 ppm Also at least one of the sample values exceeds 1 ppm so at least some of the fish have too much mercury

Statistics
StatisticsHere are summary statistics for randomly selected weights of newborn girls n 36 x 3216 7 g s 688 5 g Use a confidence level of 99 to complete parts a through d below a Identify the critical value to 2 used for finding the margin of error tx 2 2 72 Round to two decimal places as needed b Find the margin of error E 312 6 g Round to one decimal place as needed c Find the confidence interval estimate of g g Round to one decimal place as needed

Statistics
StatisticsThe brand manager for a brand of toothpaste must plan a campaign designed to increase brand recognition He wants to first determine the percentage of adults who have heard of the brand How many adults must he survey in order to be 90 confident that his estimate is within six percentage points of the true population percentage Complete parts a through c below a Assume that nothing is known about the percentage of adults who have heard of the brand n 188 Round up to the nearest integer b Assume that a recent survey suggests that about 86 of adults have heard of the brand n 90 Round up to the nearest integer c Given that the required sample size is relatively small could he simply survey the adults at the nearest college O A No a sample of students at the nearest college is a cluster sample not a simple random sample so it is very possible that the results would not be representative of the population of adults OB Yes a sample of students at the nearest college is a simple random sample so the results should be representative of the population of adults OC No a sample of students at the nearest college is a stratified sample not a simple random sample so it is very possible that the results would not be representative of the population of adults OD No a sample of students at the nearest college is a convenience sample not a simple random sample so it is very possible that the results would

Statistics
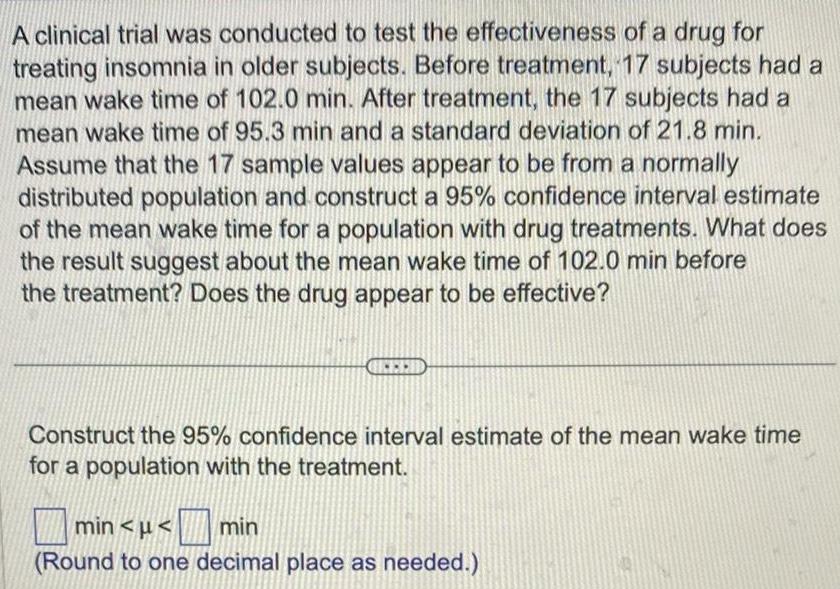
StatisticsA clinical trial was conducted to test the effectiveness of a drug for treating insomnia in older subjects Before treatment 17 subjects had a mean wake time of 102 0 min After treatment the 17 subjects had a mean wake time of 95 3 min and a standard deviation of 21 8 min Assume that the 17 sample values appear to be from a normally distributed population and construct a 95 confidence interval estimate of the mean wake time for a population with drug treatments What does the result suggest about the mean wake time of 102 0 min before the treatment Does the drug appear to be effective Construct the 95 confidence interval estimate of the mean wake time for a population with the treatment 84 1 min 106 4 min Round to one decimal place as needed What does the result suggest about the mean wake time of 102 0 min before the treatment Does the drug appear to be effective The confidence interval the mean wake time of 102 0 min before the treatment so the means before and after the treatment This result suggests that the drug treatment an effect

Statistics
ProbabilityAn IQ test is designed so that the mean is 100 and the standard deviation i 14 for the population of normal adults Find the sample size necessary to estimate the mean IQ score of statistics students such that it can be said with 99 confidence that the sample mean is within 3 IQ points of the true mean Assume that o 14 and determine the required sample size using technology Then determine if this is a reasonable sample size for a real world calculation The required sample size is 145 Round up to the nearest integer Would it be reasonable to sample this number of students O No This number of IQ test scores is a fairly large number Yes This number of IQ test scores is a fairly large number No This number of IQ test scores is a fairly small number OYes This number of IQ test scores is a fairly small number

Statistics
StatisticsIn a science fair project Emily conducted an experiment in which she tested professional touch therapists to see if they could sense her energy field She flipped a coin to select either her right hand or her left hand and then she asked the therapists to identify the selected hand by placing their hand just under Emily s hand without seeing it and without touching it Among 350 trials the touch therapists were correct 169 times Complete parts a through d a Given that Emily used a coin toss to select either her right hand or her left hand what proportion of correct responses would be expected if the touch therapists made random guesses 0 5 Type an integer or a decimal Do not round b Using Emily s sample results what is the best point estimate of the therapists success rate 0 483 Round to three decimal places as needed c Using Emily s sample results construct a 90 confidence interval estimate of the proportion of correct responses made by touch therapists p Round to three decimal places as needed


Statistics
Probability4 List the domain and the range of the graph of each function a 4 2 c 4 4 y 2 0 4 3 1 O 2 y N 4 X 4 b X 2 4 2 0 2 4 y 2 4 X


Statistics
StatisticsThe brand manager for a brand of toothpaste must plan a campaign designed to increase brand recognition He wants to first determine the percentage of adults who have heard of the brand How many adults must he survey in order to be 90 confident that his estimate is within six percentage points of the true population percentage Complete parts a through c below a Assume that nothing is known about the percentage of adults who have heard of the brand n 188 Round up to the nearest integer b Assume that a recent survey suggests that about 86 of adults have heard of the brand n Round up to the nearest integer
Statistics
ProbabilityA clinical trial was conducted to test the effectiveness of a drug for treating insomnia in older subjects Before treatment 17 subjects had a mean wake time of 102 0 min After treatment the 17 subjects had a mean wake time of 95 3 min and a standard deviation of 21 8 min Assume that the 17 sample values appear to be from a normally distributed population and construct a 95 confidence interval estimate of the mean wake time for a population with drug treatments What does the result suggest about the mean wake time of 102 0 min before the treatment Does the drug appear to be effective Construct the 95 confidence interval estimate of the mean wake time for a population with the treatment min min Round to one decimal place as needed

Statistics
StatisticsAn IQ test is designed so that the mean is 100 and the standard deviation is 14 for the population of normal adults Find the sample size necessary to estimate the mean IQ score of statistics students such that it can be said with 99 confidence that the sample mean is within 3 IQ points of the true mean Assume that o 14 and determine the required sample size using technology Then determine if this is a reasonable sample size for a real world calculation The required sample size is Round up to the nearest integer

Statistics
StatisticsHere are summary statistics for randomly selected weights of newborn girls n 36 x 3216 7 g s 688 5 g Use a confidence level of 99 to complete parts a through d below a Identify the critical value to 2 used for finding the margin of error tx 2 Round to two decimal places as needed

Statistics
StatisticsIn a science fair project Emily conducted an experiment in which she tested professional touch therapists to see if they could sense her energy field She flipped a coin to select either her right hand or her left hand and then she asked the therapists to identify the selected hand by placing their hand just under Emily s hand without seeing it and without touching it Among 350 trials the touch therapists were correct 169 times Complete parts a through d a Given that Emily used a coin toss to select either her right hand or her left hand what proportion of correct responses would be expected if the touch therapists made random guesses 0 5 Type an integer or a decimal Do not round b Using Emily s sample results what is the best point estimate of the therapists success rate Round to three decimal places as needed
Statistics
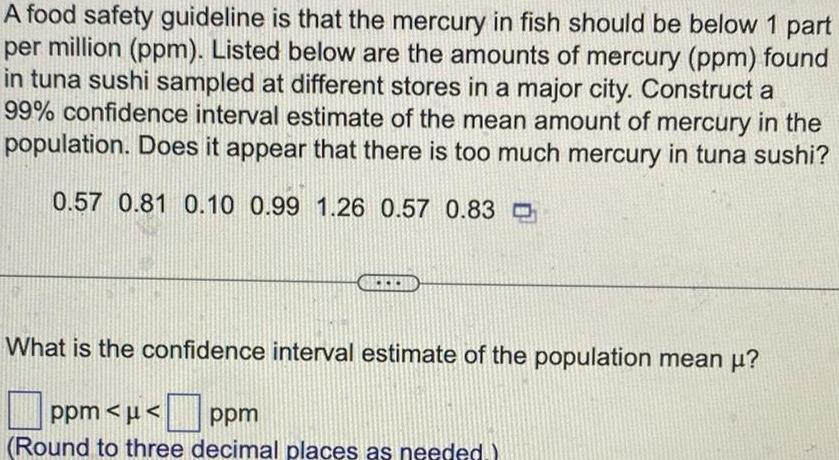
ProbabilityA food safety guideline is that the mercury in fish should be below 1 part per million ppm Listed below are the amounts of mercury ppm found in tuna sushi sampled at different stores in a major city Construct a 99 confidence interval estimate of the mean amount of mercury in the population Does it appear that there is too much mercury in tuna sushi 0 57 0 81 0 10 0 99 1 26 0 57 0 83 What is the confidence interval estimate of the population mean ppm ppm Round to three decimal places as needed

Statistics
StatisticsA magazine provided results from a poll of 1500 adults who were asked to identify their favorite pie Among the 1500 respondents 12 chose chocolate pie and the margin of error was given as 3 percentage points What values do p q n E and p represent If the confidence level is 95 what is the value of a The value of p is the sample proportion The value of q is found from evaluating 1 p The value of n is the sample size The value of E is the margin of error The value of p is the population proportion If the confidence level is 95 what is the value of a Type an integer or a decimal Do not round


Statistics
ProbabilityIn a science fair project Emily conducted an experiment in which she tested professional touch therapists to see if they could sense her energy field She flipped a coin to select either her right hand or her left hand and then she asked the therapists to identify the selected hand by placing their hand just under Emily s hand without seeing it and without touching it Among 350 trials the touch therapists were correct 169 times Complete parts a through d a Given that Emily used a coin toss to select either her right hand or her left hand what proportion of correct responses would be expected if the touch therapists made random guesses Type an integer or a decimal Do not round

Statistics
StatisticsA magazine provided results from a poll of 500 adults who were asked to identify their favorite pie Among the 500 respondents 14 chose chocolate pie and the margin of error was given as 5 percentage points Describe what is meant by the statement that the margin of error was given as 5 percentage points Choose the correct answer below A The statement indicates that the study is only 5 confident that the true population percentage of people that prefer chocolate pie is exactly 14 OB The statement indicates that the study is 100 5 95 confident that the true population percentage of people that prefer chocolate pie is 14 OC The statement indicates that the true population percentage of people that prefer chocolate pie is in the interval 14 5 OD The statement indicates that the interval 14 5 is likely to contain the true population percentage of people that

Statistics
StatisticsUse the sample data and confidence level given below to complete parts a through d A research institute poll asked respondents if they felt vulnerable to identity theft In the poll n 1053 and x 600 who said yes Use a 99 confidence level Click the icon to view a table of z scores a Find the best point estimate of the population proportion p Round to three decimal places as needed

Statistics
StatisticsA genetic experiment with peas resulted in one sample of offspring that consisted of 438 green peas and 156 yellow peas a Construct a 90 confidence interval to estimate of the percentage of yellow peas b Based on the confidence interval do the results of the experiment appear to contradict the expectation that 25 of the offspring peas would be yellow a Construct a 90 confidence interval Express the percentages in decimal form p Round to three decimal places as needed


Statistics
StatisticsWhich of the following is NOT true of the confidence level of a confidence interval Choose the correct answer below OA The confidence level gives us the success rate of the procedure used to construct the confidence interval OB The confidence level is also called the degree of confidence OC There is a 1 a chance where a is the complement of the confidence level that the true value of p will fall in the confidence interval produced from our sample OD The confidence level is often expressed as the probability or area 1 x where a is the complement of the confidence level

Statistics
StatisticsA magazine provided results from a poll of 1500 adults who were asked to identify their favorite pie Among the 1500 respondents 12 chose chocolate pie and the margin of error was given as 3 percentage points What values do p q n E and p represent If the confidence level is 95 what is the value of a The value of p is The value of q is The value of n is The value of E is The value of p is
Statistics
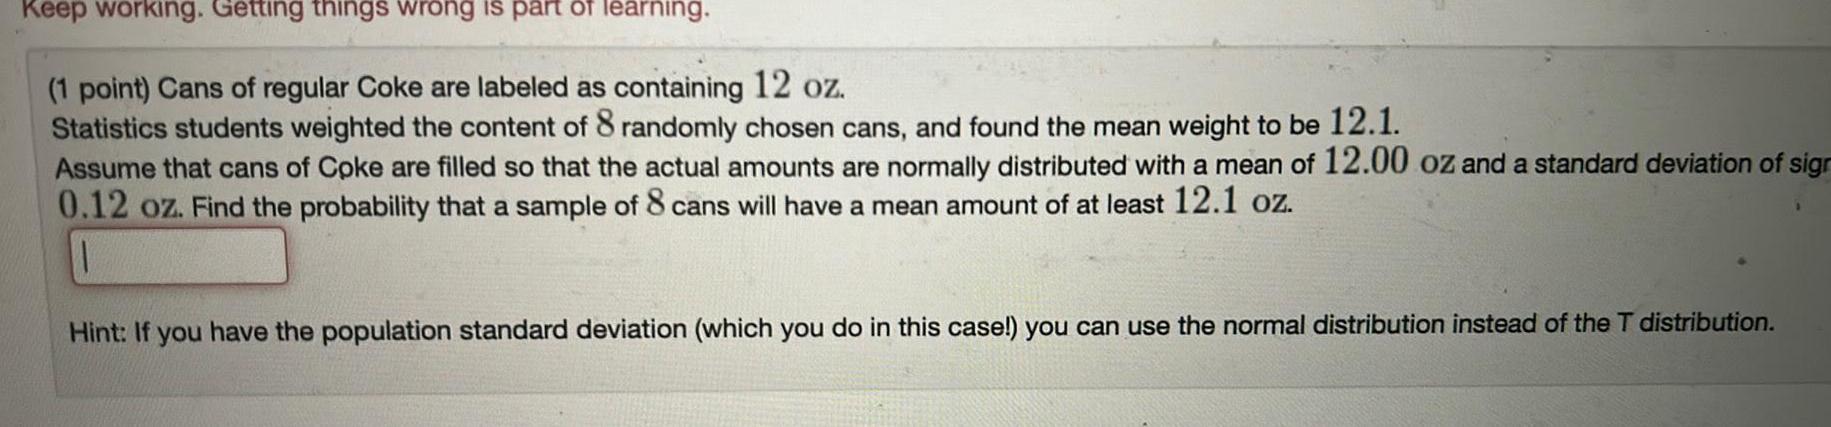
ProbabilityKeep working Getting things wrong is part of learning 1 point Cans of regular Coke are labeled as containing 12 oz Statistics students weighted the content of 8 randomly chosen cans and found the mean weight to be 12 1 Assume that cans of Coke are filled so that the actual amounts are normally distributed with a mean of 12 00 oz and a standard deviation of sign 0 12 oz Find the probability that a sample of 8 cans will have a mean amount of at least 12 1 oz Hint If you have the population standard deviation which you do in this case you can use the normal distribution instead of the T distribution


Statistics
Statistics5 Define f x 0 50 f x 0 Let X be a continuous random variable with probability density function f x Evaluate P 1 X 3 Answer for x in 0 2 for x outside of 0 2 Previous Answer 5 Return to overview

Statistics
StatisticsAssume that the duration of human pregnancies can be described by a Normal model with mean 268 days and standard deviation 17 days a What percentage of pregnancies should last between 274 and 285 days b At least how many days should the longest 30 of all pregnancies last c Suppose a certain obstetrician is currently providing prenatal care to 52 pregnant patients Let y represent the mean length of their pregnancies According to the Central Limit Theorem what is them distribution of this sample mean y Specify the model mean and standard deviation d What s the probability that the mean duration of these patients pregnancies will be less than 263 days a The percentage of pregnancies that should last between 274 and 285 days is Round to tun doni
Statistics
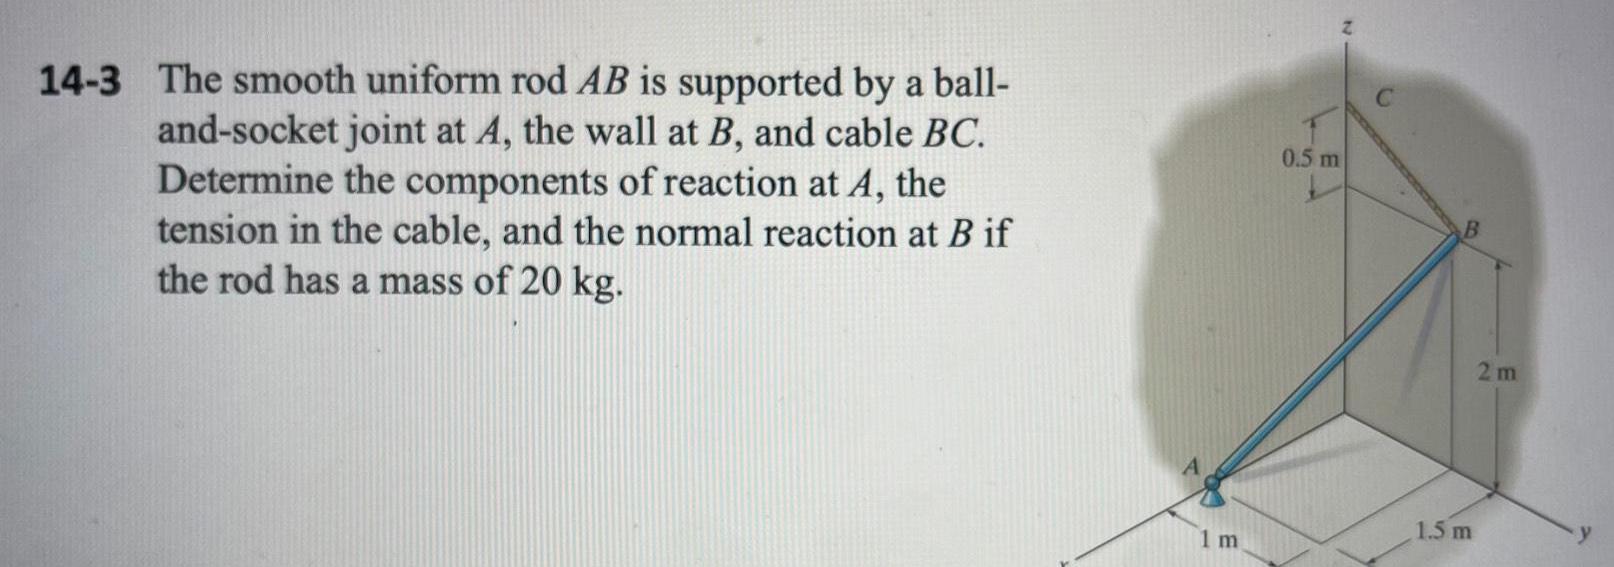
Probability14 3 The smooth uniform rod AB is supported by a ball and socket joint at A the wall at B and cable BC Determine the components of reaction at A the tension in the cable and the normal reaction at B if the rod has a mass of 20 kg 1 m 0 5 m B 1 5 m 2m y

Statistics
StatisticsRound your answer to the nearest hundredths Answer Previous Answer 0 17 H Q Search Return to overview H Chi Square Distribution Table

Statistics
StatisticsBar Chart Comparative Bar Chart Categorical Display Data Distribution Categorical Compare 2 or More Groups Display Data Distribution Compare 2 or More Groups Display Data Distribution Compare 2 Groups Display Data Distribution Can also be used to compare groups if done carefully Investigate Relationship Between 2 Numerical Variables Investigate Trend Over Time a Data Set 1 To learn about credit card debt of students at a college the financial aid office asks each student in a random sample of 75 students about their amount of credit card debt 1 How many variables are in the data set 10 Dotplot Comparative Dotplot Stem and Leaf Display Comparative Stem and Leaf Display Histogram Scatterplot Time Series Plot 1 ii Are the variables categorical or numerical O categorical numerical 1 for two or more groups 1 1 for two or more groups 1 1 for two groups 1 2 1 collected over time Numerical to compare groups O to investigate the relationship between two numerical variables Numerical Numerical Numerical Numerical Numerical Purpose Numerical iii Would the purpose of the graphical display be to display the data distribution to compare groups or to investigate the relationship between two numerical variables Oto display the data distribution
Statistics
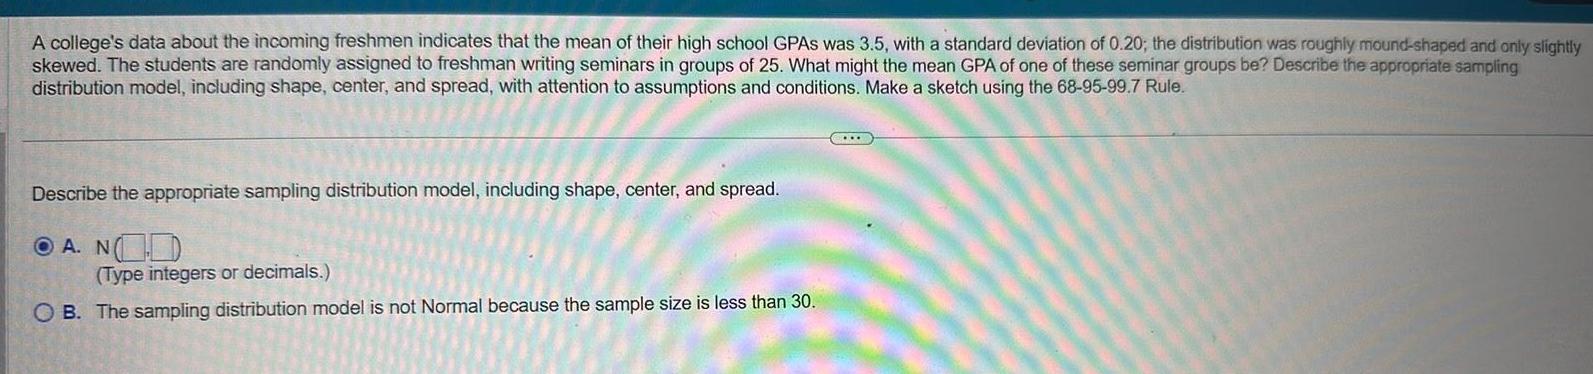
ProbabilityA college s data about the incoming freshmen indicates that the mean of their high school GPAS was 3 5 with a standard deviation of 0 20 the distribution was roughly mound shaped and only slightly skewed The students are randomly assigned to freshman writing seminars in groups of 25 What might the mean GPA of one of these seminar groups be Describe the appropriate sampling distribution model including shape center and spread with attention to assumptions and conditions Make a sketch using the 68 95 99 7 Rule Describe the appropriate sampling distribution model including shape center and spread A N Type integers or decimals OB The sampling distribution model is not Normal because the sample size is less than 30 GULD

Statistics
StatisticsResearchers measured the Waist Sizes of 977 men in a study on body fat The true mean and standard deviation of the Waist Sizes for the 977 men are 36 33 inches and 3 91 inches respectively Histograms of simulations that drew many samples of sizes 2 5 10 and 20 with replacement are displayed in the accompanying table The summary statistics for these simulations are shown to the right Complete parts a through d Click the icon to view the original histogram and histograms for the sampling distributions C25120 n Theoretical mean Round to two decimal places as needed n 2 5 10 20 mean 36 45 a According to the Central Limit Theorem what should the theoretical mean be for each of these sample sizes According to the Central Limit Theorem what should the theoretical standard deviation be for each of these sample sizes 36 34 36 31 36 33 st dev 2 76 1 77 1 23 0 86
Statistics
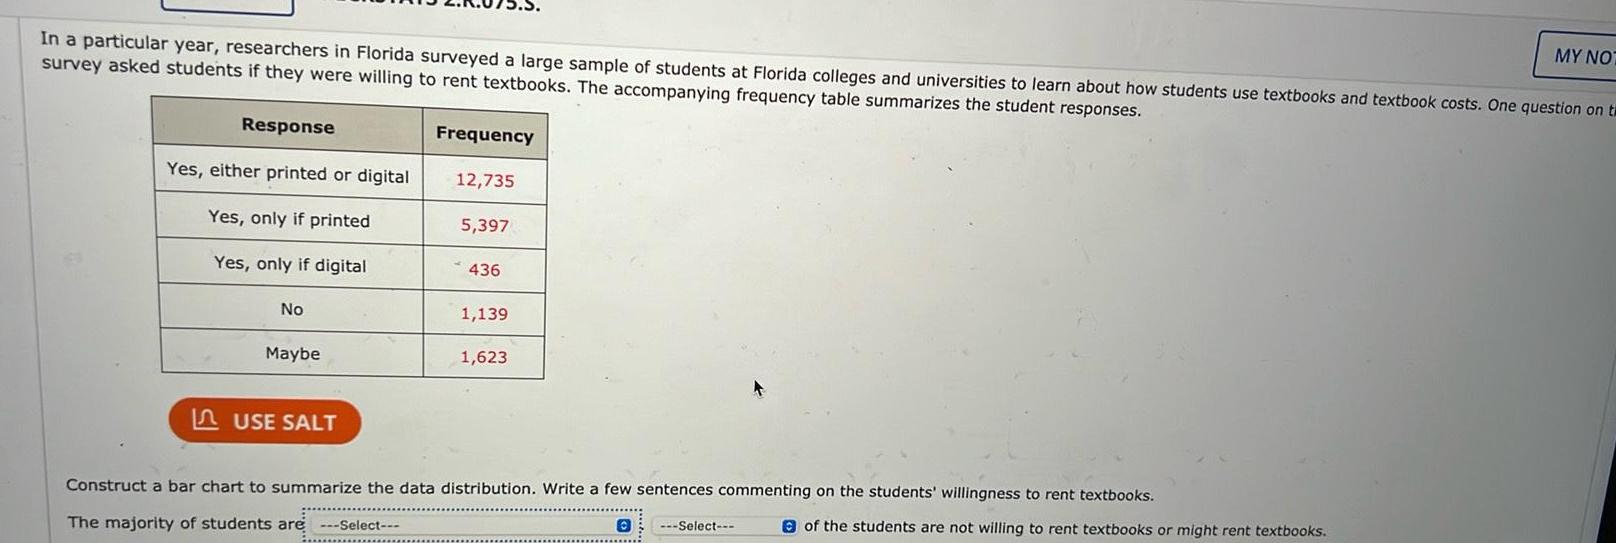
ProbabilityIn a particular year researchers in Florida surveyed a large sample of students at Florida colleges and universities to learn about how students use textbooks and textbook costs One question on t survey asked students if they were willing to rent textbooks The accompanying frequency table summarizes the student responses Response Yes either printed or digital Yes only if printed Yes only if digital No Maybe USE SALT Frequency 12 735 5 397 436 1 139 1 623 Construct a bar chart to summarize the data distribution Write a few sentences commenting on the students willingness to rent textbooks The majority of students are Select 0 Select of the students are not willing to rent textbooks or might rent textbooks MY NOT
Statistics
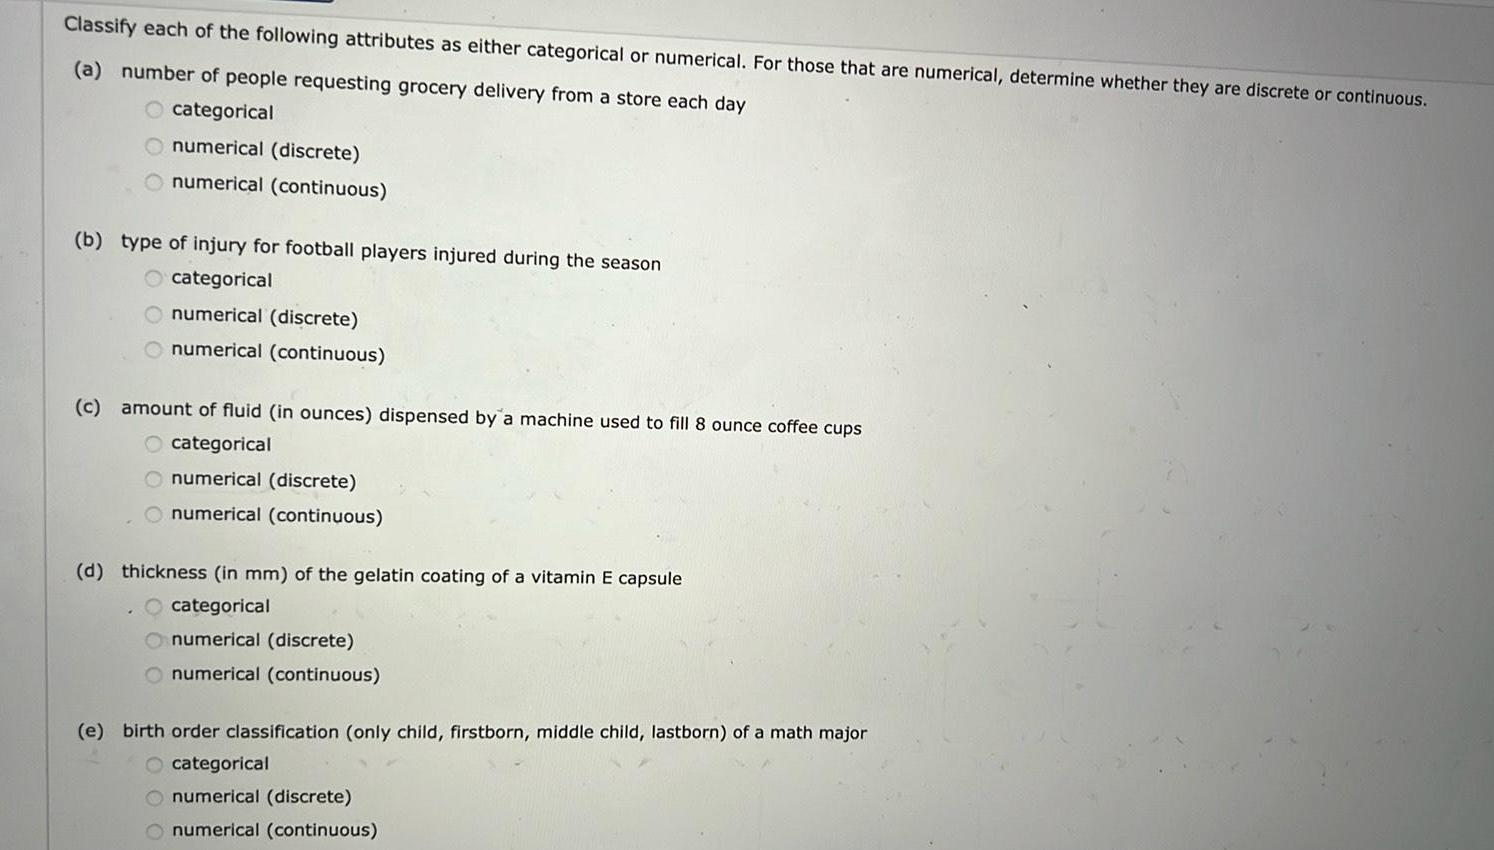
ProbabilityClassify each of the following attributes as either categorical or numerical For those that are numerical determine whether they are discrete or continuous a number of people requesting grocery delivery from a store each day O categorical numerical discrete numerical continuous b type of injury for football players injured during the season categorical O numerical discrete numerical continuous c amount of fluid in ounces dispensed by a machine used to fill 8 ounce coffee cups O categorical numerical discrete numerical continuous d thickness in mm of the gelatin coating of a vitamin E capsule categorical numerical discrete numerical continuous e birth order classification only child firstborn middle child lastborn of a math major O categorical O numerical discrete O numerical continuous

Statistics
StatisticsIn a survey of 100 people who had recently purchased motorcycles data on the following variables were recorded gender of purchaser brand of motorcycle purchased number of previous motorcycles owned by purchaser telephone area code of purchaser weight of motorcycle as equipped at purchase a Which of these variables are categorical Select all that apply gender of purchaser brand of motorcycle purchased number of previous motorcycles owned by purchaser telephone area code of purchaser Dweight of motorcycle as equipped at purchase b Which of these variables are discrete numerical Select all that apply gender of purchaser brand of motorcycle purchas number of previous motorcycles owned by purchaser telephone area code of purchaser weight of motorcycle as equipped at purchase c Which type of graphical display would be an appropriate choice for displaying the distribution of gender a bar chart or a dotplot bar chart Odotplot d Which type of graphical display would be an appropriate choice for displaying the distribution of weight a bar chart or a dotplot bar chart

Statistics
StatisticsFor each of the following determine whether the statistical study described is an observational study or an experiment Give a brief explanation of your choice a Can choosing the right music make wine taste better This question was investigated by a researcher at a university in Edinburgh t Each of 250 volunteers was assigned at random to one of five rooms where they were asked to taste and rate a glass of wine No music was playing in one of the rooms and a different style of music was playing in each of the other four rooms The researcher concluded that cabernet sauvignon is rated more highly when bold music is played than when no music is played This is an observational study because there was no random assignment of subjects to experimental conditions This is an observational study due to the random assignment of subjects to experimental conditions This is an experiment because there was no random assignment of subjects to experimental conditions This is an experiment due to the random assignment of subjects to experimental conditions b The article Sugar Sweetened Beverage Intake in Adulthood and Adolescence and Risk of Early Onset Colorectal Cancer among Women t analyzed data from 95 464 female registered nurses who participated in a prospective health study over a 25 year period As part of the study the nurses reported their consumption of sugar sweetened beverages using food frequency questionnaires every four years The study found that nurses who consumed more than two servings of sugar sweetened beverages had more than twice the risk of colon cancer compared to those who consumed less than one sugar sweetened beverage per week This is an observational study because there was no random assignment of subjects to experimental conditions This is an observational study due to the random assignment of subjects to experimental conditions This is an experiment because there was no random assignment of subjects to experimental conditions This is an experiment due to the random assignment of subjects to experimental conditions c USA TODAY reported that in a study of affluent Americans defined as those with incomes of 75 000 or more per year 57 indicated that they would rather have more time money This is an observational study because there was no random assignment of subjects to experimental conditions This is an observational study due to the random assignment of subjects to experimental conditions O This is an experiment because there was no random assignment of subjects to experimental conditions This is an experiment due to the random assignment of subjects to experimental conditions more d The article Acupuncture for Bad Backs Even Sham Therapy Works summarized a study conducted by researchers at the Group Health Center for Health Studies in Seattle In this study 638 adults with back pain were randomly assigned to one of four groups People in group 1 received the usual care for back pain People in group 2 received acupuncture at a set of points tailored specifically for each individual People in group 3 received acupuncture at a standard set of points typically used in the treatment of back pain Those in group 4 received fake acupuncture they were poked with a toothpick at the same set of points used for the people in group 3 Two notable conclusions from the study were 1 patients receiving real or fake acupuncture experienced a greater reduction in pain than those receiving usual care and 2 there was no significant difference in pain reduction for those who received real acupuncture groups 2 and 3 and those who received fake acupuncture toothpick pokes This is an observational study because there was no random assignment of subjects to experimental conditions This is an observational study due to the random assignment of subjects to experimental conditions of subjects to experimental conditions

Statistics
StatisticsThe paper From Dr Kildare to Grey s Anatomy describes several studies of how the way in which doctors are portrayed on television might influence public perception of doctors One study was described as follows Rebecca Chory Ph D now an associate professor of communication at West Virginia University began studying the effect of such portrayals on patients attitudes toward physicians Using a survey of 300 undergraduate students she compared perceptions of physicians in 1992 the end of the era when physicians were shown as all knowing wise father figures with those in 1999 when shows such as ER and Chicago Hope 1994 2000 were continuing the transformation to showing the private side and lives of physicians including vivid demonstrations of their weaknesses and insecurities i What is the population of interest OTV doctors Dr Chory found that regardless of the respondents personal experience with physicians those who watched certain kinds of television had declining perceptions of physicians composure and regard for others Her results indicated that the more prime time physician shows that people watched in which physicians were the main characters the more uncaring cold and unfriendly the respondents thought physicians were a Answer the following four questions for the observational study described in this exercise Hint Reviewing Examples 1 4 and 1 5 might be helpful Opatients that saw doctors after 1999 all patients Ban patients that saw doctors before 1992 Oreal life doctors G stra ii Was the sample selected in a reasonable way Yes the sample is large enough to be reasonable Yes the report explains the randomization scheme O No the report indicates no randomization O No the sample size is too small Yes the sample included undergraduate students iii Is the sample likely to be representative of the population of interest O No the population of interest is all patients but only undergraduate students were surveyed Yes 300 students is a large enough sample to represent the whole population O No the population of interest is TV doctors but only undergraduate students were surveyed Yes undergraduate students were surveyed and they are representative of all patients No the population of interest is real life doctors but only undergraduate students were surveyed

Statistics
StatisticsResearchers in Lebanon conducted a study to identify personality characteristics that can be used to predict addiction to the internet and social media t a The study was carried out at a private university in Lebanon To select the sample the student population was ordered by student identification numbers and every 5th student from the list was invited to participate Would this sample be a simple random sample a systematic sample a stratified sample or a cluster sample Osimple random sample O systematic sample stratified sample cluster sample b Based on the sampling method described in part a is it reasonable to assume that this sample is representative of all students at this university in Lebanon Yes because the sample was randomly selected No because the sample was not randomly selected c Based on the sampling method described in part a is it reasonable to assume that this sample is representative of all internet users and social media users OYes because the sample was randomly selected No because the sample was selected from only students at this university in Lebanon No because the sample was not randomly selected Yes because the sample was selected from internet users and social media users MY NOTES d Some students who were selected for the sample chose not to participate in the study In total 586 participants completed the survey for an overall response rate of 41 86 Are you concerned about nonresponse bias in this study Or does the large sample size eliminate these concerns Nonresponse blas is not a concern because the sample size of 586 is fairly large so the sample should still be representative of the population The response rate of 41 86 is not low enough to be concerned apout nonresponse bias There is concern about nonresponse bias because there could be something systematically different about those participants who chose to respond

Statistics
StatisticsTo examine the relationship between noise exposure and heart disease a study compared a group of people with hearing loss to a group of people without hearing loss The researchers found the percentage of people in the hearing loss group who had heart disease was higher than the percentage for the group that did not have hearing loss This association was particularly strong f workers exposed to loud occupational noise a Is this study an experiment If so what is the explanatory variable and what is the response variable If not explain why it is not an experiment Yes it was an experiment The explanatory variable is heart disease and the response variable is hearing loss OYes it was an experiment The explanatory variable is noise exposure and the response variable is hearing loss Yes it was an experiment The explanatory variable is noise exposure and the response variable is heart disease O No the study is not an experiment because there were no experimental conditions to which study participants were randomly assigned b From this study alone is it reasonable to conclude that noise exposure is the cause of the observed difference in heart disease risk Justify your answer Yes since the effect was stronger for workers exposed to loud occupational noise we may conclude that it has an effect on heart disease Yes since this was an experiment it is reasonable to conclude that noise exposure has an effect on heart disease O No since this was an observational study cause and effect conclusions cannot be drawn No the study does not include people who did not have heart disease and therefore a conclusion cannot be drawn MY
Statistics
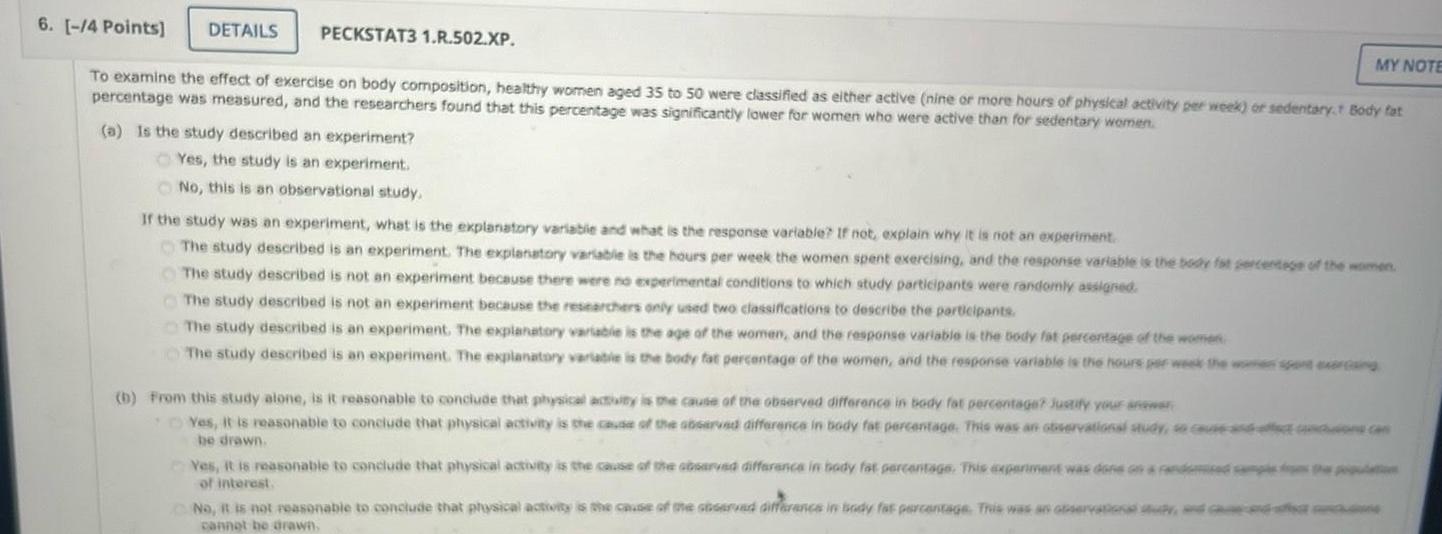
Probability6 4 Points DETAILS PECKSTAT3 1 R 502 XP To examine the effect of exercise on body composition healthy women aged 35 to 50 were classified as either active nine or more hours of physical activity per week or sedentary Body fat percentage was measured and the researchers found that this percentage was significantly lower for women who were active than for sedentary women a Is the study described an experiment Yes the study is an experiment No this is an observational study If the study was an experiment what is the explanatory variable and what is the response variable If not explain why it is not an experiment The study described is an experiment The explanatory variable is the hours per week the women spent exercising and the response variable is the body fat percentage of the women The study described is not an experiment because there were no experimental conditions to which study participants were randomly assigned MY NOTE The study described is not an experiment because the researchers only used two classifications to describe the participants The study described is an experiment The explanatory variable is the age of the women and the response variable is the body fat percentage of the women The study described is an experiment The explanatory variable is the body fat percentage of the women and the response variable is the hours per week the women spent exig b From this study alone is it reasonable to conclude that physical activity is the cause of the observed difference in body fat percentage Justify your answer Yes it is reasonable to conclude that physical activity is the cause of the observed difference in body fat percentage This was an observational study so cause and effect be drawn Yes it is reasonable to conclude that physical activity is the cause of the observed difference in body fat percentage This experiment was done on a randomized camps of interest No it is not reasonable to conclude that physical activity is the cause of the observed difference in body fat percentage This was an observational study and c cannot be drawn one can the population

Statistics
StatisticsAn article called The Placebo Effect Works and You Can Catch It From Your Doctor describes a study to investigate whether patients can pick up subtle facial cues that reveal their doctor s beliefs about the effectiveness of a treatment The article included this study description Researchers randomly assigned undergraduate students to play the role of a patient or a doctor The patients were given a controlled heat stimulus to the forearm after receiving one of two types of cream from the doctor Students in the doctor group had previously been conditioned to believe that one of the creams was pain reliever But in reality both of the two creams that they administered were an identical petroleum jelly based placebo And yet when the doctor actors believed that the cream was a real medication the patient actors reported experiencing significantly lower amounts of pain a The article also includes the statement Avoiding these placebo effects is one reason for double blind studies Explain what the term double blind means Double blind refers to only the researchers not knowing which treatment a participant received or personal information about the participant Double blind refers to only the study participants not knowing which treatment they received or what the purpose of the experiment is before it is conducted O Double blind refers to researchers using anonymous third parties to measure the response Only those measuring the response do not know which treatment was received O Double blind refers to neither the study participants nor those measuring the response or providing the treatment knowing what treatment was received Discuss the purpose of blinding in an experiment O The purpose of blinding is to prevent unfair treatment that may occur when the person taking the measurements knows the study participant The purpose of blinding is to ensure that the experiment does not favor one experimental condition over another MY NOTES O The purpose of blinding is to eliminate as many sources of variability as possible The purpose of blinding is to not let personal beliefs influence the measurements deliberately or inadvertently b Given how these data were collected do you think it is reasonable to conclude that the doctors belief about the effectiveness of the pain reliever is what caused the observed differences in patient reported pain O It may be reasonable It is not reasonable c Given how these data were collected do you think it is reasonable to generalize the results of this study to all doctors and patients It is not reasonable because it is unethical to induce pain severe enough to test the placebo effect It is reasonable because the only difference in the treatments was the conditioning of the doctor actors It is not reasonable because there was no random selection from the population of doctors and patients It is reasonable because the students were randomly assigned the doctor and patient roles
Statistics
ProbabilityMY NO A news release from Intel titled Intel s Security International Internet of Things Smart Home Survey Shows Many Respondents Sharing Personal Data for Money t described a survey conducted in 2015 The news release states A total of 9 000 consumers were interviewed globally including 2 500 from the United States 1 000 from the United Kingdom 1 000 from France 1 000 from Germany 1 000 from Brazil 1 000 from India 500 from Canada 500 from Mexico and 500 from Australia Among the findings from the survey were that 54 of the respondents worldwide woul willing to share personal data collected from devices in their homes with companies in exchange for money Indicate whether the study is an observational study or an experiment Give a brief explanation for your choice This is an observational study based on results of a survey No consumers were assigned to different experimental conditions This is an observational study based on a review of people s smart devices No consumers were assigned to different experimental conditions