Statistics Questions
The best high school and college tutors are just a click away, 24×7! Pick a subject, ask a question, and get a detailed, handwritten solution personalized for you in minutes. We cover Math, Physics, Chemistry & Biology.
Statistics
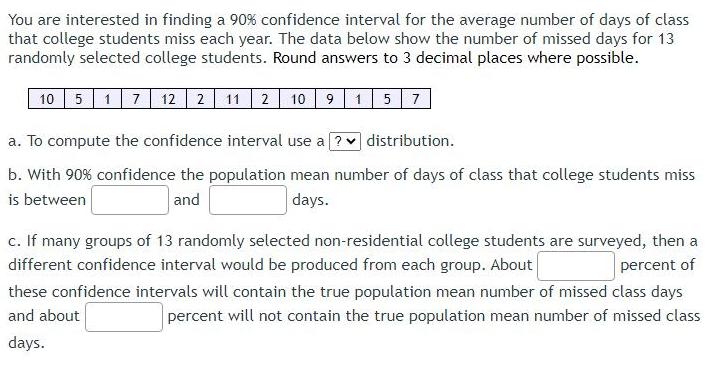
ProbabilityYou are interested in finding a 90 confidence interval for the average number of days of class that college students miss each year The data below show the number of missed days for 13 randomly selected college students Round answers to 3 decimal places where possible 10 5 17 12 2 11 2 10 9 15 7 a To compute the confidence interval use a distribution b With 90 confidence the population mean number of days of class that college students miss is between and days c If many groups of 13 randomly selected non residential college students are surveyed then a different confidence interval would be produced from each group About percent of these confidence intervals will contain the true population mean number of missed class days and about percent will not contain the true population mean number of missed class days
Statistics
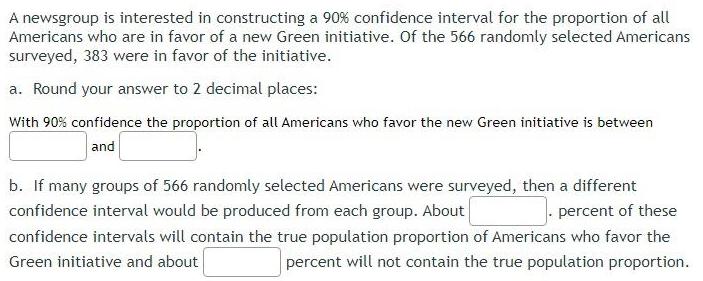
ProbabilityA newsgroup is interested in constructing a 90 confidence interval for the proportion of all Americans who are in favor of a new Green initiative Of the 566 randomly selected Americans surveyed 383 were in favor of the initiative a Round your answer to 2 decimal places With 90 confidence the proportion of all Americans who favor the new Green initiative is between and b If many groups of 566 randomly selected Americans were surveyed then a different confidence interval would be produced from each group About percent of these confidence intervals will contain the true population proportion of Americans who favor the Green initiative and about percent will not contain the true population proportion
Statistics
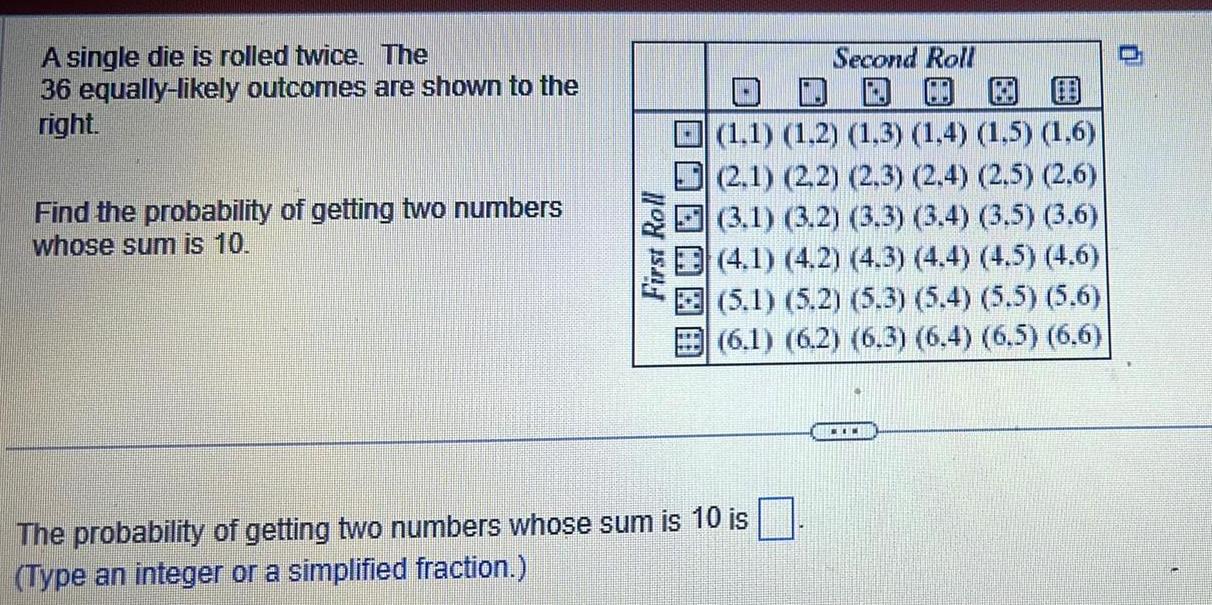
ProbabilityA single die is rolled twice The 36 equally likely outcomes are shown to the right Find the probability of getting two numbers whose sum is 10 First Roll DAAAAA Second Roll DDO 1 1 1 2 1 3 1 4 1 5 1 6 2 1 2 2 2 3 2 4 2 5 2 6 3 1 3 2 3 3 3 4 3 5 3 6 4 1 4 2 4 3 4 4 4 5 4 6 5 1 5 2 5 3 5 4 5 5 5 6 6 1 6 2 6 3 6 4 6 5 6 6 The probability of getting two numbers whose sum is 10 is Type an integer or a simplified fraction I

Statistics
StatisticsFor a confidence level of 99 find the critical value Round your answer to 2 decimal places

Statistics
StatisticsVOTE VOTE VOTE Out of 100 people sampled 39 preferred Candidate A Based on this estimate what proportion as a decimal of the voting population p prefers Candidate A p Compute a 99 confidence level and give your answers to 3 decimal places

Statistics
StatisticsIn the following inductive generalization identify the sample group and the population group 95 of the 5 times I ve submitted a paper to a journal it gets rejected within two weeks Therefore 95 of the papers I ever submit will get rejected within two weeks Sample group papers that get rejected within 2 weeks Population group 95 of the papers I ever submit Sample group 95 of the time I ve submitted a paper Population group 95 of the papers I ever submit Sample group 95 of the papers I ever submit Population group papers that get rejected Sample group 95 of the papers I ever submit Population group 95 of the papers I have submitted in the past
Statistics
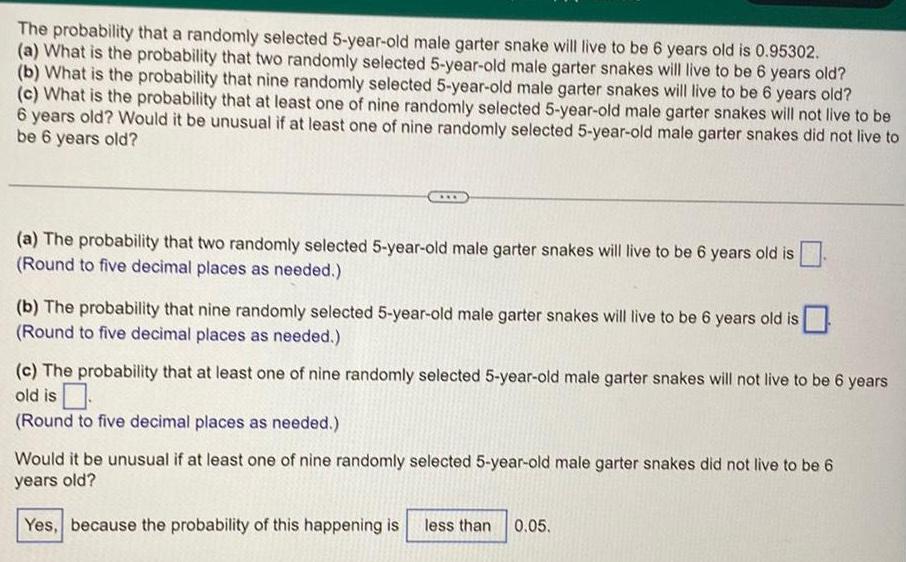
ProbabilityThe probability that a randomly selected 5 year old male garter snake will live to be 6 years old is 0 95302 a What is the probability that two randomly selected 5 year old male garter snakes will live to be 6 years old b What is the probability that nine randomly selected 5 year old male garter snakes will live to be 6 years old c What is the probability that at least one of nine randomly selected 5 year old male garter snakes will not live to be 6 years old Would it be unusual if at least one of nine randomly selected 5 year old male garter snakes did not live to be 6 years old a The probability that two randomly selected 5 year old male garter snakes will live to be 6 years old is Round to five decimal places as needed b The probability that nine randomly selected 5 year old male garter snakes will live to be 6 years old is Round to five decimal places as needed c The probability that at least one of nine randomly selected 5 year old male garter snakes will not live to be 6 years old is Round to five decimal places as needed Would it be unusual if at least one of nine randomly selected 5 year old male garter snakes did not live to be 6 years old Yes because the probability of this happening is less than 0 05

Statistics
StatisticsThe readings from the 20 diabetic patients are given here 203 1 184 5 206 8 211 0 218 3 174 2 193 2 201 9 199 9 194 3 199 4 193 6 194 6 187 2 197 8 184 3 196 1 196 4 197 5 187 9 The manufacturer claims that the diabetic patients should have a standard deviation of 5 mg dL Use these data sample standard deviation is 9 908 mg dL to determine whether there is sufficient evidence that the variability in readings from the diabetic patients is higher than the manufacturer s claim A 95 confidence interval for o is 56 78 Calculate the upper bound for this confidence interval Use 2 decimal places Use the following app to find the critical HO
Statistics
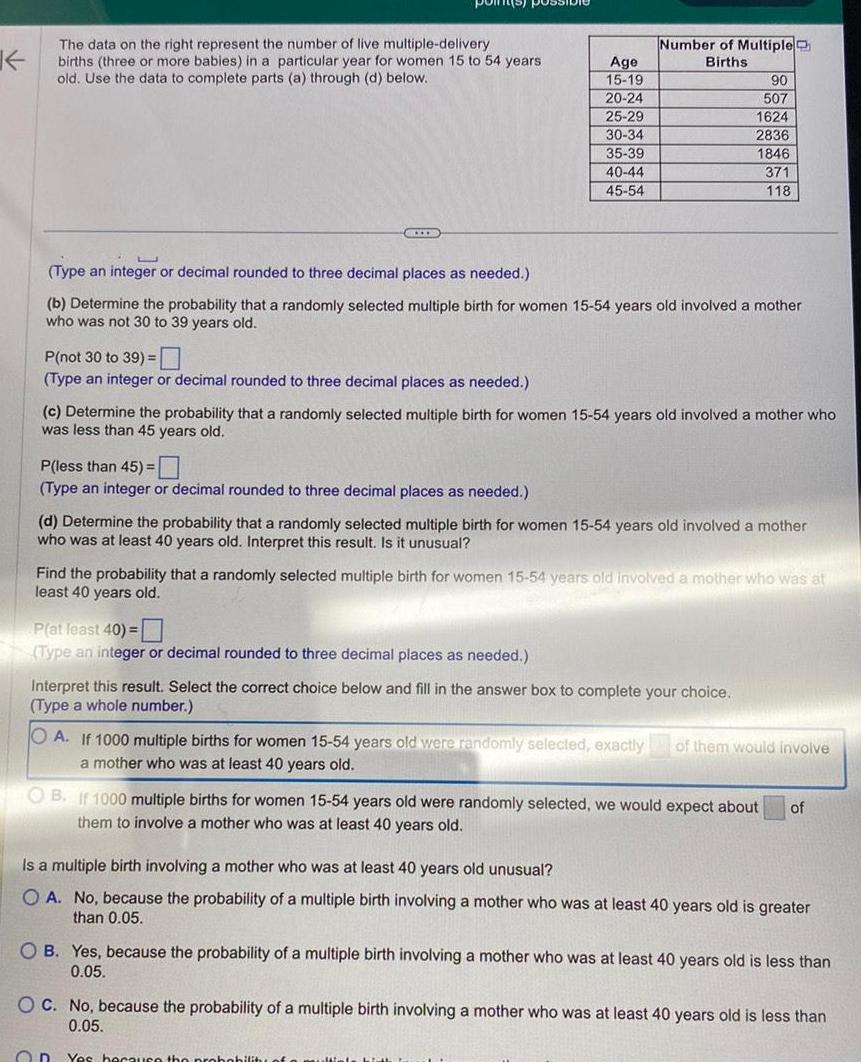
ProbabilityK The data on the right represent the number of live multiple delivery births three or more babies in a particular year for women 15 to 54 years old Use the data to complete parts a through d below HIIB P not 30 to 39 Type an integer or decimal rounded to three decimal places as needed P less than 45 Type an integer or decimal rounded to three decimal places as needed Age 15 19 20 24 25 29 30 34 35 39 40 44 45 54 Type an integer or decimal rounded to three decimal places as needed b Determine the probability that a randomly selected multiple birth for women 15 54 years old involved a mother who was not 30 to 39 years old Number of Multiple Births c Determine the probability that a randomly selected multiple birth for women 15 54 years old involved a mother who was less than 45 years old P at least 40 Type an integer or decimal rounded to three decimal places as needed 90 507 1624 2836 1846 371 118 d Determine the probability that a randomly selected multiple birth for women 15 54 years old involved a mother who was at least 40 years old Interpret this result Is it unusual Find the probability that a randomly selected multiple birth for women 15 54 years old involved a mother who was at least 40 years old Interpret this result Select the correct choice below and fill in the answer box to complete your choice Type a whole number On OA If 1000 multiple births for women 15 54 years old were randomly selected exactly of them would involve a mother who was at least 40 years old OB If 1000 multiple births for women 15 54 years old were randomly selected we would expect about of them to involve a mother who was at least 40 years old Is a multiple birth involving a mother who was at least 40 years old unusual OA No because the probability of a multiple birth involving a mother who was at least 40 years old is greater than 0 05 OB Yes because the probability of a multiple birth involving a mother who was at least 40 years old is less than 0 05 OC No because the probability of a multiple birth involving a mother who was at least 40 years old is less than 0 05 Yes because the probability of a multipl
Statistics
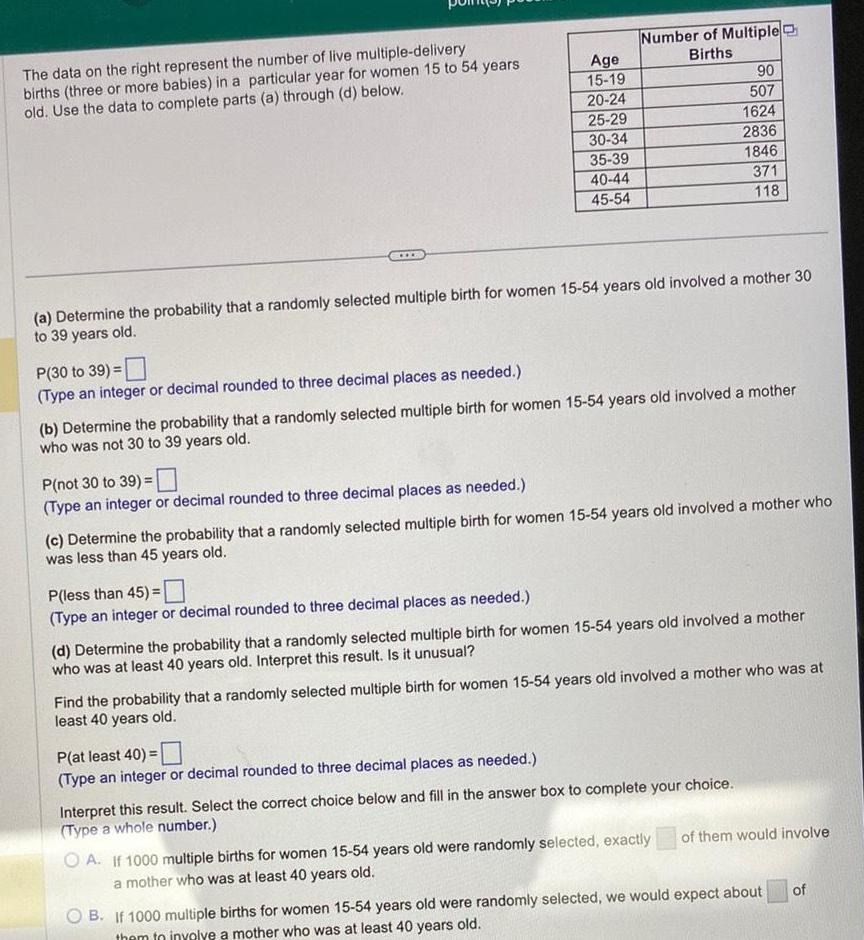
ProbabilityThe data on the right represent the number of live multiple delivery births three or more babies in a particular year for women 15 to 54 years old Use the data to complete parts a through d below P 30 to 39 Type an integer or decimal rounded to three decimal places as needed P not 30 to 39 Type an integer or decimal rounded to three decimal places as needed Age 15 19 20 24 25 29 30 34 a Determine the probability that a randomly selected multiple birth for women 15 54 years old involved a mother 30 to 39 years old P less than 45 Type an integer or decimal rounded to three decimal places as needed 35 39 40 44 45 54 Number of Multiple Births b Determine the probability that a randomly selected multiple birth for women 15 54 years old involved a mother who was not 30 to 39 years old P at least 40 Type an integer or decimal rounded to three decimal places as needed c Determine the probability that a randomly selected multiple birth for women 15 54 years old involved a mother who was less than 45 years old 90 507 1624 2836 1846 371 118 d Determine the probability that a randomly selected multiple birth for women 15 54 years old involved a mother who was at least 40 years old Interpret this result Is it unusual Find the probability that a randomly selected multiple birth for women 15 54 years old involved a mother who was at least 40 years old Interpret this result Select the correct choice below and fill in the answer box to complete your choice Type a whole number OA If 1000 multiple births for women 15 54 years old were randomly selected exactly a mother who was at least 40 years old of them would involve B If 1000 multiple births for women 15 54 years old were randomly selected we would expect about them to involve a mother who was at least 40 years old of
Statistics
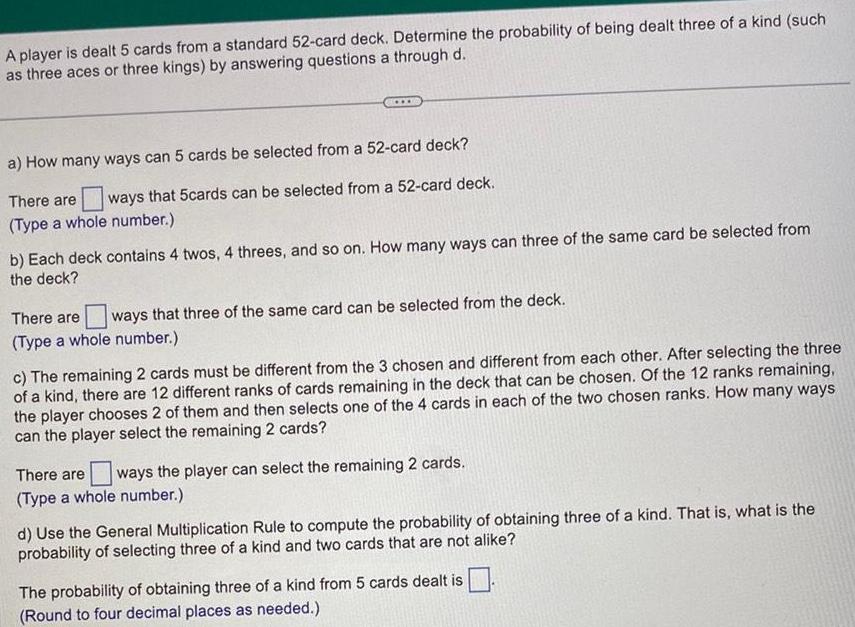
ProbabilityA player is dealt 5 cards from a standard 52 card deck Determine the probability of being dealt three of a kind such as three aces or three kings by answering questions a through d a How many ways can 5 cards be selected from a 52 card deck There are ways that 5cards can be selected from a 52 card deck Type a whole number b Each deck contains 4 twos 4 threes and so on How many ways can three of the same card be selected from the deck There are ways that three of the same card can be selected from the deck Type a whole number c The remaining 2 cards must be different from the 3 chosen and different from each other After selecting the three of a kind there are 12 different ranks of cards remaining in the deck that can be chosen Of the 12 ranks remaining the player chooses 2 of them and then selects one of the 4 cards in each of the two chosen ranks How many ways can the player select the remaining 2 cards There are ways the player can select the remaining 2 cards Type a whole number d Use the General Multiplication Rule to compute the probability of obtaining three of a kind That is what is the probability of selecting three of a kind and two cards that are not alike The probability of obtaining three of a kind from 5 cards dealt is Round to four decimal places as needed

Statistics
StatisticsA psychologist was interested in exploring whether or not male and female college students have different driving behaviors The particular statistical question she framed was as follows Is the mean fastest speed driven by male college students different than the mean fastest speed driven by female college students The psychologist conducted a survey of a random male college students and a random female college students Here is a descriptive summary of the results of her survey Males X n 34 x 105 5 Sx 20 1 Females Y m 29 Y 90 9 Sy 12 2 Is there sufficient evidence that the variance of the fastest speed driven by male college students differs from the variance of the fastest speed driven by female college students What is the appropriate probability distribution in

Statistics
StatisticsTwo college instructors are interested in whether or not there is any variation in the way they grade math exams They each grade the same set of 30 exams The first instructor s grades have a variance of 52 3 The second instructor s grades have a variance of 89 9 Test the claim that the first instructor s variance is smaller In most colleges it is desirable for the variances of exam grades to be nearly the same among instructors Calculate the test statistic Use 3 decimal places

Statistics
Statisticse table below gives the number of ementary school children in 16 school stricts in a particular region Construct a cumulative frequency stribution Construct a cumulative relative frequency stribution Draw a frequency polygon H Draw a relative frequency ogive Number of Elementary School Students in 16 School Districts 2500 1317 2400 1300 3110 2564 1260 4800 2473 1050 1897 3640 2817 1116 2137 4400 a Complete the cumulative frequency distribution Students in a District 1000 1999 2000 2999 3000 3999 4000 4999 b Complete the cumulative relative frequency distribution Students in a District O A 1000 1999 2000 2999 3000 3999 4000 4999 Round to three decimal places as needed c Which of these is the frequency polygon Frequency 0 0 O C Frequency Cumulative Frequency 0 OC Cumulative Relative Frequency Students 6000 Students Q 0 6000 5999 Q OB Q Frequency 0 O D THO Students d Which of these is the relative frequency ogive O A ik 999 Students O D Freq 6000 Students OB in 04 999 FTT 6000 5999 Students S Q

Statistics
StatisticsThe following data represent the number of grams of fat in breakfast meals offered at a local fast food restaurant a Construct a stem and leaf plot and b describe the shape of the distribution 1 2 3 19 17 39 25 4 36 20 18 12 4 26 11 4 21 31 11 40 a Construct the stem and leaf plot below 5 11 8 25 2 12 Legend 5 1 represents 51 grams of fat

Statistics
StatisticsThe mean finish time for a yearly amateur auto race was 185 42 minutes with a standard deviation of 0 375 minute The winning car driven by Frank finished in 184 95 minutes The previous year s race had a mean finishing time of 110 1 with a standard deviation of 0 134 minute The winning car that year driven by Karla finished in 109 81 minutes Find their respective z scores Who had the more convincing victory Frank had a finish time with a z score of Karlahad a finish time with a z score of Round to two decimal places as needed Which driver had a more convincing victory OA Karla had a more convincing victory because of a lower z score OB Frank a more convincing victory because of a higher z score OC Karla had a more convincing victory because of a higher z score OD Frank a more convincing victory because of a lower z score

Statistics
Statisticssample of 20 registered voters was surveyed in which e respondents were asked Do you think Chang Ohnson Ohm or Smith is most qualified to be senator The results of the survey are shown in the able Johnson Ohm Johnson Johnson Johnson Ohm Johnson Chang Complete parts a and b to the right Johnson Chang Johnson Smith Ohm Ohm Ohm Johnson Chang Johnson Johnson Ohm 0 a Determine the mode candidate OSmith O O O Ohm Johnson Chang b Do you think it would be a good idea to rotate the candidate choices in the question Why OA Yes to confuse the respondents OB Yes to avoid response bias OC Yes to make the resulting counts all closer to each other There is no need to rotate the choices

Statistics
StatisticsThe probability distribution for the number of students in Statistics classes offered at a small college i given but one value is missing Fill in the missing value then answer the questions that follow P X X 21 0 12 22 0 16 23 0 19 24 25 0 39 0 14 Find the mean number of students in a Statistics class at the college 25 2

Statistics
StatisticsA population of values has a normal distribution with 170 9 and 61 4 You intend to draw a random sample of size n 101 Find the probability that a sample of size n 186 2 P 176 4 186 2 101 is randomly selected with a mean between 176 4 and
Statistics
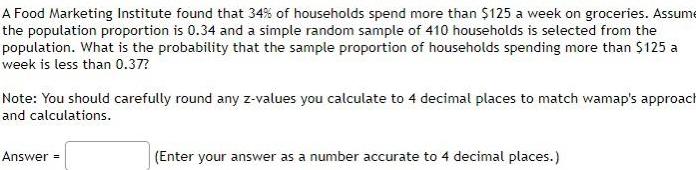
ProbabilityA Food Marketing Institute found that 34 of households spend more than 125 a week on groceries Assume the population proportion is 0 34 and a simple random sample of 410 households is selected from the population What is the probability that the sample proportion of households spending more than 125 a week is less than 0 37 Note You should carefully round any z values you calculate to 4 decimal places to match wamap s approach and calculations Answer Enter your answer as a number accurate to 4 decimal places

Statistics
StatisticsThe town of Know WearSpatial U S A operates a rubbish waste disposal facility that is overloaded if its 5063 households discard waste with weights having a mean that exceeds 26 52 lb wk For many different weeks it is found that the samples of 5063 households have weights that are normally distributed with a mean of 26 03 lb and a standard deviation of 12 98 lb What is the proportion of weeks in which the waste disposal facility is overloaded P T 26 52 Enter your answer as a number accurate to 4 decimal places NOTE Answers obtained using exact z scores or z scores rounded to 3 decimal places are accepted
Statistics
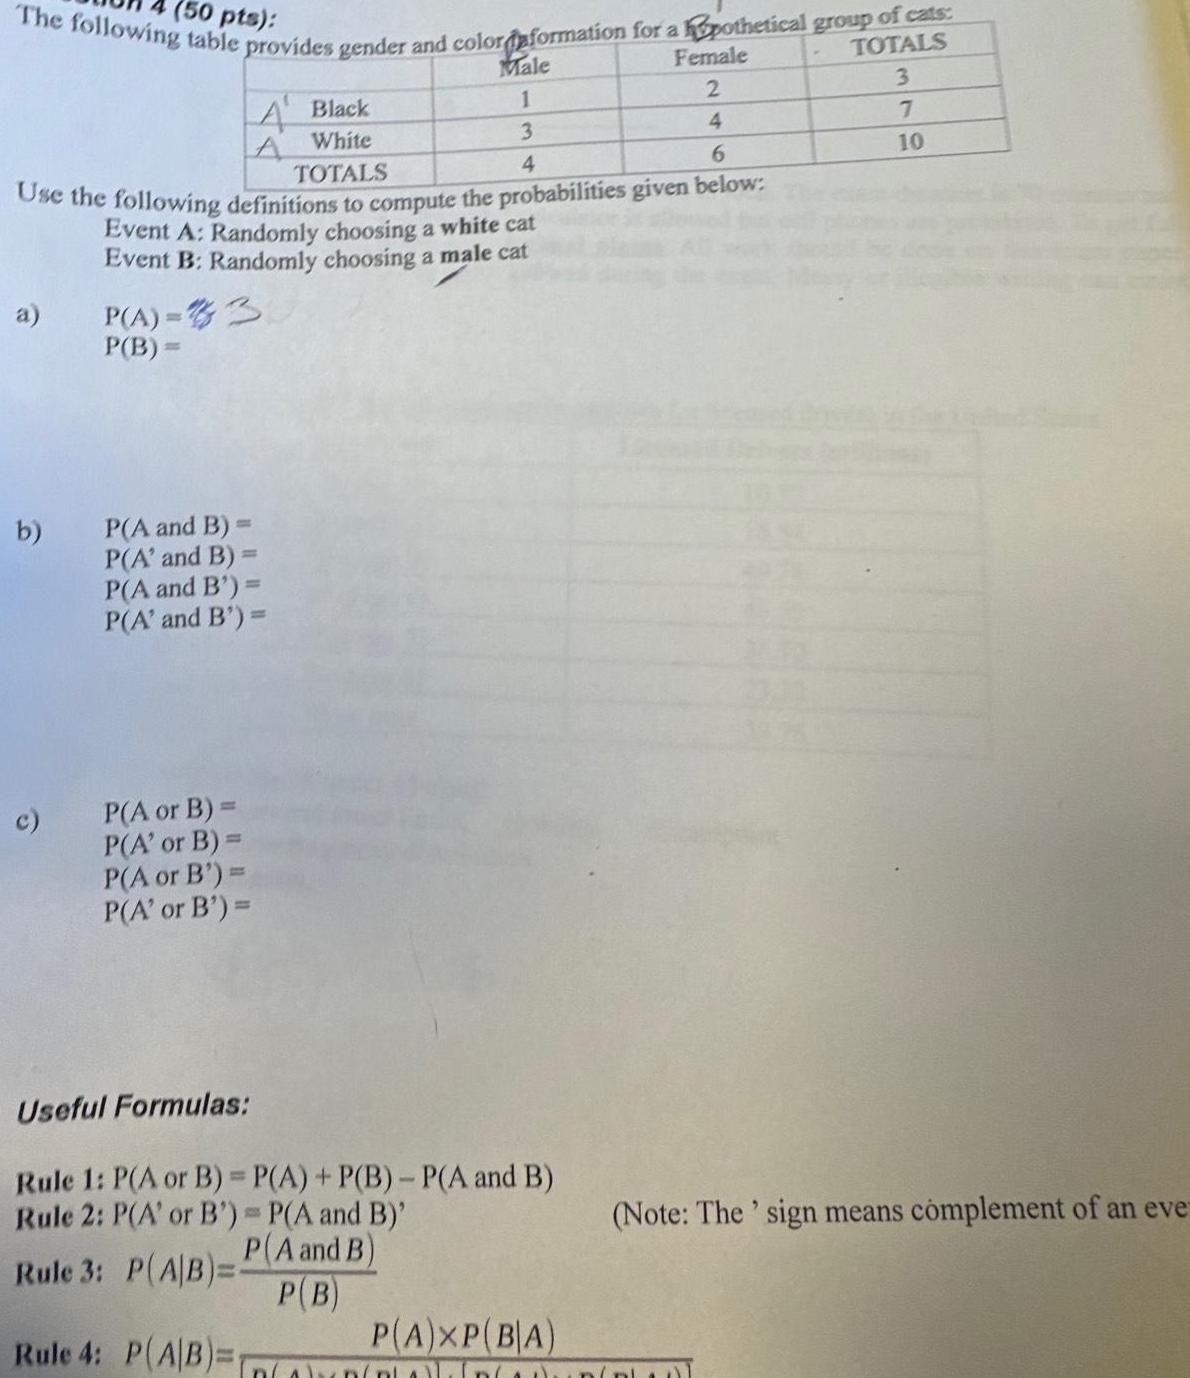
Probability50 pts The following table provides gender and color information for a hypothetical group of cats TOTALS 3 Male Female 1 2 3 4 TOTALS 4 6 Use the following definitions to compute the probabilities given below Event A Randomly choosing a white cat Event B Randomly choosing a male cat a b c A Black A White P A 3 P B P A and B P A and B P A and B P A and B P A or B P A or B P A or B P A or B Useful Formulas Rule 1 P A or B P A P B P A and B Rule 2 P A or B P A and B P A and B Rule 3 P A B P B Rule 4 P A B P A XP BA 7 10 Note The sign means complement of an eve
Statistics
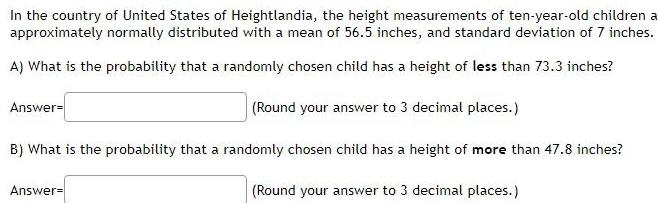
ProbabilityIn the country of United States of Heightlandia the height measurements of ten year old children a approximately normally distributed with a mean of 56 5 inches and standard deviation of 7 inches A What is the probability that a randomly chosen child has a height of less than 73 3 inches Round your answer to 3 decimal places B What is the probability that a randomly chosen child has a height of more than 47 8 inches Round your answer to 3 decimal places Answer Answer
Statistics
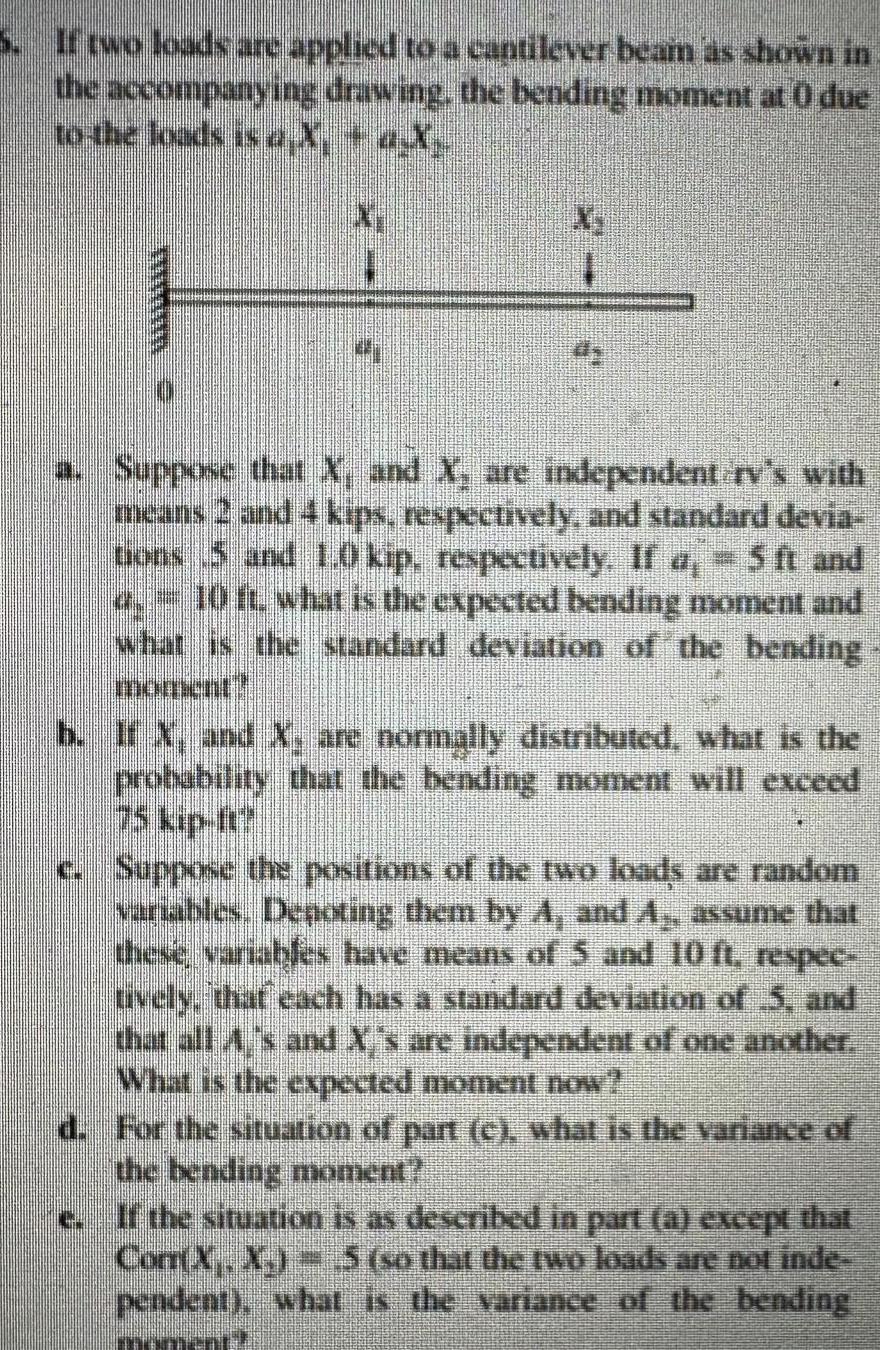
ProbabilityIf two loads are applied to a cantilever beam as shown in the accompanying drawing the bending moment at 0 due to the loads is a X a X mum X a Suppose that X and X are independent rv s with means 2 and 4 kips respectively and standard devia tions 5 and 1 0 kip respectively If a 5 ft and o 10 ft what is the expected bending moment and what is the standard deviation of the bending b If X and X are normally distributed what is the probability that the bending moment will exceed c Suppose the positions of the two loads are random variables De oting them by A and A assume that these variables have means of 5 and 10 ft respec uvely that each has a standard deviation of 5 and that all A s and X s are independent of one another What is the expected moment now d For the situation of part c what is the variance of the bending moment e If the situation is as described in part a except that Com X X 5 so that the two loads are not inde pendent what is the variance of the bending
Statistics
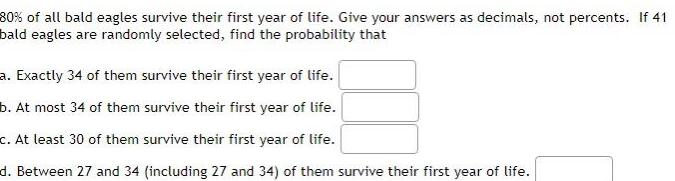
Probability80 of all bald eagles survive their first year of life Give your answers as decimals not percents If 41 bald eagles are randomly selected find the probability that a Exactly 34 of them survive their first year of life b At most 34 of them survive their first year of life c At least 30 of them survive their first year of life d Between 27 and 34 including 27 and 34 of them survive their first year of life
Statistics
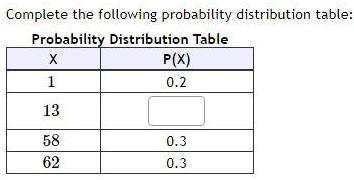
ProbabilityComplete the following probability distribution table Probability Distribution Table X 1 13 58 62 P X 0 2 0 3 0 3
Statistics
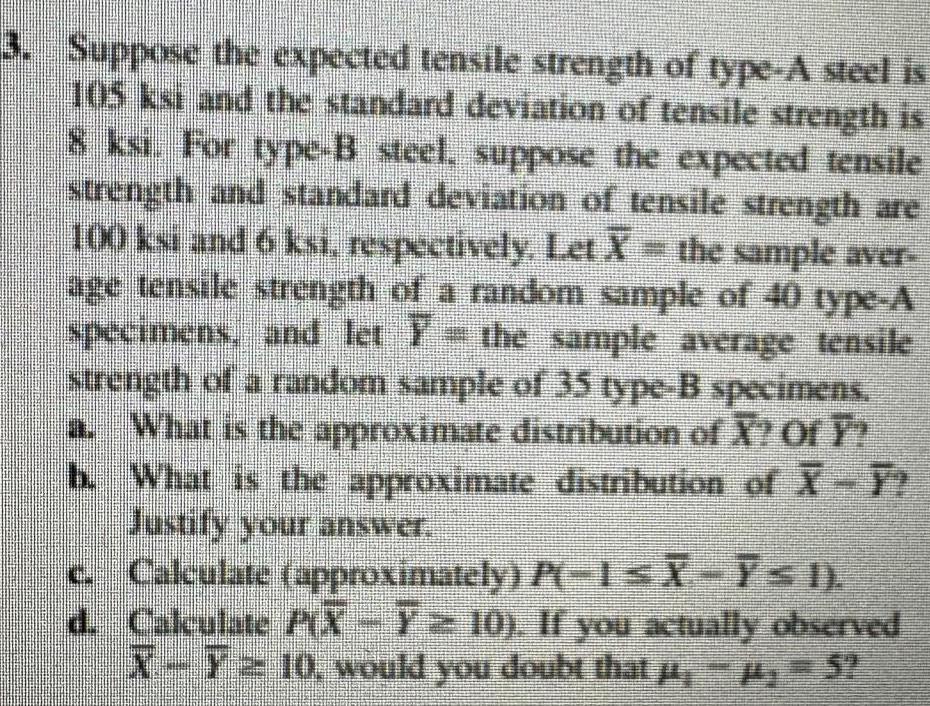
Probability3 Suppose the expected tensile strength of type A steel is 105 ksi and the standard deviation of tensile strength is 8 ksi For type B steel suppose the expected tensile strength and standard deviation of tensile strength are 100 ksi and 6 ksi respectively Let X the sample aver age tensile strength of a random sample of 40 type A specimens and let the sample average tensile strength of a random sample of 35 type B specimens a What is the approximate distribution of X Of Y What is the approximate distribution of X Y Justify your answer b c d S Calculate approximately P 1 X I Calculate PX 7 10 If you actually observed X T10 would you doubt that 5
Statistics
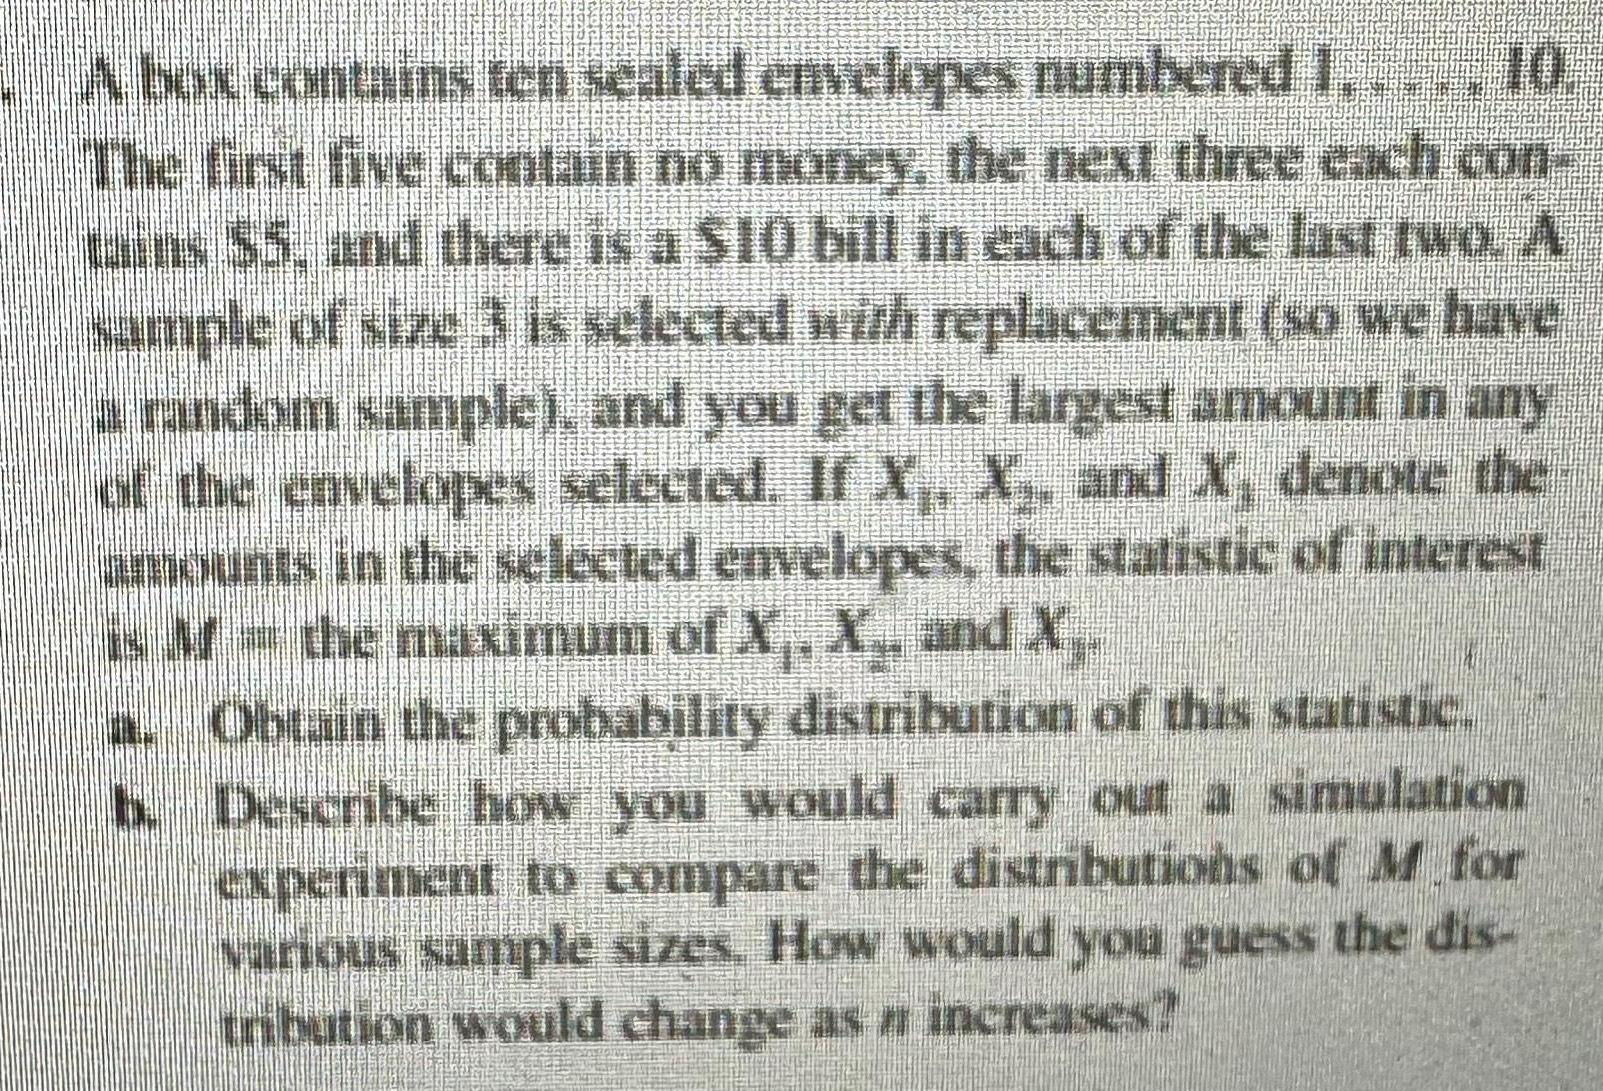
ProbabilityA box contains ten sealed envelopes numbered 1 10 The first five contain no money the next three each con tains 5 and there is a 10 bill in each of the last two A sample of size 3 is selected with replacement so we have a random sample and you get the largest amount in any of the envelopes selected If X X and X denote the amounts in the selected envelopes the statistic of interest is the maximum of X X and X NO Obtain the probability distribution of this statistic b Describe how you would carry out a simulation experiment to compare the distributions of M for various sample sizes How would you guess the dis tribution would change as n increases
Statistics
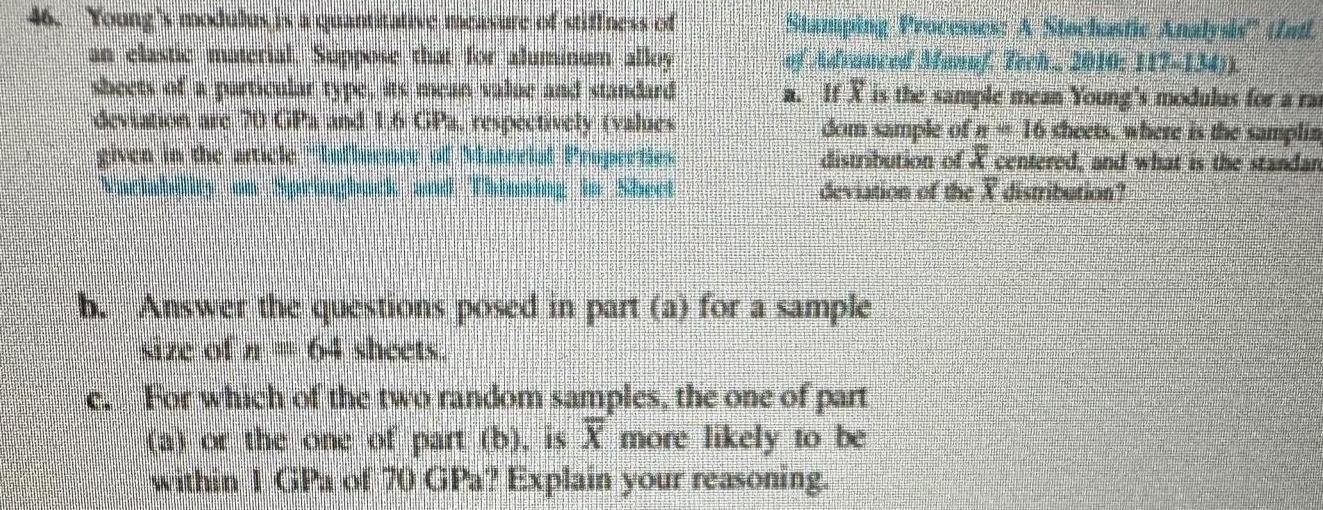
ProbabilityYoung s mes uws Ninwa UNUNG P Tessut NI TENA SIN DAL Makund 2016 GPL respectively values Stamping Processes Stockalic Anahir Unt And af fag Tamm 1010E DIT INT a It is the sample mean Young s modulas for a ran dom sample of a 16 sheets where is the samplin distribution of centered and what is the standard deviation of the distribution h Answer the questions posed in part a for a sample For which of the two random samples the one of part a or the one of part b is X more likely to be within 1 GPs of 70 GPa Explain your reasoning

Statistics
Statistics86 A student has a class that is supposed to end at 9 00 am and another that is supposed to begin at 9 10 am Suppose the actual ending time of the 9 A M class is a normally distributed ry X with mean 9 02 and standard deviation 1 5 min and that the starting time of the next class is also a normally distributed ry X with mean 9 10 and standard deviation I min Suppose also that the time necessary to get from one classroom to the other is a normally distributed ry X with mean 6 min and standard deviation 1 min What is the probability that the student makes it to the second class before the lecture starts Assume independence of X X and X which is reason able if the student pays no attention to the finishing time
Statistics
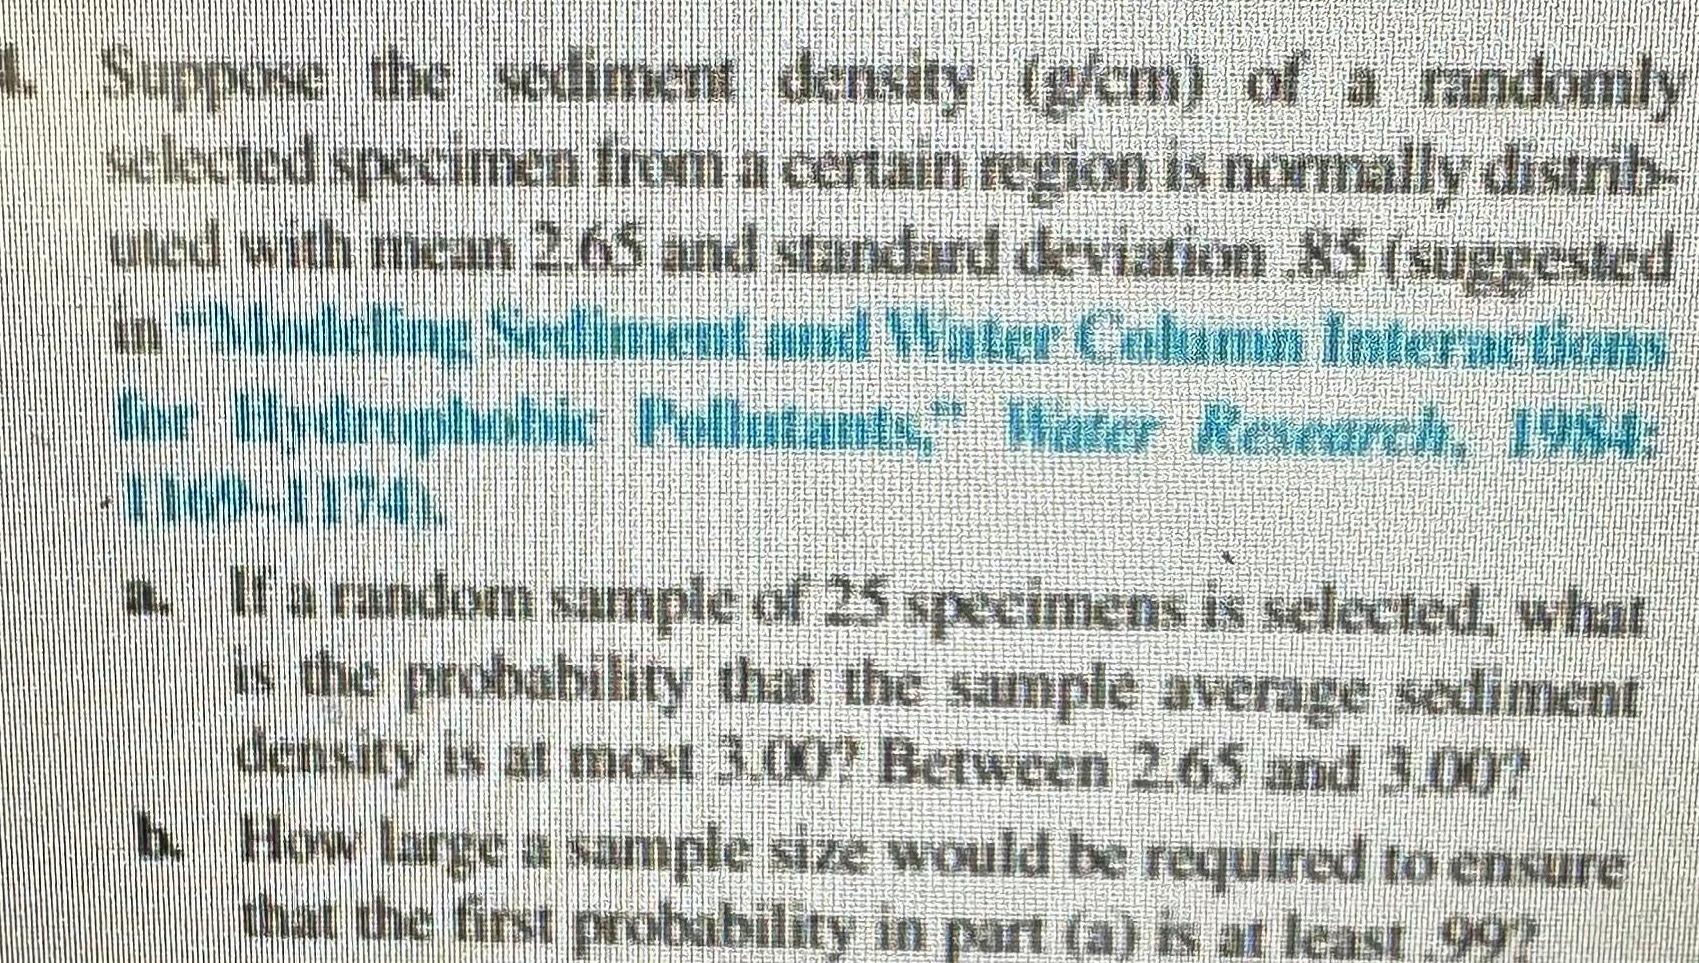
Probability4 Suppose the sediment density g cm of a randomly selected specimen from a certain region is normally distrib uted with mean 2 65 and standard deviation 85 suggested in Modeling Sediment and Water Column Interactions for Hydrophobic Pellutants Water Research 1984 a If a random sample of 25 specimens is selected what is the probability that the sample average sediment density is at most 3 00 Between 2 65 and 3 007 b How large a sample size would be required to ensure that the first probability in part a is at least 997

Statistics
Statistics4 F two y Put the letter as answer choice in the answer box Put the lower limit in the first box and upper limit in the second box A 0 0054 B 0 1899 C 0 2066 D 0 0220 E 0 2119 e 95 confidence interval for adults who have donated blood in the pa Round your answers to 4 decimal places F 0 1846 A Y A

Statistics
Statistics2 0996 B 0 3987 C 0 0001 D 0 0083 3 The margin of error has a value of Put the letter as answer choice in the answer box A 0 0083 B 0 0137 C 0 0001 D 1 6450 4 Find the 95 confidence interval for adults who have donated blood in the pa

Statistics
StatisticsGallup survey of 2295 adults at least 18 years old in the U S found that 455 of them have donated blood in the past two years Construct a 90 confidence intervai for the population proportion of adults in the U S who have donated blood in the past two years Round your answer to three decimal places Find the 90 confidence interval Use Z 1 645 Use the unrounded values in Excel to find the answers to 2 3 and 4 Round your answer to four decimal places 1 Find the sample proportion of adults in the U S who have donated blood in the past two years Put the letter as answer choice in the answer box A 0 1983 B 5 000 C 0 5000 D 0 0083 A 2 The standard error for sample proportion has a value of Put the letter as answer choice in the answer box A 19 0996
Statistics
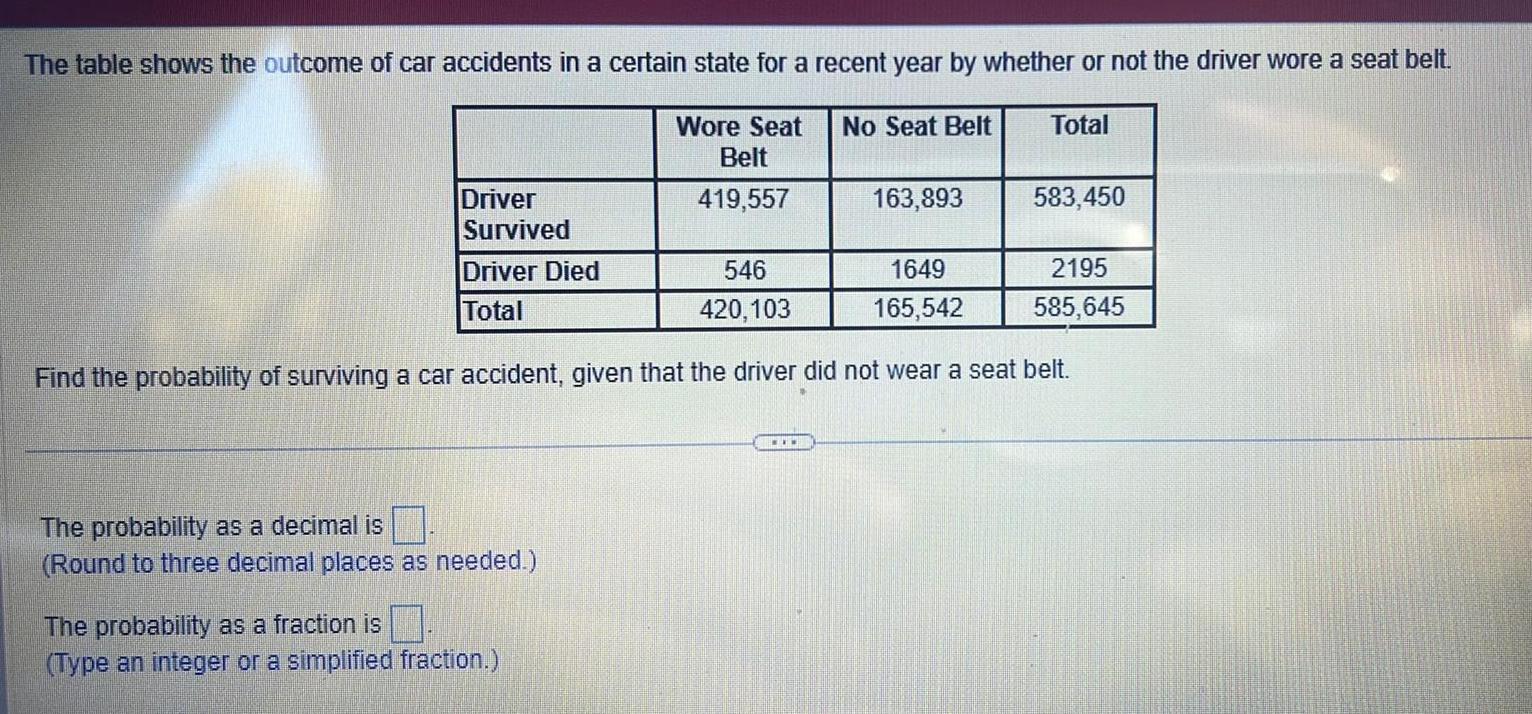
ProbabilityThe table shows the outcome of car accidents in a certain state for a recent year by whether or not the driver wore a seat belt Total Wore Seat Belt 419 557 Driver Survived Driver Died Total The probability as a decimal is Round to three decimal places as needed The probability as a fraction is Type an integer or a simplified fraction No Seat Belt 546 1649 420 103 165 542 Find the probability of surviving a car accident given that the driver did not wear a seat belt www 163 893 583 450 2195 585 645
Statistics
ProbabilityListen A factory produces plate glass with a mean thickness of 4mm and a standard deviation of 1 1mm A simple random sample of 100 sheets of glass is to be measured and the mean thickness of the 100 sheets is to be computed What is the probability that the average thickness of the 100 sheets is less than 4 07 mm Round your answers to 5 decimal places A

Statistics
StatisticsSuppose that 65 of all dialysis patients will survive for at least 5 years In a simple random sample of 100 new dialysis patients what is the probability that the proportion surviving for at least five years will exceed 80 rounded to 5 decimal places 0 00080 A
Statistics
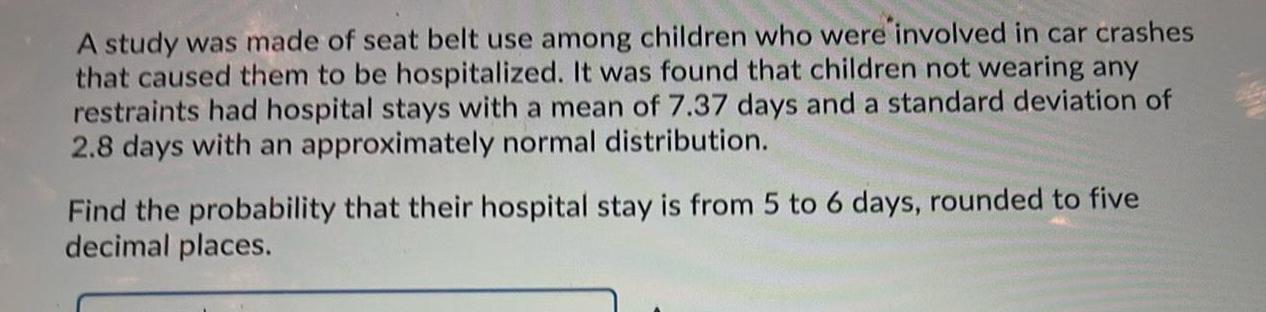
ProbabilityA study was made of seat belt use among children who were involved in car crashes that caused them to be hospitalized It was found that children not wearing any restraints had hospital stays with a mean of 7 37 days and a standard deviation of 2 8 days with an approximately normal distribution Find the probability that their hospital stay is from 5 to 6 days rounded to five decimal places
Statistics
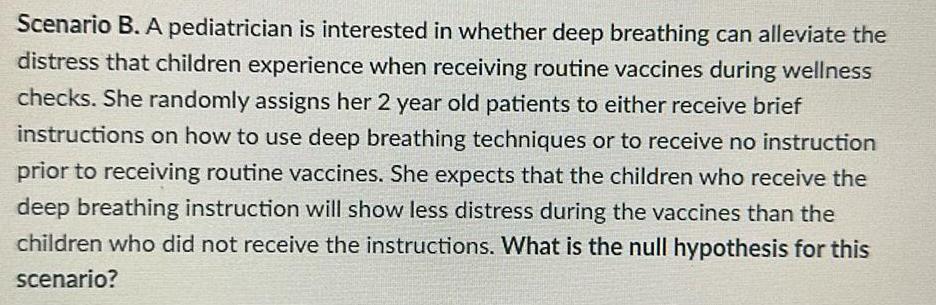
ProbabilityScenario B A pediatrician is interested in whether deep breathing can alleviate the distress that children experience when receiving routine vaccines during wellness checks She randomly assigns her 2 year old patients to either receive brief instructions on how to use deep breathing techniques or to receive no instruction prior to receiving routine vaccines She expects that the children who receive the deep breathing instruction will show less distress during the vaccines than the children who did not receive the instructions What is the null hypothesis for this scenario

Statistics
StatisticsST RS ZPST ZQSR RS 1 QR and ST 1 PT Complete the proof that APST AQSR T S 1 2 ST RS LPST ZQSR RS QR ST PT ZT ZR 6 APST AQSR 3 4 R 5 Statement P Reason Given Given Given Given

Statistics
StatisticsSuppose that the blood cholesterol levels of all men age 20 to 34 years follows the Normal distribution with mean 188 milligrams per deciliter mg dl and standard deviation o 41 mg dl Choose an SRS of 1000 men from this population What is the sampling distribution of x N 5 9451 mg dl 1 2965 mg dl N 188 mg dl 41 mg dl N 188 mg dl 4 1 mg dl N 188 mg dl 1 2965 mg dl Now what is the probability that x falls within 3 mg dl of Give your answer to four decimal places P 185 191 2 3148

Statistics
StatisticsMacmillan Learning Let s illustrate the idea of a sampling distribution in the case of a very small sample from a very small population The given population is the 10 female students in a class Student Weight Mean 0 1 2 136 99 118 137 8 3 4 129 125 The parameter of interest is the mean weight in pounds in this population The sample is an SRS of size n 4 drawn from the population Because the students are labeled 0 to 9 a single random digit from Table A chooses one student for the sample Incorrect 5 170 Repeat the process nine more times using the first four digits in rows 117 to 125 of Table A Calculate the mean of the ten values Provide your answer to one decimal place 6 7 8 9 130 128 120 147 Make a histogram of the 10 values of x You are constructing the sampling distribution of x

Statistics
Statistics16 Construct a 95 confidence interval to test HO P P2 0 versus H1 P P 0 using the classical approach at the a 0 02 level of significance given the following summary statistics of two independent random samples p 0 42 P2 0 36 n 300 and n 400 What is the test statistic Round your answer to the nearest thousandths Answer Previous Answer 1 614 Return to overview
Statistics
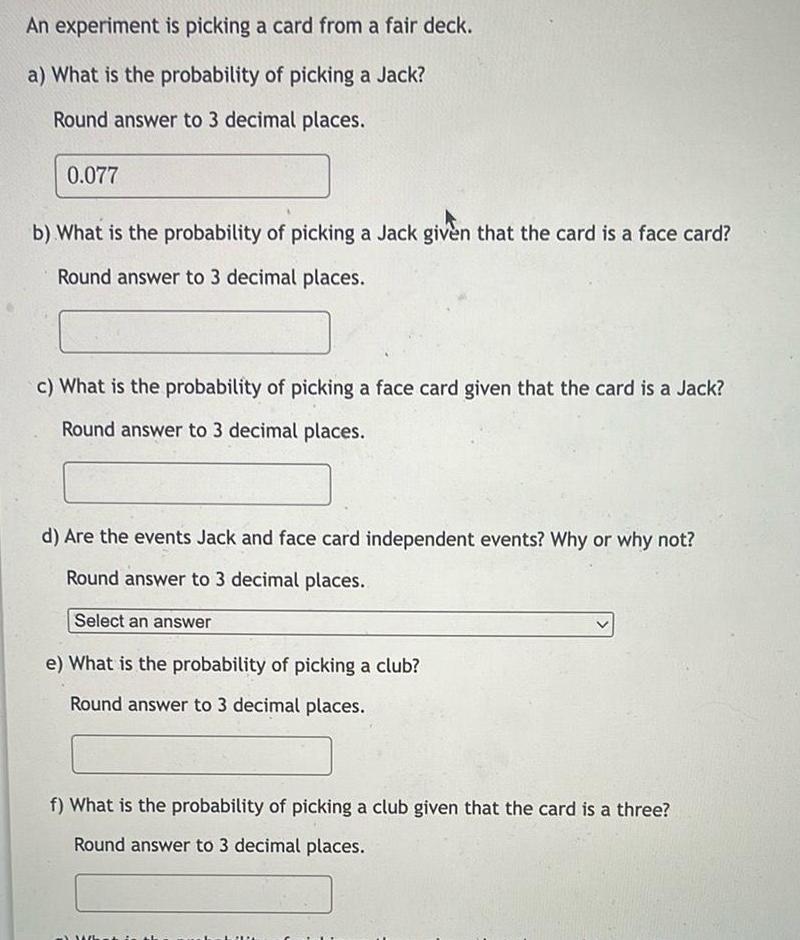
ProbabilityAn experiment is picking a card from a fair deck a What is the probability of picking a Jack Round answer to 3 decimal places 0 077 b What is the probability of picking a Jack given that the card is a face card Round answer to 3 decimal places c What is the probability of picking a face card given that the card is a Jack Round answer to 3 decimal places d Are the events Jack and face card independent events Why or why not Round answer to 3 decimal places Select an answer e What is the probability of picking a club Round answer to 3 decimal places f What is the probability of picking a club given that the card is a three Round answer to 3 decimal places What is LIN
Statistics
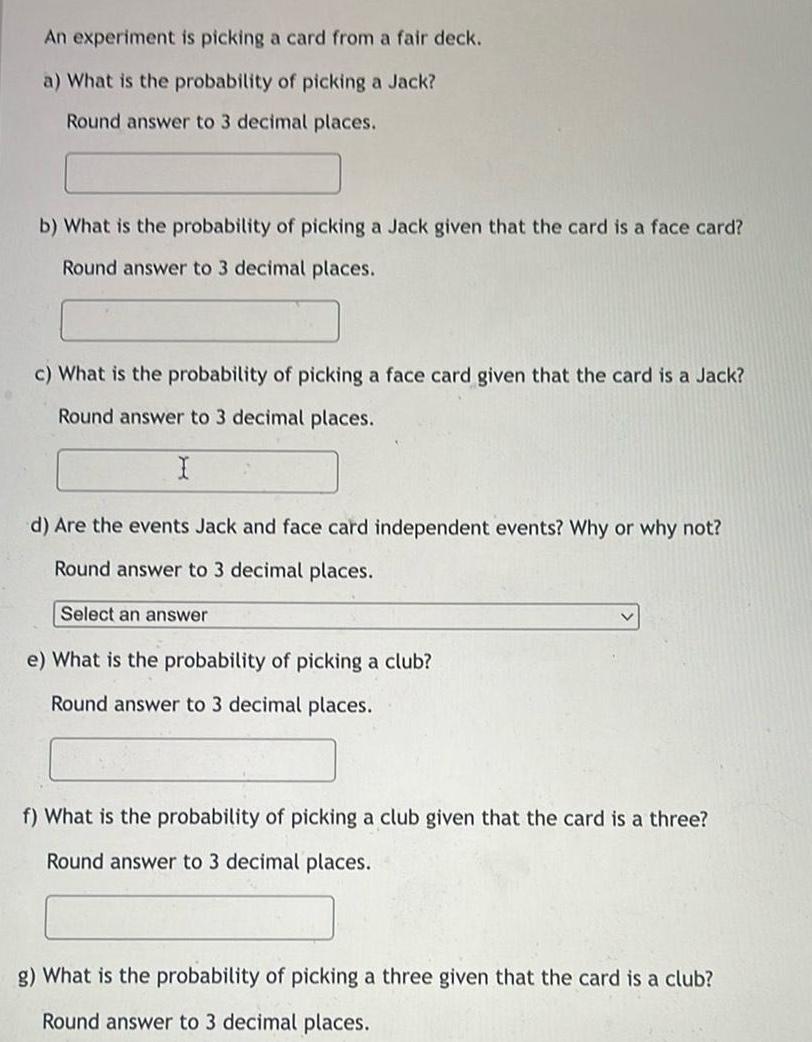
ProbabilityAn experiment is picking a card from a fair deck a What is the probability of picking a Jack Round answer to 3 decimal places b What is the probability of picking a Jack given that the card is a face card Round answer to 3 decimal places c What is the probability of picking a face card given that the card is a Jack Round answer to 3 decimal places I d Are the events Jack and face card independent events Why or why not Round answer to 3 decimal places Select an answer e What is the probability of picking a club Round answer to 3 decimal places f What is the probability of picking a club given that the card is a three Round answer to 3 decimal places g What is the probability of picking a three given that the card is a club Round answer to 3 decimal places
Statistics
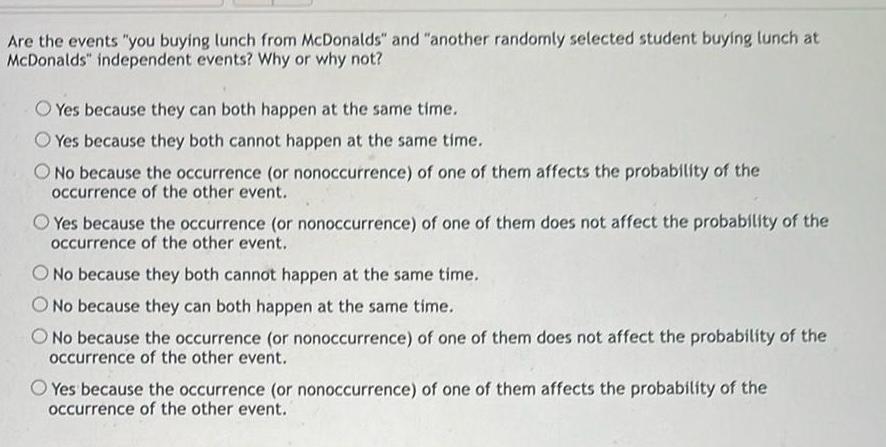
ProbabilityAre the events you buying lunch from McDonalds and another randomly selected student buying lunch at McDonalds independent events Why or why not Yes because they can both happen at the same time Yes because they both cannot happen at the same time O No because the occurrence or nonoccurrence of one of them affects the probability of the occurrence of the other event Yes because the occurrence or nonoccurrence of one of them does not affect the probability of the occurrence of the other event O No because they both cannot happen at the same time O No because they can both happen at the same time O No because the occurrence or nonoccurrence of one of them does not affect the probability of the occurrence of the other event Yes because the occurrence or nonoccurrence of one of them affects the probability of the occurrence of the other event

Statistics
Probabilityb What is the probability that a survivor was in the 3rd class Round final answer to 3 decimal places 0 262 c What is the probability that a survivor was a female given that the person was in 3rd class Round final answer to 3 decimal places 0 800 d What is the probability that a survivor was a female and in the 3rd class Round final answer to 3 decimal places 0 208 e What is the probability that a survivor was a female or in the 3rd class Round final answer to 3 decimal places Q 0 736 f Are the events survivor is a female and survivor is in 3rd class mutually exclusive Why or why r Select an answer g Are the events survivor is a female and survivor is in 3rd class independent Select an answer Yes because P female and 3rd class 0 No because P female and 3rd class 0 Yes because P female and 3rd class is not equal to 0 No because P female and 3rd class is not equal to 0 Yes because P female or 3rd class 0 No because P female or 3rd class 0 Yes because P female 3rd class P female No because P female 3rd class is not equal to P female Yes because P female 3rd class P 3rd class locc is not equal to R 3rd class Post to forum

Statistics
Statistics1 point Before conducting a study it is often a good idea to decide on the necessary sample size To do so statisticians often first decide on an acceptable margin of error and then work backward to the sample size Since they haven t run the study yet it is common practice to approximate sample proportion as 50 since this is the worst case scenario Recall that the standard error for a single proportion is SE p 1 p n Note The calculation to find the sample size will likely give a decimal answer so be sure to round appropriately so that the actual margin of error wil less than what the researchers want a If researchers decide on a 4 8 margin of error for a 95 confidence interval What sample size should they pursue b If researchers decide on a 2 8 margin of error for a 99 confidence interval What sample size should they pursue Hint We need a whole number of people not fractional people so please round up

Statistics
ProbabilityResearchers watched dolphin groups off the coast of Ireland in 1998 to determine what activities the dolphin groups partake in at certain times of the day The numbers in table below represent the number of dolphin groups that were partaking in an activity at certain times of days Activity Morning Travel Feed Social Total 6 28 38 72 Noon 6 4 5 15 Afternoon 14 0 9 23 Evening 13 56 10 79 Total 39 88 62 189 a What is the probability that a dolphin group is partaking in travel Round your final answer to 3 decimal places b What is the probability that a dolphin group is around at noon Round your final answer to 3 decimal places c What is the probability that a dolphin group is partaking in travel given that it is around at noon Round your final answer to 3 decimal places d What is the probability that a dolphin group is around at noon given that it is partaking in travel Round your final answer to 3 decimal places e What is the probability that a dolphin group is around in the afternoon given that it is partaking in travel Round your final answer to 3 decimal places