Statistics Questions
The best high school and college tutors are just a click away, 24×7! Pick a subject, ask a question, and get a detailed, handwritten solution personalized for you in minutes. We cover Math, Physics, Chemistry & Biology.

Statistics
StatisticsThe article Sleepless in School describes a study of 282 college students The students were recruited from a general education psychology course a course taken by students from different majors and they were offered extra credit to fill out an online survey The survey included questions about the students sleep health e g hours of sleep during a usual school week as well as questions about possible social determinants of deficient sleep e g food insecurity psychological distress Answer the following four questions for this observational study Hint Reviewing Examples 1 4 and 1 5 might be helpful a What is the population of interest O all students majoring in education psychology all adults O all college students b Was the sample selected in a reasonable way Yes the sample was randomly selected No only college students were represented No the sample size is less than 500 which is too small for a large university No the class had students from a variety of majors but it may not be representative of all majors c Is the sample likely to be representative of the population of interest Yes enough students participated to provide a reasonable estimate of the population O Yes the college student population was well represented O No because only students in this class were selected No the population of interest is all adults and only college students were studied d Are there any obvious sources of bias O Selection bias is present because students who need extra credit may be overrepresented ANOTH O No sampling bias is present O Nonresponse bias is present because not all students enrolled in the course completed the online survey ons were worded poorly

Statistics
StatisticsThe National Highway Traffic Safety Administration reported that in 2018 857 cyclists were killed on public roadways in the United States and that the average age of the cyclists killed was 47 These figures were based on an analysis of the records of all traffic related deaths of cyclists on U S public roadways in 2018 a Does the group of 857 cycling fatalities represent a census or a sample of the cycling fatalities in 2018 census Osample a If the population of interest is cycling fatalities in 2018 is the given average age of 47 years a statistic or a population characteristic MY N adatt
Statistics
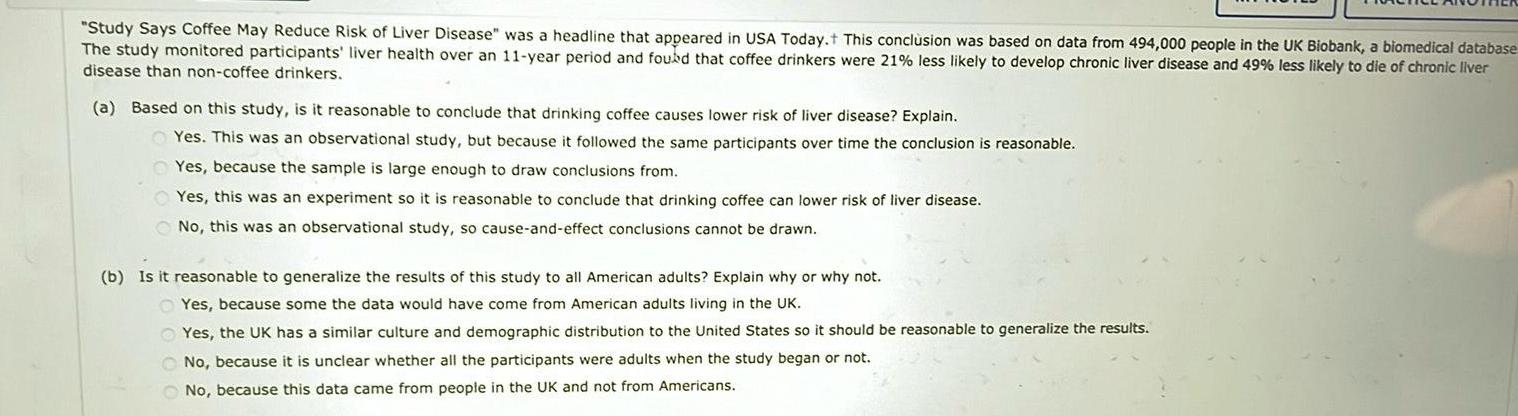
ProbabilityStudy Says Coffee May Reduce Risk of Liver Disease was a headline that appeared in USA Today This conclusion was based on data from 494 000 people in the UK Biobank a biomedical database The study monitored participants liver health over an 11 year period and found that coffee drinkers were 21 less likely to develop chronic liver disease and 49 less likely to die of chronic liver disease than non coffee drinkers a Based on this study is it reasonable to conclude that drinking coffee causes lower risk of liver disease Explain Yes This was an observational study but because it followed the same participants over time the conclusion is reasonable Yes because the sample is large enough to draw conclusions from Yes this was an experiment so it is reasonable to conclude that drinking coffee can lower risk of liver disease No this was an observational study so cause and effect conclusions cannot be drawn b Is it reasonable to generalize the results of this study to all American adults Explain why or why not Yes because some the data would have come from American adults living in the UK Yes the UK has a similar culture and demographic distribution to the United States so it should be reasonable to generalize the results No because it is unclear whether all the participants were adults when the study began or not No because this data came from people in the UK and not from Americans

Statistics
StatisticsThe paper The Impact of Information Disclosure on Consumer Behavior described a study of the ordering behavior of diners at full service restaurants on a college campus When parties checked in to be seated some parties received the usual set of menus and some parties received identical menus with the addition of calorie labels The researchers were interested in whe receiving information about the number of calories in each menu item would influence what the diners ordered The researchers summarized their conclusions with the following statement estimate that the labels resulted in a 3 0 reduction in calories ordered with the reduction occurring in appetizers and entrees but not drinks or desserts Indicate whether the study is an observational study or an experiment Give a brief explanation for your choice This is an observational study because the researchers recorded what each diner ordered This is an observational study because the participants responded to a survey of what menu items they ordered at the restaurants This is an experiment because the parties of diners were randomly selected to have a meal a full service restaurant on a college campus This is an experiment because the diners were assigned different experimental conditions the usual menus or menus with calorie labels Need Help

Statistics
StatisticsSubmit Answer PECKST T3 1 2 004 In a survey of 2 500 U S adults 68 responded that they were confident that smart homes will be as commonplace as smartphones within 10 years Indicate whether the study is an o study or an experiment Give a brief explanation for your choice Hint See Examples 1 2 and 1 3 O This is an observational study because the researchers observed how many of the 2 500 adults have smartphones This is an experiment because the adults were assigned to different experimental groups and then the researchers recorded responses to questions on a survey This is an observational study because the researchers recorded responses to questions on a survey No adults were assigned to different experimental groups 2 Points DETAILS A

Statistics
StatisticsIn 2019 the Economic Policy Institute published a report titled The Teacher Shortage Is Real Large and Growing and Worse than We Thought Interested in the causes of the teacher shortage suppose a researcher wants to conduct a follow up study measuring job satisfaction among teachers and other professionals who work in schools They start by dividing educational roles into five groups administrators experienced teachers new teachers teachers aides and other school staff They then randomly select educators from within each of these five groups Would this sample be a simple random sample a systematic sample a stratified sample or a cluster sample O simple random sample O systematic sample O stratified sample cluster sample Need Help Read It MY NOTES

Statistics
Statisticsng conclusion from a statistical study appeared in the article Is Marriage Becoming Irrelevant Fewer U S adults now than in past years believe it is very important for couples w have children together to be married Currently 29 say it is very important that such a couple legally marry down from 38 who held this view in 2013 and 49 in 2006 Indicate whether study is an observational study or an experiment Give a brief explanation for your choice Hint See Examples 1 2 and 1 3 This is an experiment because the researchers compared the changes in opinion over multiple time periods O This is an observational study because the researchers recorded responses to a survey No adults were assigned to different experimental groups This is an experiment because the researchers conducted different treatments on married and unmarried couples This is an observational study because the researchers recorded how many married and unmarried couples had children Need Help Read It Submit Answer DETAILS PECKSTAT3 1 2 002 MY NOTE 2 2 Points The article Walking Dogs Is Sending Older People to the ER Study Says describes a study that analyzed data from hospital emergency departments throughout the United States from 2004 to 201 The researchers found over 32 000 cases of fractures among people 65 and older that were associated with walking dogs They also found that these cases were becoming more frequent over time nuntional study or an experiment Give a brief explanation for your choice Hint See Examples 1 2 and 1 3

Statistics
StatisticsData from a survey of 10 413 students and 588 teachers conducted for the Knight Foundation were used to calculate the following estimates 65 of students and 40 of teachers chose freedom an speech as the most important of the rights guaranteed by the First Amendment Are the given percentages statistics or population characteristics Both percentages given are statistics Both percentages given are population characteristics 65 of students is a population characteristic and 40 of teachers is a statistic O 65 of students is a statistic and 40 of teachers is a population characteristic MY NOTE

Statistics
StatisticsAn article titled The More Pets You Meet as a Baby the Lower Your Risk of Allergies reports the results from a study of 1 029 children t The incidence of allergies was 49 percent in children who had spent their first 12 months of life in a home with no pet This fell to 43 percent in children who as bables had lived with one pet and 24 percent for children who had lived with three pets Two of the children had lived with five pets neither of them had allergies Explain why it is not reasonable to conclude that being raised with more pets is the cause of the observed lower allergy rate It is reasonable because it would be unethical to perform an experiment that may induce allergies in children so we must use an observational study It is not reasonable because children can be allergic to things besides pets such as food items or medications It is not reasonable because this was an observational study so cause and effect conclusions cannot be drawn It is reasonable because there is a clear declining trend in allergy incidence based on the number of pets the child lived with MY NOTE Need Help Read It

Statistics
Statisticsacee Sy Te Roseyorts that 35 of working Americans spend money on time saving services each month What condition on how the data were collected wo de lze this rest to the population of all working Americans met de selected from the population of all working Americans al umber of participants from each state who are working Americans my selected from the population of all Amencans regardless of employment status domy selected from the population of all working Americans who use time saving services The sample se ocean The sample made The sample must be MY NG Boat R

Statistics
StatisticsThe paper Turning to Learn Screen Orientation and Reasoning from Small Devices describes a study that investigated whether cell phones with small screens are useful for gathering information The researchers wondered if the ability to reason using information read on a small screen was affected by the screen orientation The researchers assigned 33 undergraduate students who were enrolled in a psychology course at a large public university to one of two groups at random One group read material that was displayed a small screen in portrait orientation and the other group read material on the same size screen but turned to display the information in landscape orientation see the following figure Portrait Landscape The researchers found that performance on a reasoning test based on the displayed material was better for the group that read material in the landscape orientation Is the study described above an observational study or an experiment Oan observational study an experiment

Statistics
StatisticsThe article Palking Dogs Is Sending Older People to the ER Study Says describes a study that analyzed data from hospital emergency departments throughout the United States from 2004 to 201 The researchers found over 32 000 cases of fractures among people 65 and older that were associated with walking dogs They also found that these cases were becoming more frequent over time Indicate whether the study is an observational study or an experiment Give a brief explanation for your choice Hint See Examples 1 2 and 1 3 This is an experiment because all subjects were adults 65 and older The only difference in the groups is if the subject was walking a dog This is an experiment because the researchers obtained data gathered by hospital emergency departments This is an observational study because the researchers administered a survey to older adults but they were not assigned treatments This is an observational study because the researchers analyzed data from hospital emergency departments No older people were assigned treatments Need Help Submit Answer 3 2 Points Read It DETAILS PECKSTAT3 1 2 004 MY NOTES In a survey of 2 500 U S adults 68 responded that they were confident that smart homes will be as commonplace as smartphones within 10 years Indicate whether the study is an observational study or an experiment Give a brief explanation for your choice Hint See Examples 1 2 and 1 3 This is an observational study because the researchers observed how many of the 2 500 adults have smartphones This is an experiment because the adults were assigned to different experimental groups and then the researchers recorded responses to questions on a survey O This is an observational study because the researchers recorded responses to questions on a survey No adults were assigned to different experimental groups bere conducted a survey Adults were randomly selected for the survey

Statistics
StatisticsAn article published in the Atlanta Journal Constitution included good news and bad news The good news is that a Southern diet is delicious and makes us happy The bad nev the risk of our dying early This statement was based on an observational study of more than 21 000 people ages 45 and older that included 10 years of follow up The study who ate a Southern style diet most regularly had a 46 higher risk of sudden cardiac death than people who had the least adherence to this dietary pattern Based on this stu conclude that a Southern style diet causes higher rates of cardiac death Explain why or why not No it not a reasonable conclusion because cause and effect conclusions cannot be drawn from an observational study Yes it is a reasonable conclusion because a 46 increase is a large enough effect that it must be related at least partially to diet Yes it is a reasonable conclusion because the 10 year follow up allows us to make valid comparisons of the effects of different diets No it not a reasonable conclusion because sudden cardiac events are not the only cause of early death

Statistics
StatisticsAssume the temper a gr randomly and you would like to estimate the mean temperature in degrees Fahrenheit with the following sample temperatures 84 9 87 3 83 7 83 8 85 8 83 79 8 79 1 78 7 82 4 74 3 84 4 Please construct a 98 confidence interval a Enter your answer as an open interval i e parentheses accurate to one decimal place Confidence interval b Express the same answer as a tri linear inequality one decimal place x c Express the same answer using the point estimate and margin of error Give your answers to one decimal place

Statistics
StatisticsA sample of 1300 computer chips revealed that 42 of the chips do not fail in the first 1000 hours of their use The company s promotional literature claimed that above 39 do not fail in the first 1000 hours of their use Is there sufficient evidence at the 0 05 level to support the company s claim State the null and alternative hypotheses for the above scenario Answer 2 Points Ho Keyp Keyboard Short

Statistics
Statistics11 Use the following data set to answer the following question 27 28 41 43 48 49 60 61 69 71 105 122 Find any outliers 27 O 121 O 122 O 28 27 and 28 O 105 and 122 O There are no outliers
Statistics
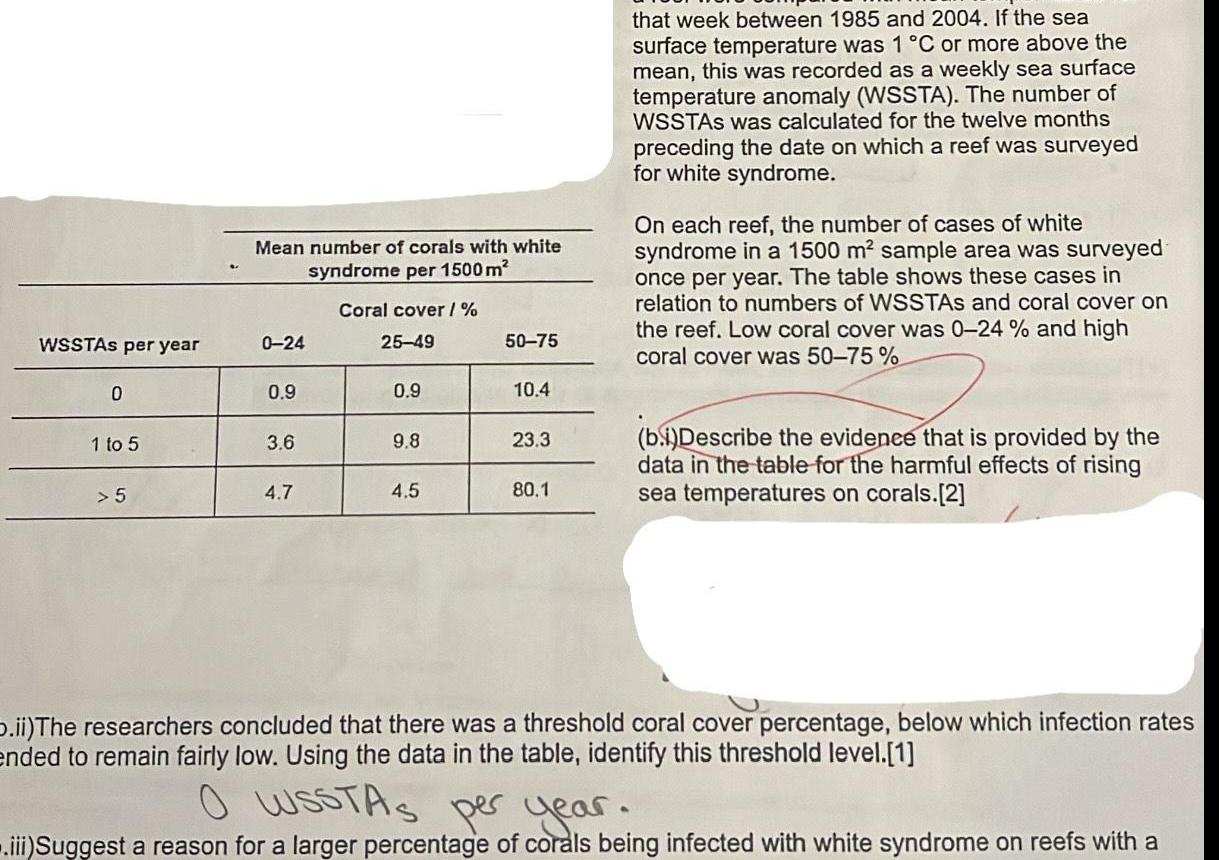
ProbabilityWSSTAs per year 0 1 to 5 5 Mean number of corals with white syndrome per 1500 m 0 24 0 9 3 6 4 7 Coral cover 25 49 0 9 9 8 4 5 50 75 10 4 23 3 80 1 that week between 1985 and 2004 If the sea surface temperature was 1 C or more above the mean this was recorded as a weekly sea surface temperature anomaly WSSTA The number of WSSTAS was calculated for the twelve months preceding the date on which a reef was surveyed for white syndrome On each reef the number of cases of white syndrome in a 1500 m sample area was surveyed once per year The table shows these cases in relation to numbers of WSSTAS and coral cover on the reef Low coral cover was 0 24 and high coral cover was 50 75 b i Describe the evidence that is provided by the data in the table for the harmful effects of rising sea temperatures on corals 2 D ii The researchers concluded that there was a threshold coral cover percentage below which infection rates ended to remain fairly low Using the data in the table identify this threshold level 1 O WSSTAS per year iii Suggest a reason for a larger percentage of corals being infected with white syndrome on reefs with a

Statistics
Statisticsa Raw materials purchased on credit 114 000 b Direct materials used 45 500 Indirect materials used 20 400 c Direct labor used 37 000 Indirect labor used 13 000 Record using Factory Wages Payable d Paid cash for other actual overhead costs 9 125 e Applied overhead at the rate of 125 of direct labor cost f Transferred cost of jobs completed to finished goods 80 500 g Sales of jobs on credit was 115 000 h Cost of jobs sold was 80 500 View transaction list Journal entry worksheet 1 2 Record raw materials 3 4 5 ased on account 6 7 8 9 10

Statistics
StatisticsInformation on Kwon Manufacturing s activities for its first month of operations follows a Purchased 101 400 of raw materials on credit b Materials requisitions show the following materials used for the month Job 201 Job 202 Total direct materials Indirect materials Total materials used 49 600 25 000 74 600 10 020 84 620 c Time tickets show the following labor used for the month Job 201 40 600 Job 202 14 000 Total direct labor 54 600 Indirect labor 25 600 Total labor used 80 200 d Applied overhead to Job 201 and to Job 202 using a predetermined overhead rate of 80 of direct materials cost e Transferred Job 201 to Finished Goods Inventory f Sold Job 201 for 167 960 on credit g Incurred the following actual other overhead costs for the month Depreciation of factory equipment 33 400 Rent on factory building payable Factory utilities payable Expired factory insurance Total other factory overhead costs 640 940 4 400 39 380 Prepare journal entries to record the transactions reflected in items a through g

Statistics
Statistics4 es The following information is available for ADT Company which produces special order security products and uses a job order costing system Overhead is applied using a predetermined overhead rate of 55 of direct labor cost Inventories Raw materials Work in process Finished goods Beginning of period 49 000 9 600 65 000 Cost incurred for the period Raw materials purchases Factory payroll Factory overhead actual Indirect materials used Indirect labor used Other overhead costs 1 Raw materials purchases for cash 2 Direct materials used 3 Indirect materials used End of Period 58 000 18 300 34 900 172 000 250 000 12 000 57 500 119 500 Prepare journal entries for the above transactions for the period Check

Statistics
ProbabilitySuppose you are playing a game with 5 fair dice In the game you roll the 5 dice and record the sum on the dice There are two strategies for winning that you must choose between Strategy 1 You win if you roll any sum between 5 and 10 inclusive meaning including the 5 and the 10 or any sum between 25 and 30 inclusive meaning including the 25 and the 30 Strategy 2 You win if you roll a sum of 17 18 or 19 In order to choose your winning strategy simulate the rolls of the dice First roll the 5 fair dice 1000 times and store the results in C1 C5 Next calculate the sum on the fair dice using Row Statistics to sum C1 C5 and store the results in C6 Create a Histogram of the sums in C6 and save the graph as Fig1 png in your preferred local folder Using Fig1 png answer which one of the following statement is true OI The histogram of the sum of the fair dice is skewed to the right II The histogram of the sum of the fair dice is roughly symmetric III The histogram of the sum of the fair dice is skewed to the left OV None of the above
Statistics
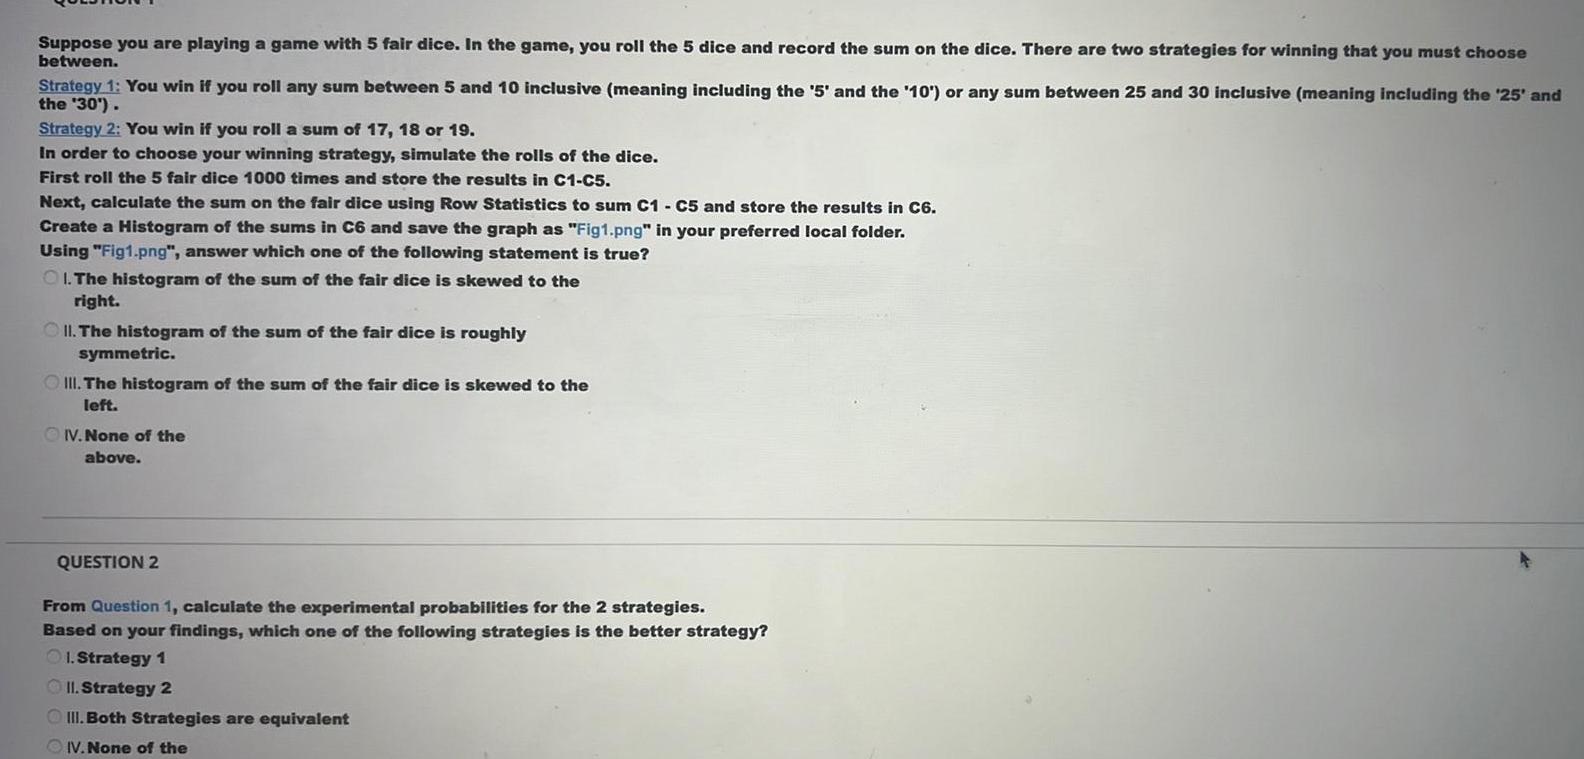
ProbabilitySuppose you are playing a game with 5 fair dice In the game you roll the 5 dice and record the sum on the dice There are two strategies for winning that you must choose between Strategy 1 You win if you roll any sum between 5 and 10 inclusive meaning including the 5 and the 10 or any sum between 25 and 30 inclusive meaning including the 25 and the 30 Strategy 2 You win if you roll a sum of 17 18 or 19 In order to choose your winning strategy simulate the rolls of the dice First roll the 5 fair dice 1000 times and store the results in C1 C5 Next calculate the sum on the fair dice using Row Statistics to sum C1 C5 and store the results in C6 Create a Histogram of the sums in C6 and save the graph as Fig1 png in your preferred local folder Using Fig1 png answer which one of the following statement is true OI The histogram of the sum of the fair dice is skewed to the right II The histogram of the sum of the fair dice is roughly symmetric III The histogram of the sum of the fair dice is skewed to the left IV None of the above QUESTION 2 From Question 1 calculate the experimental probabilities for the 2 strategies Based on your findings which one of the following strategies is the better strategy 1 Strategy 1 II Strategy 2 III Both Strategies are equivalent IV None of the

Statistics
StatisticsSuppose you are playing a second game with a set of 5 loaded dice The dice are loaded such that 1 and 2 each occur with probability 0 40 3 4 5 and 6 each occur with probability 0 05 Set up a discrete probability model in Minitab for this example and store the model in C1 and C2 In the game you roll the 5 loaded dice and record the sum on the dice There are two strategies for winning that you must choose between Strategy 1 You win if you roll any sum between 5 and 10 inclusive Strategy 2 You win if you roll a sum of 17 18 or 19 In order to choose your winning strategy simulate the rolls of the dice First roll the 5 loaded dice 1500 times and store the results in C3 C7 Next calculate the sum on the loaded dice using Row Statistics to sum C3 C7 and store the results in C8 Create a Histogram of the sums in C8 and save the graph as Fig2 png in your preferred local folder Using Fig2 png answer which one of the following statement is true O1 The histogram of the sum of these loaded dice is skewed to the right II The histogram of the sum of these loaded dice is roughly symmetric III The histogram of the sum of these loaded dice is skewed to the left IV None of the above

Statistics
StatisticsPopulation standard deviation 23 N 49 X 14 a Set up a 98 C I E for population Mean b Set up a 95 C I E for population Proportion c Between what two values around the mean 99 of observations fall d Between what two values around the mean 98 of observations fall e Above what value only 2 of observations fall f If s 23 do parts a and b

Statistics
Statistics2 Does an average box of cereal contain 350 grams of cereal A random sample of 25 boxes showed mean 320 The company has specified s 12 grams and the distribution to be normal Test at the a 0 05 HO Formula Test H1

Statistics
StatisticsIn 2015 as part of the General Social Survey 1321 randomly selected American adults responded to this question Some countries are doing more to protect the environment than other countries In general do you think that America is doing more than enough about the right amount or too little Of the respondents 425 replied that America is doing about the right amount Find the 99 confidence interval for the proportion of all American adults who feel that America is doing about the right amount to protect the environment Use Z 2 576 Use the unrounded values in Excel to find the answers to 2 3 and 4 and the sample proportion of all American adults who feel that America is doing about the right amount to protect the environment 1 Fill in the blanks by selecting one option from each menu aby Part 1 3 points aby Part 2 3 points aby Part 3 3 points aby Part 4 3 points aby Part 5 3 points 15 points 2 The standard error for sample proportion has a value of 3 The margin of error has a value of C 4 Find the 99 confidence interval for all American adults who feel that America is doing about the right amount to protect the environment

Statistics
Statistics1 Does an average box of cereal contain 348 grams of cereal A random sample of 36 boxes showed mean 340 The company has specified standard deviation to be 12 grams and the distribution to be normal Test at the a 0 01 HO Formula Test H1
Statistics
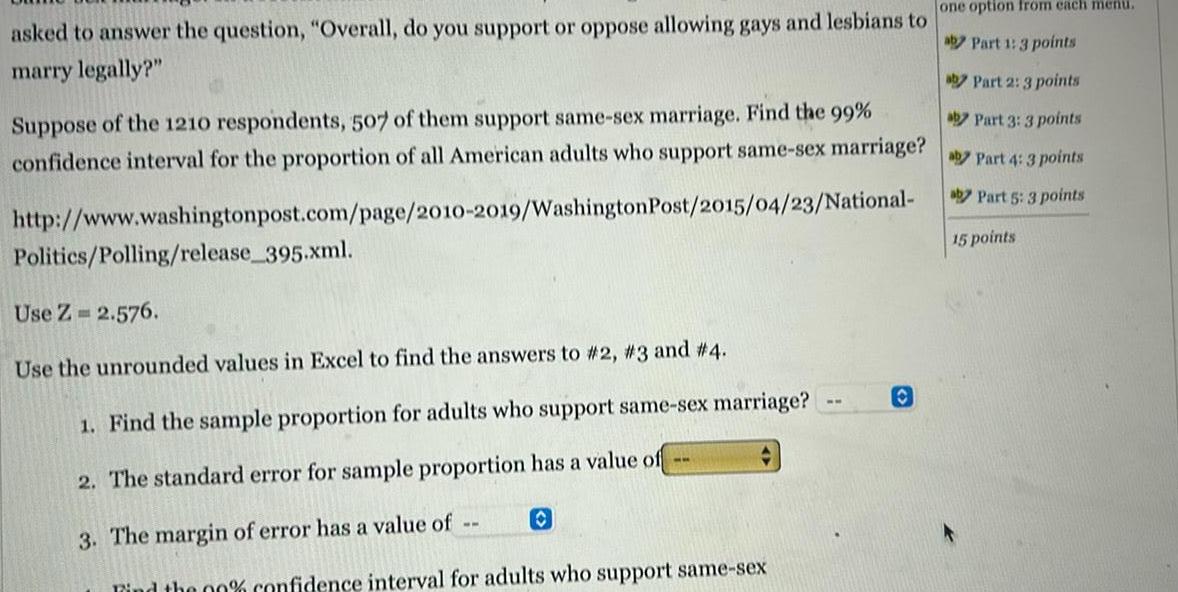
Probabilityasked to answer the question Overall do you support or oppose allowing gays and lesbians to marry legally aby Part 2 3 points aby Part 3 3 points Suppose of the 1210 respondents 507 of them support same sex marriage Find the 99 confidence interval for the proportion of all American adults who support same sex marriage Part 4 3 points aby Part 5 3 points http www washingtonpost com page 2010 2019 Washington Post 2015 04 23 National 15 points Politics Polling release 395 xml Use Z 2 576 Use the unrounded values in Excel to find the answers to 2 3 and 4 1 Find the sample proportion for adults who support same sex marriage 2 The standard error for sample proportion has a value of 3 The margin of error has a value of O Find the 00 confidence interval for adults who support same sex ww one option from each menu aby Part 1 3 points O

Statistics
Statistics1 A report estimated that 64 American adults ages 20 74 were overweight Use this estimate as the population proportion If 144 subjects are selected at random from the population what is the probability that 70 or more would be found to be overweight

Statistics
Statistics2 Does an average box of cereal contain 350 grams of cereal A random sample of 25 boxes showed mean 320 The company has specified s 12 grams and the distribution to be normal Test at the a 0 05 HO Formula Test H1

Statistics
Statistics1 Does an average box of cereal contain 348 grams of cereal A random sample of 36 boxes showed mean 340 The company has specified standard deviation to be 12 grams and the distribution to be normal Test at the a 0 01 HO Formula Test H1
Statistics
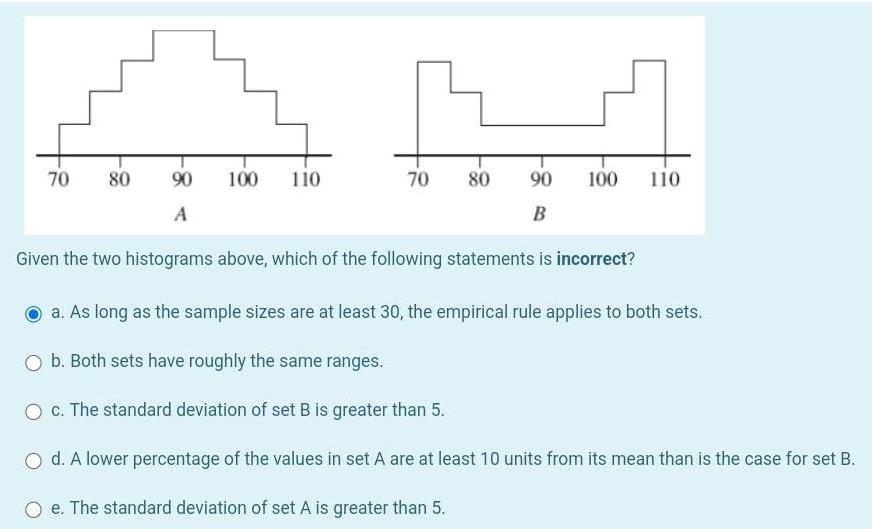
Probability70 80 90 100 A 110 70 80 90 B 100 110 Given the two histograms above which of the following statements is incorrect a As long as the sample sizes are at least 30 the empirical rule applies to both sets b Both sets have roughly the same ranges O c The standard deviation of set B is greater than 5 O d A lower percentage of the values in set A are at least 10 units from its mean than is the case for set B O e The standard deviation of set A is greater than 5
Statistics
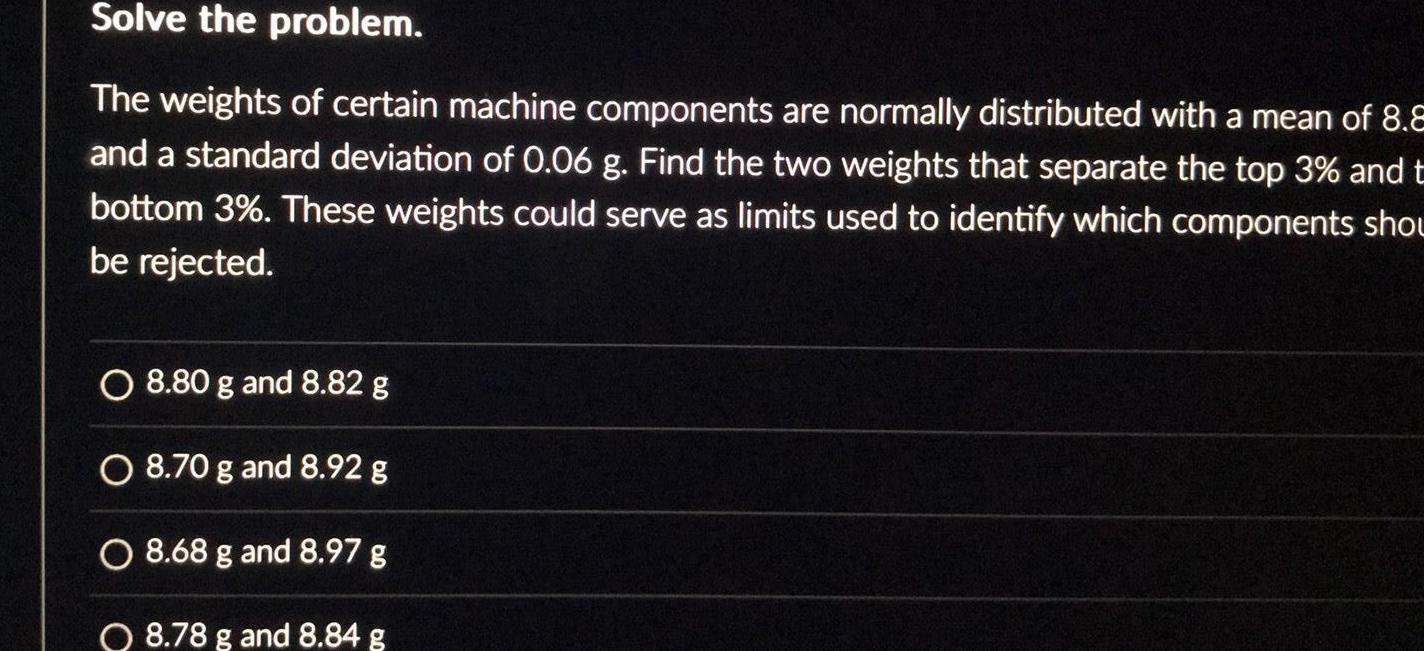
ProbabilitySolve the problem The weights of certain machine components are normally distributed with a mean of 8 8 and a standard deviation of 0 06 g Find the two weights that separate the top 3 and t bottom 3 These weights could serve as limits used to identify which components shou be rejected O 8 80 g and 8 82 g O 8 70 g and 8 92 g O 8 68 g and 8 97 g O 8 78 g and 8 84 g

Statistics
StatisticsDetermine if the outcome is unusual Consider as unusual any result that differs from the mean by more than 2 standard deviations That is unusual values are either less than u 20 or greater than 20 The Acme Candy Company claims that 8 of the jawbreakers it produces actually result in a broken jaw Suppose 9571 persons are selected at random from those who have eaten a jawbreaker produced at Acme Candy Company Would it be unusual for this sample of 9571 to contain 798 persons with broken jaws O Yes O No

Statistics
Statisticsle problem A manufacturer wishes to estimate the proportion of washing machines leaving the factory that is defective How large a sample should she check in order to be 93 percent confident that the true proportion is estimated to within 0 013 O 4846 O 4847 01

Statistics
StatisticsSolve the problem The annual precipitation amounts in a certain mountain range are normally distributed wit mean of 75 inches and a standard deviation of 16 inches What is the probability that the mean annual precipitation during 64 randomly picked years will be less than 77 8 inches O 0 9192 O 0 5808 O 0 4192
Statistics
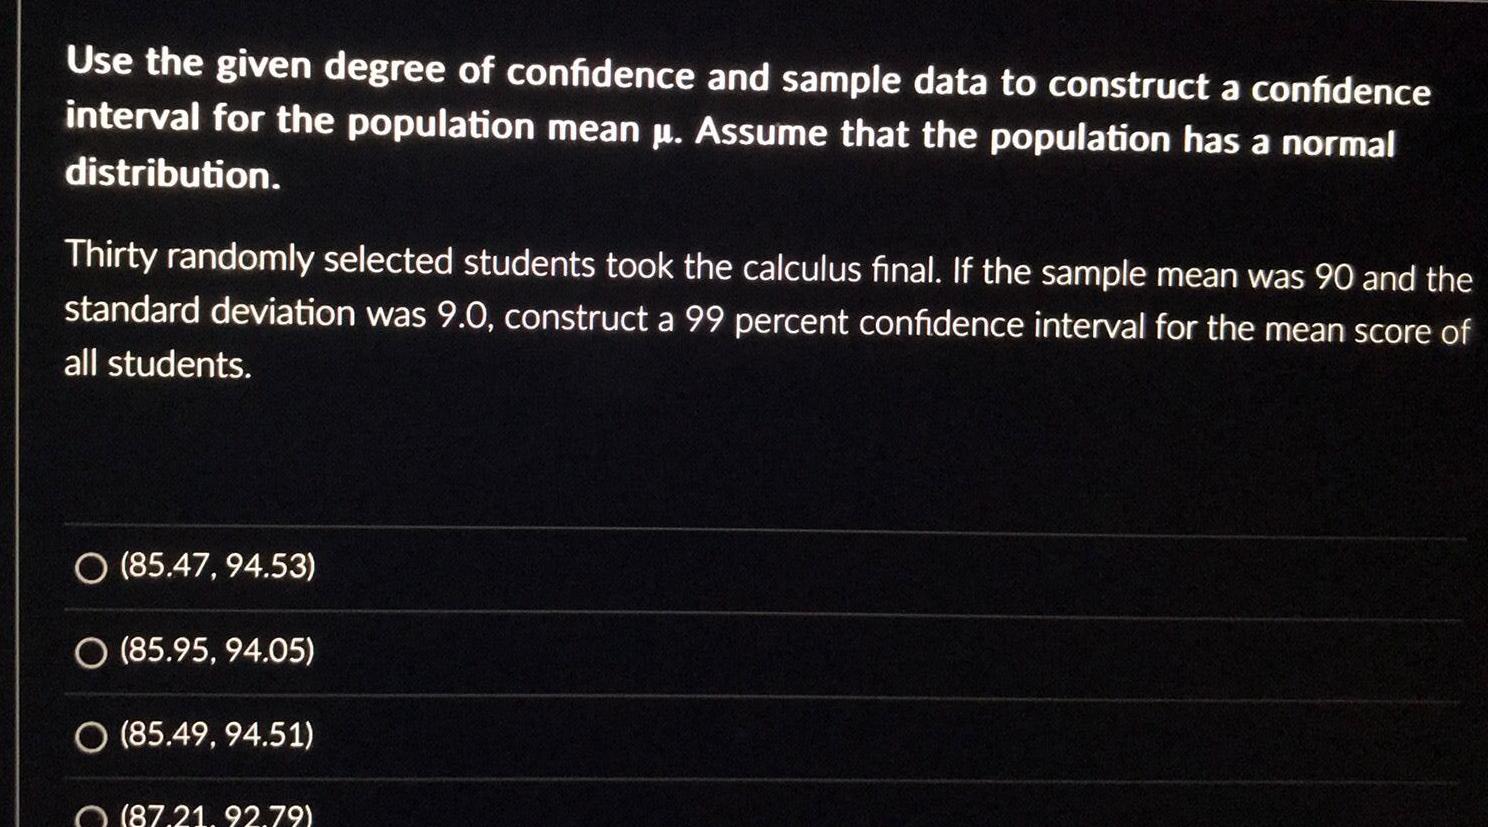
ProbabilityUse the given degree of confidence and sample data to construct a confidence interval for the population mean Assume that the population has a normal distribution Thirty randomly selected students took the calculus final If the sample mean was 90 and the standard deviation was 9 0 construct a 99 percent confidence interval for the mean score of all students O 85 47 94 53 O 85 95 94 05 O 85 49 94 51 87 21 92 79
Statistics
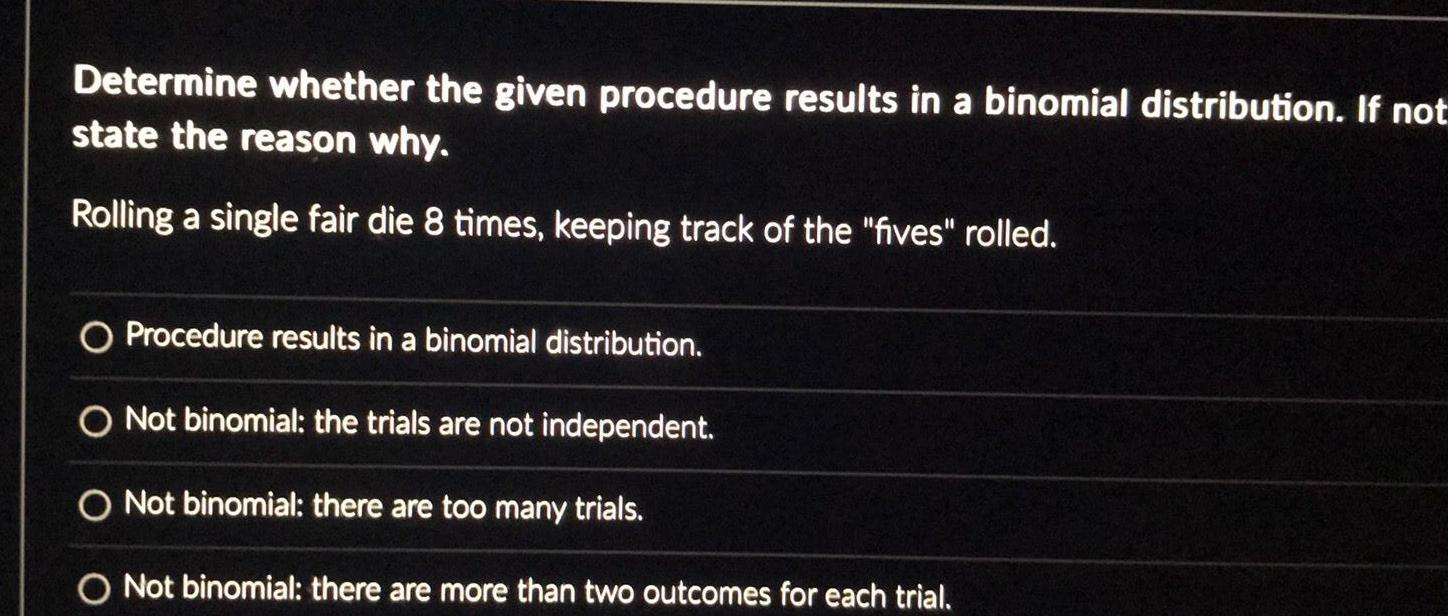
ProbabilityDetermine whether the given procedure results in a binomial distribution If not state the reason why Rolling a single fair die 8 times keeping track of the fives rolled O Procedure results in a binomial distribution O Not binomial the trials are not independent O Not binomial there are too many trials O Not binomial there are more than two outcomes for each trial

Statistics
StatisticsUse the given degree of confidence and sample data to construct a confidence interval for the population mean A laboratory tested 87 chicken eggs and found that the mean amount of cholesterol was 235 milligrams with s 11 1 milligrams Construct a 95 percent confidence interval for the true mean cholesterol content of all such eggs O 232 236 O 234 238 O 232 237 O 233 237

Statistics
StatisticsFind the margin of error for the 95 confidence interval used to estimate the population proportion In a sample of 185 observations there were 75 positive outcomes O 0 0707 O 0 00255 O 0 124

Statistics
StatisticsUse the given values of n and p to find the minimum usual value 2o and the maximur usual value 20 n 95 p 0 21 O Minimum 11 57 maximum 51 47 O Minimum 12 01 maximum 27 89 O Minimum 27 89 maximum 12 01 O Minimum 15 98 maximum 23 92
Statistics
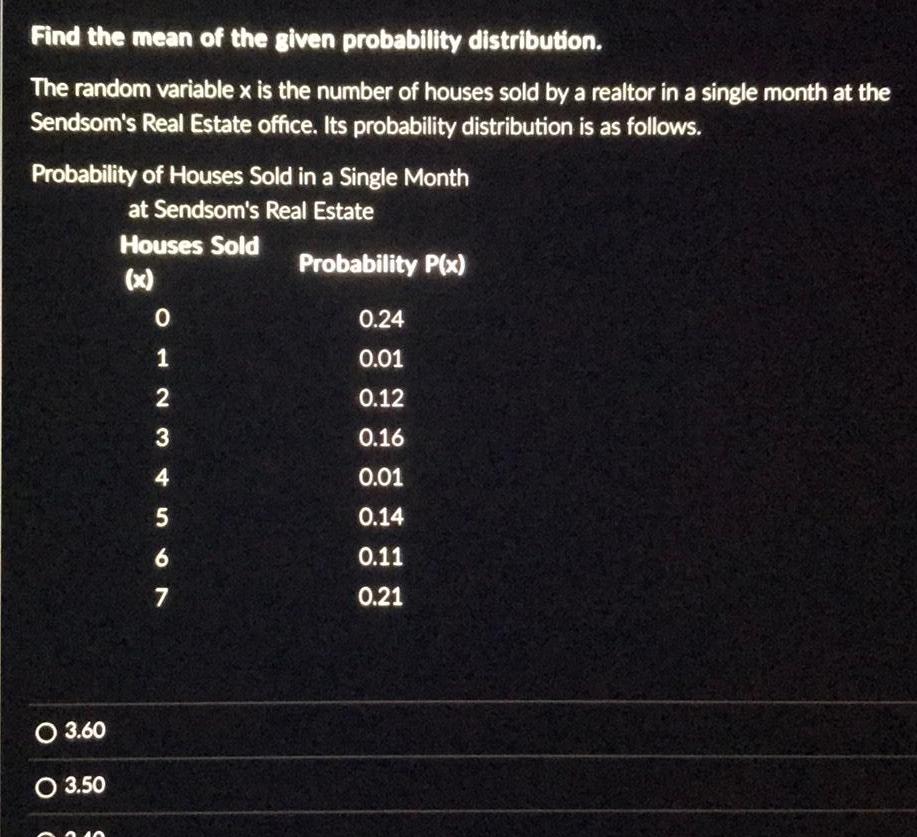
ProbabilityFind the mean of the given probability distribution The random variable x is the number of houses sold by a realtor in a single month at the Sendsom s Real Estate office Its probability distribution is as follows Probability of Houses Sold in a Single Month at Sendsom s Real Estate Houses Sold x O 3 60 O 3 50 012 3 4 567 Probability P x 0 24 0 01 0 12 0 16 0 01 0 14 0 11 0 21

Statistics
Statisticsthe question Suppose that computer literacy among people ages 40 and older is being studied and that the accompanying tables describes the probability distribution for four randomly selected people where x is the number that are computer literate Is it unusual to find four compute literates among four randomly selected people Probability of Being Computer Literate Amongst Four People 40 or Older O No XOL 234 0 1 P x 0 16 0 25 0 36 0 15 0 08

Statistics
StatisticsFind the critical values X and X for the given level of confidence and sample size Round your answer to 2 decimal places a 90 confidence n 20 xt Xv b 99 confidence n 14 x XU c 95 confidence n 25 x 2 Xi
Statistics
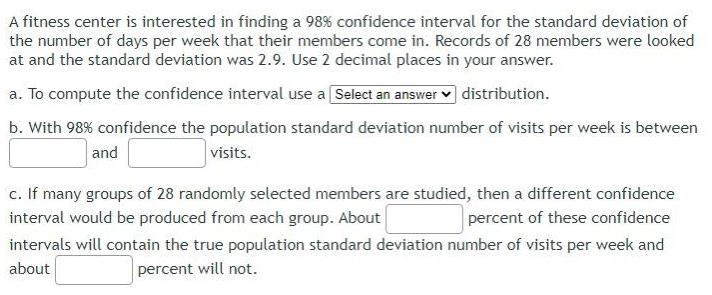
ProbabilityA fitness center is interested in finding a 98 confidence interval for the standard deviation of the number of days per week that their members come in Records of 28 members were looked at and the standard deviation was 2 9 Use 2 decimal places in your answer a To compute the confidence interval use a Select an answer distribution b With 98 confidence the population standard deviation number of visits per week is between visits and c If many groups of 28 randomly selected members are studied then a different confidence interval would be produced from each group About percent of these confidence intervals will contain the true population standard deviation number of visits per week and about percent will not

Statistics
StatisticsIt is commonly believed that the mean body temperature of a healthy adult is 98 6 F You are not entirely convinced You believe that it is not 98 6 F a If you going to test this claim at the 0 01 significance level what would be your null and alternative hypotheses Ho

Statistics
StatisticsThe table below gives the number of elementary chool children in 16 school districts in a particular region a Construct a cumulative frequency distribution b Construct a cumulative relative frequency distribution c Draw a frequency polygon d Draw a relative frequency ogive Number of Elementary School Students in 16 School Districts 4759 2400 4228 2500 1260 3305 3110 4800 2217 1050 3278 4396 4957 3640 2183 4400 C 3000 3999 4000 4999 b Complete the cumulative relative frequency distribution Students in a District 1000 1999 2000 2999 3000 3999 4000 4999 Round to three decimal places as needed c Which of these is the frequency polygon inim 6000 O C in 6000 Students O A Cumulative Relative Frequency Students 999 O C d Which of these is the relative frequency ogive Students KIL 5999 O D Q O B el Freq 999 OD Students ATT Students 6000 5999 Students 6000 Q Q

Statistics
StatisticsDetermine whether the study depicts an observational study or an experiment Sixty patients with vision loss are divided into two groups One group is treated with experimental surgery The other is not After one month both groups are questioned about their ability to read Is the study an observational study or an experiment OA The study is an experiment because the study examines individuals in a sample but does not try to influence the variable of interest OB The study is an experiment because the researchers control one variable to determine the effect on the response variable OC The study is an observational study because the study examines individuals in a sample but does not try to influence the response variable OD The study is an observational study because the researchers control one variable to determine the effect on the response variable
Statistics
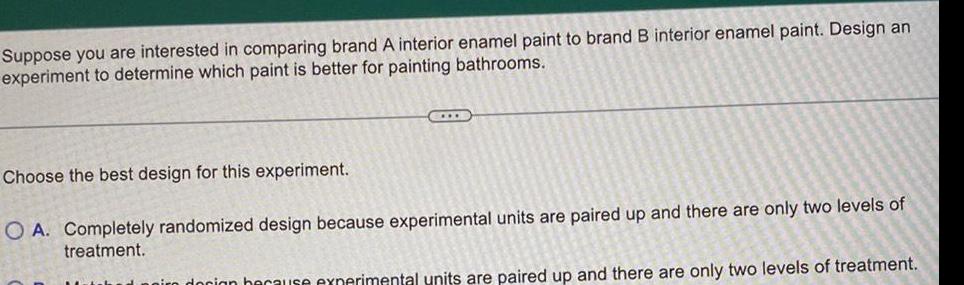
ProbabilitySuppose you are interested in comparing brand A interior enamel paint to brand B interior enamel paint Design an experiment to determine which paint is better for painting bathrooms CIDE Choose the best design for this experiment O A Completely randomized design because experimental units are paired up and there are only two levels of treatment docion because experimental units are paired up and there are only two levels of treatment

Statistics
StatisticsFill in the blank to complete the statement below A sample is obtained by dividing the population into homogenous groups and randomly selecting individuals from each group A inc cluster stratified sample is obtained by dividing the population into homogenous groups and randomly selecting convenience systematic