Statistics Questions
The best high school and college tutors are just a click away, 24×7! Pick a subject, ask a question, and get a detailed, handwritten solution personalized for you in minutes. We cover Math, Physics, Chemistry & Biology.

Statistics
StatisticsFind the area under the standard normal curve to the left of z 2 11 Round your answer to four decimal places if necessary Answer 2 Points K Keyboard S If you would like to look up the value in a table select the table you want to view then either click the cell at the intersection of the row and colu use the arrow keys to find the appropriate cell in the table and select it using the Space key Normal Table to z

Statistics
StatisticsConsider the accompanying data and scatterplot of the data from a small bookstore Find the correlation coefficient for the given data An earlier analysis found that the data had a moderately strong positive linear association Describe how this value confirms this relationship Think carefully about all the things you know from thi alue Click the icon to view the bookstore data and scatterplot pr 0 Round to three decimal pl Sales People and Sales Number of Sales People Working 4 6 9 10 10 13 15 17 21 x 10 6 SD x 6 10 Sales in 1000 9 10 14 14 22222 18 21 20 23 26 x 17 7 SD x 5 72 Q Q 3 D X

Statistics
StatisticsFast food is often considered unhealthy because much of it is high in both fat and sodium But are the two related Here are the fat and sodium contents of several brands of burgers Analyze the association between fat content and sodium using correlation and scatterplots 19 Fat g Sodium mg 924 Sodium mg Make a scatterplot for the data Choose the correct answer below OA O B 1700 700 10 29 35 1496 1317 Fat g 39 41 41 45 850 1172 930 1267 What is the correlation coefficient for the data 7 Round to three decimal places as needed Sodium mg 1700 700 10 Fat g Q Sodium mg 1700 700 10 Fat g Q OD Sodium mg 1700 700 10 Fat g Q

Statistics
StatisticsAn English professor assigns letter grades on a test according to the following scheme A Top 8 of scores B Scores below the top 8 and above the bottom 63 C Scores below the top 37 and above the bottom 15 D Scores below the top 85 and above the bottom 7 F Bottom 7 of scores Scores on the test are normally distributed with a mean of 77 and a standard deviation of 9 4 Find the minimum score required for an A gr Round your answer to the nearest whole number if necessary Answer 2 Points A Keyboard S If you would like to look up the value in a table select the table you want to view then either click the cell at the intersection of the row and c or use the arrow keys to find the appropriate cell in the table and select it using the Space key Note Selecting a cell will return the value asso with the column and row headers for that cell

Statistics
StatisticsCalculate the standard score of the given X value X 90 4 where Round the standard score to two decimal places Answer 2 Points 88 4 and 6 90 4 and indicate on the curve where z will be located The point can be moved by dragging or using the arrow keys Select the Reset button to reset the point 0 Z 0 1 Reset Keypad Keyboard Shortcu

Statistics
Statistics2 pts In a marathon is the finishing time more impressive if it is in the 10th percentile or in the 90th ercentile Explain why

Statistics
StatisticsUse the z score formula z Answer 2 Points x and the information below to find the value of o Round your answer to one decimal place if necessary O z 2 70 x 18 92 and 28 37 Keyp Keyboard Shor

Statistics
StatisticsUse the following table below to answer the questions on this assignment The total number of points scored in the Superbowl for the years 2001 2022 is below 74 51 45 34 69 50 43 31 65 48 38 31 62 46 37 16 1 5 pts Using you calculator CODAP Excel or another piece of software find the 5 number summary the mean x and standard deviation s for the data above Min Q1 Med 61 56 52 51 23 hy seperate questions Max

Statistics
Statistics6 pts Looking at the two Box Plots below which has a larger Range Which one has a larger IQR Justify your response show your work 39 46 5 42 Prime Ministers 54 Presidents 51 55 59 5 50 63 60 Age when elected 74 78 Range prime ministers range 74 39 35 IQR prime ministers IQR 63 46 5 16 5 I presidents range 78 42 36 I I presidents IQR 59 5 51 8 5 I I Presidents hold the larger range I I Prime Ministers hold the large IQR Using your answers above write a sentence or two about the distribution specifically the differences between the spread of the data between the two sets

Statistics
ProbabilityA hair salon surveyed 360 customers 100 females and 260 males to see if they are satisfied with the service The result is summarized in the following table Satisfied Not Satisfied Total Female 71 Male 219 Total 290 29 41 70 100 260 360 Type numbers in the boxes Part 1 10 points aby Part 2 10 points aby Part 3 10 points 30 points 1 If a customer is randomly selected from these 360 people the probability that he she is satisfied is Please round your answer to two decimal places 2 If we know the selected customer is a female then what is the probability that she is satisfied Please round your answer to two decimal positions P satisfied female 3 How about the probability that a randomly selected customer is a female if we know that the person is satisfied Please round your answer to two decimal positions

Statistics
ProbabilityThe probabilities for the amount that can be won on a lottery game are given in the table below Type numbers in the boxes Find the missing probability X 10 points Amount o 1 23 Probability 0 5 0 27 X 0 04 3 0 01

Statistics
Statistics4 4 pts Looking at the image graph below which was used in an actual presentation by a member of the US house of representatives in 2015 write a brief analysis about how the chart is misleading Your analysis should include at least 2 3 complete sentences for full points PLANNED PARENTHOOD FEDERATION OF AMERICA ABORTIONS UP LIFE SAVING PROCEDURES DOWN 2 007 371 IN 2006 289 750 IN 2006 CANCER SCREENING PREVENTION SERVICES ABORTIONS 327 000 IN 2013 935 573 IN 2013

Statistics
Statistics6 pts The average age of a US president when elected is 55 50 years with a standard deviation of 7 27 years The average age of a Canadian Prime Minister when elected is 55 04 years with a standard deviation of 9 69 years When Obama was elected he was 47 46 years old and when Justin Trudeau was elected he was 43 85 years old Which age is more unusual for their respective position Be sure you justify your response mathematically

Statistics
StatisticsOn a recent quiz the class mean was 72 with a standard deviation of 3 Calculate the z score to 2 decima places for a person who received score of 81 Z score Is this unusual Further than 2 standard deviations away from the mean Unusual

Statistics
StatisticsThe quantitative data was gathered by taking a random sample Calculate the standard deviation Round to one decimal place X 24 23 26

Statistics
StatisticsHere is a sample data set n 48 that is nearly normal 55 56 4 61 3 62 6 62 6 63 8 66 66 7 67 7 68 68 6 70 1 70 3 70 3 70 8 71 3 71 7 71 9 71 9 72 1 72 6 74 74 2 75 6 76 2 76 2 76 8 77 79 2 79 7 80 4 82 82 3 84 4 84 4 86 8 87 7 88 2 88 2 90 91 4 93 1 380 66 4 70 6 73 77 85 3 93 6 How many outliers are in this data set if we define an outlier to be any piece of data more than 2 star deviations away from the mean Note This means you will need to find the mean and standard deviat this data

Statistics
StatisticsThe following are the amounts of total fat in grams from a sample of different kinds of sweet treats available at the local donut shop 15 21 18 17 19 21 22 15 23 15 22 20 22 22 20 23 16 25 18 21 a What is the range for this data set grams 22 b What is the standard deviation for this data set Round your answer to the nearest tenth if necessary

Statistics
StatisticsIn a neighborhood donut shop one type of donut has 540 calories four types of donuts have 530 calories two types of donuts have 410 calories two types of donuts have 560 calories and three types of donuts have 460 calories Find the range 0 Find the sample standard deviation Round your answer to the nearest tenth if necessary calories

Statistics
StatisticsUsing technology find the range and standard deviation Round to two decimals places The table below gives the number of hours spent watching TV last week by a sample of 24 childre 37 68 46 87 32 69 45 73 30 85 56 24 Range 89 79 64 68 67 26 41 32 41 48 96 19

Statistics
StatisticsCalculate the standard deviation of the sample quantitative data shown to two decimal places 9 1 21 3 21 2 12 6 21 1 27

Statistics
StatisticsCalculate the sample standard deviation of the quantitative data shown Round to two decimal place X 14 27 24 13 20 23

Statistics
StatisticsMaria ran an experiment to determine the optimal conditions for growing artichokes The data below display the weights of the artichokes she grew measured in grams 107 7 115 4 139 5 97 139 5 123 6 139 5 118 2 110 9 102 6 What is the mean weight of the artichokes mean What is the median weight of the artichokes median What is the mode weight of the artichokes

Statistics
StatisticsHere is a sample data set Frequency 240 4 293 299 2 336 3 369 7 377 5 405 2 405 2 415 7 420 5 421 1 425 7 430 2 451 2 453 462 4 465 6 467 467 467 9 468 5 469 4 469 5 471 2 473 6 477 3 477 4 482 3 484 485 7 487 6 487 6 487 6 490 2 523 4 530 536 541 3 541 7 549 8 551 3 556 576 1 592 5 635 9 20 15 249 1 272 4 347 4 358 9 10 277 3 365 405 2 407 9 442 1 200250300350400450500550600650 length cm Find the first quartile for this data set Q 405 2 Q This is not a decimal or integer valu Find the third quartile for this data set Q3 487 6 Find the interquartile range for this data set

Statistics
StatisticsThe five number summary of a dataset was calculated to be 0 4 9 17 19 a An observation is considered an outlier if it is below b An observation is considered an outlier if it is above

Statistics
StatisticsAlan Baker interested in the number of chairs per household people have Please finish the calculation below using data he collected here Number of Chairs 1 2 3 4 5 6 The mean T The median Frequency 11 11 6 10 9 12 The mode 11 Enter DNF if there is no model chairs Please show your answer to 1 decimal place chairs chairs Please separate your answers by in bimodal situation
Statistics
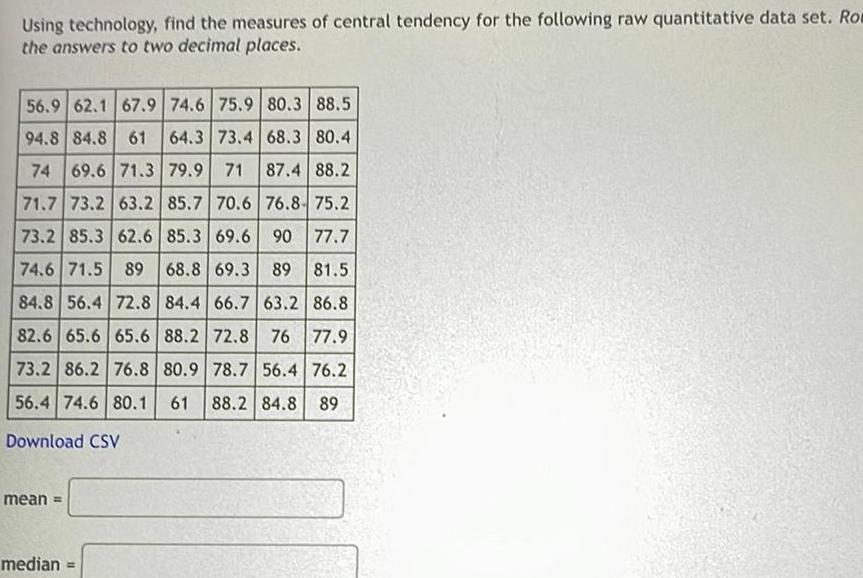
StatisticsUsing technology find the measures of central tendency for the following raw quantitative data set Rom the answers to two decimal places 56 9 62 1 67 9 74 6 75 9 80 3 88 5 94 8 84 8 61 64 3 73 4 68 3 80 4 74 69 6 71 3 79 9 71 87 4 88 2 71 7 73 2 63 2 85 7 70 6 76 8 75 2 73 2 85 3 62 6 85 3 69 6 90 77 7 74 6 71 5 89 68 8 69 3 89 81 5 84 8 56 4 72 8 84 4 66 7 63 2 86 8 82 6 65 6 65 6 88 2 72 8 76 77 9 73 2 86 2 76 8 80 9 78 7 56 4 76 2 56 4 74 6 80 1 61 88 2 84 8 89 Download CSV mean median

Statistics
StatisticsFind the mean for the recorded exam scores in points from a statistics exam Round the answer to one decimal place 65 17 91 36 56 68 40 43 55 54 52 83 12 3 88

Statistics
StatisticsThe time spent waiting in the line is approximately normally distributed The mean waiting time is 6 minutes and the variance of the waiting time is 9 Find the probability that a person will wait for more than 9 minutes Round your answer to four decimal places Answer Normal Table to z If you would like to look up the value in a table select the table you want to view then either click the cell at the intersection of the row and column or use the arrow keys to find the appropriate cell in the table and select it using the Space key ITSH Tables Keypad Keyboard Shortcuts to 7

Statistics
StatisticsHere is a sample set of quantitative data 215 8 222 2 228 7 250 6 265 6 272 7 273 4 279 8 310 1 315 4 319 4 336 3 340 7 340 7 340 7 348 348 2 349 9 350 7 351 352 8 353 353 6 355 3 355 5 356 8 359 1 359 1 360 9 365 1 377 4 381 8 383 385 3 385 6 386 7 395 400 8 408 2 414 2 414 2 414 2 415 7 418 9 423 7 423 9 425 429 1 441 3 442 1 443 9 449 4 451 458 3 Frequency 18 16 14 12 10 8 6 4 2 200 250 300 350 400 450 500 Q length cm a Find the minimum for this data set minimum b Find the first quartile for this data set Q c Find the median for this data set Median d Find the third quartile for this data set Q3 e Find the maximum for this data set maximum

Statistics
ProbabilityTo plan for retirement Justin deposits 295 each quarter in an annuity that pays 7 interest compounded quarterly Payments will be made at the end of each quarter Find the total value of the annuity in 28 years Do not round any intermediate computations and round your final answer to the nearest cent If necessary refer to the list of financial formulas
Statistics
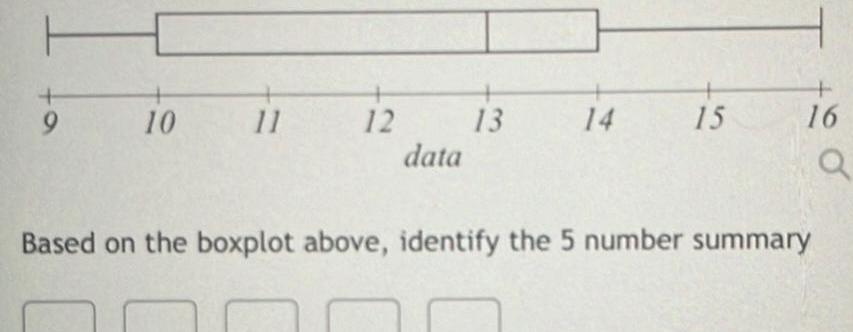
Statisticst 9 10 11 12 data 13 14 15 16 Based on the boxplot above identify the 5 number summary

Statistics
StatisticsFind the maximum for this list of numbers 5 98 13 51 25 31 33 81 47 23 59 96 37 84 16

Statistics
Statistics10 11 12 13 14 15 16 17 18 P Based on the boxplot above what is the value for the Q1

Statistics
StatisticsFind the minimum for this list of numbers 60 65 47 23 64 88 68 70 74 59 14 4 20 66 28

Statistics
StatisticsThe highway mileage mpg for a sample of 8 different models of a car company can be found below Find the 5 number summary and use it to create a boxplot 17 21 23 27 30 33 35 35 O 17 18 19 20 21 22 23 24 25 26 27 28 29 30 31 32 33 34 35 mpg Q 4 17 18 19 20 21 22 23 24 25 26 27 28 29 30 31 32 33 34 35 mpg 17 18 19 20 21 22 23 24 25 26 27 28 29 30 31 32 33 34 35 a mpg F H 4 O 17 18 19 20 21 22 23 24 25 26 27 28 29 30 31 32 33 34 35 mpg a t H O 17 18 19 20 21 22 23 24 25 26 27 28 29 30 31 32 33 34 35

Statistics
StatisticsFind the first quartile for the given quantitative data 35 47 41 45 19 83 30 50 49 33 89 39 9 48 4

Statistics
StatisticsFind the 5 number summary for the data shown 7 13 22 43 53 72 87 89 9 14 26 52 61 74 88 5 number summary

Statistics
StatisticsHere is a sample data set Frequency 340 343 2 345 4 347 9 358 7 364 8 365 6 369 7 373 5 379 2 384 384 2 389 6 389 6 389 6 391 1 394 394 2 396 4 396 5 398 6 403 403 9 407 7 407 8 410 3 411 7 411 7 411 8 412 5 412 7 415 4 415 6 416 8 417 9 418 1 422 8 426 7 426 8 434 7 434 7 434 7 437 1 441 9 442 1 442 6 444 1 445 4 446 7 447 3 451 6 462 1 474 4 475 3 25 20 15 10 5 300 JOR 350 400 length cm 450 500 Find the first quartile for this data set Q Find the third quartile for this data set Q3 Find the interquartile range for this data set

Statistics
StatisticsThe five number summary of a dataset was found to be minimum 2 Quartile 1 5 Median 8 Quartile 3 14 Maximum 19 An observation will be considered an outlier if it is below An observation will be considered an outlier if it is above

Statistics
StatisticsFind the first and third quartile for the quantitative data Q Q3 X 3 8 4 5 5 4 12 9 17 1 19 1 27 4 27 9 28 2 28 8

Statistics
StatisticsThe five number summary of a dataset is given as 6 7 11 17 19 a An observation is considered an outlier if it is below b An observation is considered an outlier if it is above

Statistics
StatisticsBelow is a sample quantitative data set 360 9 360 9 407 9 404 1 235 2 374 6 275 4 589 231 6 193 5 430 447 4 339 4 383 8 295 9 390 3 424 7 629 1 229 6 470 6 298 5 453 9 407 9 610 2 441 4 639 9 319 4 453 9 451 4 241 2 427 8 494 7 479 6 453 9 434 1 452 3 453 2 434 4 425 1 428 2 425 1 410 8 397 9 207 2 516 1 398 8 231 6 636 9 360 9 545 387 8 432 1 616 1 593 2 a Find the first quartile for this data set Q b Find the third quartile for this data set Q3 c Find the interquartile range for this data set IQR

Statistics
ProbabilityThe following data represents the GPA of a sample of 15 students enrolled in a history clas 3 4 3 9 4 0 2 8 3 5 2 6 3 2 3 6 1 9 2 1 2 0 3 3 2 4 1 8 3 2 a Find the first quartile Do not include the median in the calculations Answer b Find the third quartile Do not include the median in the calculations Answer c Find the mean Round to 2 decimal places

Statistics
StatisticsFind the third quartile for the given quantitative dat 29 43 45 4 53 1 95 61 80 16 90 26 65 54 84

Statistics
StatisticsData was collected for 300 fish from the North Atlantic The length of the fish in cm is summarized in the histogram below Frequency 100 80 60 40 20 100 120 140 160 180 200 220 240 length of fish mm What is the lower class limit for the seventh class lower class limit

Statistics
StatisticsGiven below is a data set 24 32 18 28 25 34 27 33 17 18 22 27 48 42 28 34 14 22 11 22 25 31 16 23 48 16 24 25 24 10 Examine the data above by reviewing the stem and leaf plot Here is the start of the plot What a missing values 1 01466788 2 22234445557788

Statistics
StatisticsData was collected for 236 randomly selected 10 minute intervals For each ten minute interval the number of people entering the atrium of a large mall were recorded The data is summarized in the histogram below 60 40 ET 20 Frequency 220 240 260 280 300 Number of People in 10 min 320 Q What is the class width for this histogram and corresponding GFDT Note Each class contains its lower class limit but not its upper class limit

Statistics
ProbabilityData was collected for a sample of organic snacks The amount of sugar in mg in each snack is summarized in the histogram below Which statement best describes the meaning of one of the bars in the histogram Frequency 10 8 6 4 2 220 224 228 232 236 240 244 248 amount of sugar mg O246 snacks have 1 mg of sugar 1 snacks have about 246 mg of sugar O246 snacks have between 244 and 248 mg of sugar The largest number of snacks have 11 mg of sugar

Statistics
StatisticsData was collected for 277 randomly selected 10 minute intervals For each ten minute interval the number of people entering the atrium of a large mall were recorded The data is summarized in the table below Number of Guests Frequency 80 89 43 90 99 74 100 109 84 110 119 58 120 129 18 What is the class width Class width Hint Remember the class width is NOT the difference bewteen the lower and upper class limits

Statistics
ProbabilityGiven below are data that has approximately normal distribution data data data data 57 28 41 18 44 35 46 67 53 82 47 62 71 23 39 82 54 88 58 04 53 63 41 68 42 3 40 61 39 41 47 99 45 58 78 03 60 83 48 95 65 81 41 29 40 67 51 43 44 44 56 37 45 47 47 72 51 84 58 93 54 24 48 73 63 93 69 49 69 13 62 21 59 45 39 92 60 65 In building a grouped frequency distribution table for this data set how many values are there in the clas 64 99 Include the lower class limit but not the upper class limit