Statistics Questions
The best high school and college tutors are just a click away, 24×7! Pick a subject, ask a question, and get a detailed, handwritten solution personalized for you in minutes. We cover Math, Physics, Chemistry & Biology.

Statistics
StatisticsFind the area under the standard normal curve between the given z values Round your answer to four decimal places if necessary Z 1 72 Z2 1 72 Answer

Statistics
ProbabilityFind the area under the standard O Answer Keypa Keyboard Shortc Normal Table to z Tables If you would like to look up the value in a table select the table you want to view then either click the cell at the intersection of the row and column or use the arrow keys to find the appropriate cell in the table and select it using the Space key

Statistics
StatisticsCalculate the standard score of the given X value X 80 8 where u score to two decimal places Answer 71 5 and o 75 9 and indicate on the curve where z will be located Round the stand The point can be moved by dragging or using the arrow keys Select the Reset button to reset the point 0 Z Reset Tables Ke Keyboard Sh

Statistics
StatisticsDecide which of the following statements are true Answer Tables Keyboard The inflection points for any normal distribution are one standard deviation on either side of the mean O The x axis is a vertical asymptote for all normal distributions The line of symmetry for all normal distributions is x 0 The total area under a normal distribution curve with a standard deviation of 4 is the same as the area under a normal distribution curve with a standard deviati 12

Statistics
Statisticsd A smaller sample of 15 students yielded the following data 5 4 7 6 8 1 6 6 5 3 8 10 10 19 50 Use a class interval of 1 to calculate the mean range and standard deviation and compare to values of the large sample How much do the extreme scores affect the larger sample compared to the smaller sample
Statistics
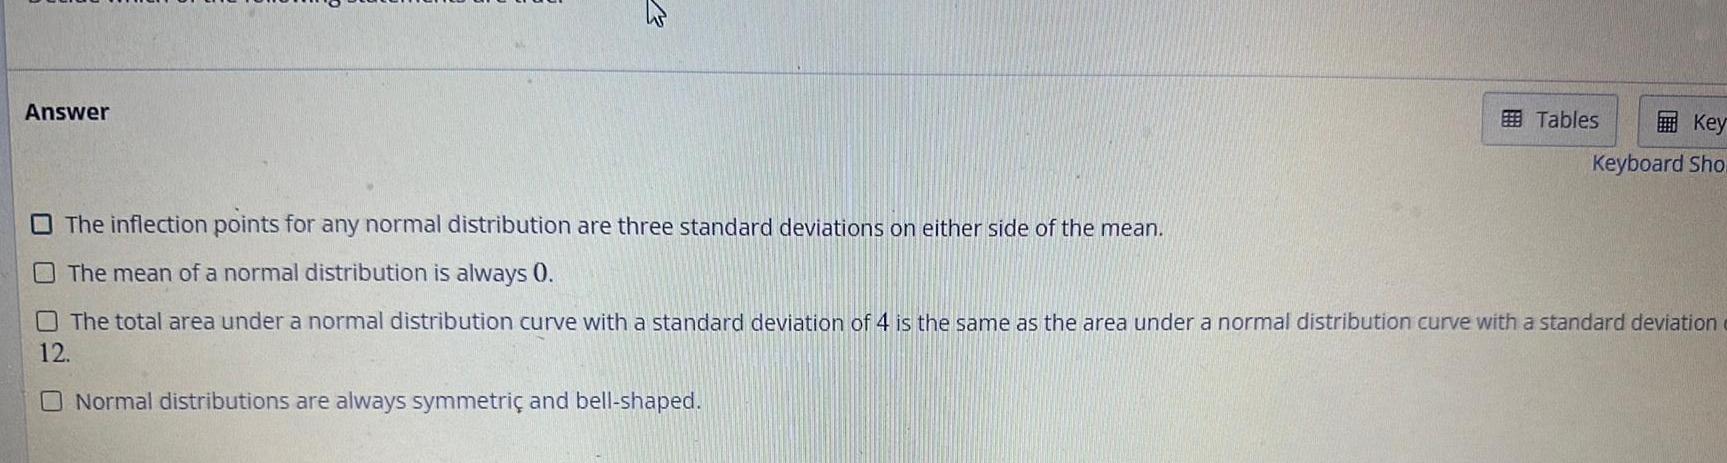
StatisticsAnswer Tables Key Keyboard Sho The inflection points for any normal distribution are three standard deviations on either side of the mean The mean of a normal distribution is always 0 The total area under a normal distribution curve with a standard deviation of 4 is the same as the area under a normal distribution curve with a standard deviation 12 O Normal distributions are always symmetric and bell shaped

Statistics
StatisticsConsider the following data 2 3 1 P X x 0 1 0 2 0 3 Step 3 of 5 Find the standard deviation Round your answer to one decimal place 4 0 2 5 0 2 Copy

Statistics
StatisticsThe Parker family bought a house for 270 000 The value of the real estate in that town will increase by 4 2 each year If values continue at that rate calculate how long it will take until the house is worth 1 000 000 Round your answer to the nearest whole year when the house is worth at least 1 000 000 The house will be worth 1 000 000 after approximately QUESTION 10 You have a 5000 investment that earns 5 5 annual interest Calculate the number years it will take for the investment to quadruple Round your answer to the nearest whole year when the value will be at least quadruple It will take about years years to quadruple the investment

Statistics
StatisticsA small liberal arts college in the Northeast has 250 freshmen Sixty of the freshmen are education majors Suppose twenty five freshmen are randomly selected without replacement Step 2 of 2 Find the standard deviation of the number of education majors in the sample Round your answer to two decimal places if necessary Answer 4 Tables Keypad Keyboard Shortcuts

Statistics
StatisticsGraph the function in a viewing window that will allow you to use a calculator to approximate a the coordinates of the vertex and b the x intercepts y 0 33x 3x 0 18 a The vertex is 2 62 2 45 Type an ordered pair Round the final answer to the nearest hundredth as needed Round all intermediate answers to two decimal places as needed Determine a reasonable viewing rectangle on your graphing utility and use it to graph the quadratic function Choose the correct graph below 20 20 4 by 30 30 5 B 20 20 4 by 30 30 5 20 20 4 by 5 30 5 OD 20 20 4 by 30 30 5 b The x intercept s is are Type an ordered pair Use a comma to separate answers as needed Round each coordinate to the nearest hundredth as needed Q o

Statistics
ProbabilityA town recently dismissed 9 employees in order to meet their new budget reductions The town had 7 employees over 50 years of age and 18 under 50 If the dismissed employees were selected at random what is the probability that exactly 6 employees were over 50 Express your answer as a fraction or a decimal number rounded to four decimal places Answer ter your answer opens in new window Tables Keypad Keyboard Shortcuts

Statistics
ProbabilityThere are 8 black balls and 8 red balls in an urn If 4 balls are drawn without replacement what is the probability that exactly 1 black ball is drawn Express your answer as a fraction or a decimal number rounded to four decimal places Answer ndow Tables Keypad

Statistics
ProbabilityThere are 9 black balls and 6 red balls in an urn If 4 balls are drawn without replacement what is the probability that exactly 2 black balls are drawn Express your answer as a fraction or a decimal number rounded to four decimal places Answer llow to ont jour poor opens in new window Tables Keypad

Statistics
ProbabilityA certain insecticide kills 80 of all insects in laboratory experiments A sample of 6 insects is exposed to the insecticide in a particular experiment What is the probability that exactly one insect will die Round your answer to four decimal places Answer down Tables

Statistics
ProbabilityA certain insecticide kills 60 of all insects in laboratory experiments A sample of 7 insects is exposed to the insecticide in a particular experiment What is the probability that exactly 2 insects will survive Round your answer to four decimal places Answer Tables BEER

Statistics
ProbabilityAssume the random variable X has a binomial distribution with the given probability of obtaining a success Find the following probability given the number of trials and the probability of obtaining a success Round your answer to four decimal places P X3 n 4 p 0 8

Statistics
ProbabilityA researcher wishes to conduct a study of the color preferences of new car buyers Suppose that 50 of this population prefers the color red If 12 buyers are randoml selected what is the probability that exactly 2 buyers would prefer red Round your answer to four decimal places Answer How to enter your answer opens in new window Tables Keypad Keyboard Shortcu

Statistics
StatisticsDetermine whether or not the given procedure results in a binomial distribution If not identify which condition is not met Answer Spinning an American roulette wheel 30 times and recording the number of times the ball lands on red

Statistics
StatisticsFind the expected value E X of the following data Round your answer to one decimal place R 6 P X x 0 1 5 0 2 0 3 4 3 2 0 1 0 3

Statistics
ProbabilityConstruct the discrete probability distribution for the random variable described Express the probabilities as simplified fractions The number of heads in 4 tosses of a coin Answer P X x 0 1 2 3 4 Tab

Statistics
ProbabilityConsider the following data 2 P X x 0 3 Answer X Step 4 of 5 Find the value of P X 5 Round your answer to one decimal place 3 0 2 4 0 1 5 0 2 0 2 B 6


Statistics
Statisticsused to study large areas of forest Based on satellite im ages a forest area in the Amazon basin is divided into 14 types Foresters studied the four most commercially valuable types alluvial climax forests of quality levels 1 2 and 3 and mature secondary forest They divided the area of each type into large parcels chose parcels of each type at random and counted tree species in a 20 by 25 meter rectangle randomly placed within each parcel selected Here is some detail Forest Type Climax 1 Climax 2 Climax 3 Secondary Total Parcels 36 72 31 42 Sample Size 4 7 3 4 age fotostock Superstock

Statistics
StatisticsSoftware Survey A statistical software company is planning on updating Ver sion 8 1 of its software and wants to know what features are most important to users The company s managers have the email addresses of 1100 individuals mostly faculty at universities for whom they have supplied free courtesy copies of Version 8 1 They email these 1100 individuals and ask them to complete a survey online A total of 186 of these individuals complete the survey a What is the population of interest to the software company Do you think the 1100 individuals contacted are representative of the population Explain your reasons b What is the sample From what group is information actually obtained

Statistics
ProbabilityMinority Managers A firm wants to understand the attitudes of its minorit managers toward its system for assessing management performance Following is list of all the firm s managers who are members of minority groups Use the Simp Random Sample applet other software or Table B at line 127 to choose three man agers to be interviewed in detail about the performance appraisal system Modur Adelaja Ahmadiani Barnes Bonds Burke Deis Draguljic Fernandez Fox Gao Gemayel Gunta Huo Ippolito Jiang Jung Mani Morro Rettiganti Rodriguez Sanchez Sgambellone Voiimo

Statistics
StatisticsOff Campus Housing A university s housing and residence office wants to know how much students pay per month for rent in off campus housing The university does not have enough on campus housing for students and this infor mation will be used in a brochure about student housing They obtain a list of the 12 304 students who live in off campus housing and have not yet graduated and mail a questionnaire to 200 students selected at random Only 78 question airres are returned a What is the population in this study Be careful about what group do they want information b What is the sample Be careful from what group do they actually obtain information

Statistics
StatisticsAirport Shuttle Blue Ribbon taxis offers shuttle service to the nearest airport You look up the online reviews for Blue Ribbon taxis and find that there are 17 reviews six of which report that the taxi never showed up Is this a biased sampling method for obtaining customer opinion on the taxi service If so what is the likely direction of bias Explain your reasoning carefully

Statistics
Statistics7 Racial profiling and traffic stops The Denver Police De partment wants to know if Hispanic residents of Denver believe that the police use racial profiling when making traffic stops A sociologist prepares several questions about the police The police department chooses an SRS of 200 mailing addresses in predominantly Hispanic neighbor hoods and sends a uniformed Hispanic police officer to each address to ask the questions of an adult living there a What are the population and the sample

Statistics
StatisticsPaying taxes In April 2016 a Gallup Poll asked two questions about the amount one pays in federal income 24 Here are the two questions taxes Question A Do you regard the income tax which you will have to pay this year as fair Question B Do you consider the amount of federal income tax you have to pay as too high about right or too low

Statistics
Statistics9 Retweeters Twitter and Compete a marketing services company conducted a survey to investigate some of the characteristics of those who retweet reposting of some one else s tweet Among other findings it was found that Twitter users who retweet are demographically similar to those who don t use Twitter more often dur ing the day and are more likely to use Twitter on a mo bile phone Here is the methodology section contained with the survey results The findings are based on data from surveys fielded in the United States during 2012 Twitter and Compete worked together to build a ques tionnaire that asked respondents about their propensity to use Twitter and other services as well as the when where how and why of their usage patterns Compete interviewed 655 Internet users in the U S for this study 30 a Explain in simple language why it is important to know how the sample was selected when drawing conclusions about a survey b Do you feel the methodology section adequately ex why

Statistics
Statistics13 A Survey of 100 000 Physicians In 2010 the Physicians Foundation con ducted a survey of physicians attitude about health care reform calling the re port a survey of 100 000 physicians The survey was sent to 100 000 randomly selected physicians practicing in the United States 40 000 via post office mail and 60 000 via email A total of 2 379 completed surveys were received a State carefully what population is sampled in this survey and what is the sample size Could you draw conclusions from this study about all physi cians practicing in the United States b What is the rate of nonresponse for this survey How might this affect the credibility of the survey results c Why is it misleading to call the report a survey of 100 000 physicians

Statistics
Statistics55 Running red lights The sample described in the previ ous exercise produced a list of 5024 licensed drivers The investigators then chose an SRS of 880 of these drivers to answer questions about their driving habits a How would you assign labels to the 5024 drivers Choose the first five drivers in the sample If you use Table B start at line 119 b One question asked was Recalling the last ten traffic lights you drove through how many of them were red when you entered the intersections Of the 880 respondents 171 admitted that at least one light had been red A practical problem with this survey is that people may not give truthful answers What is the likely direction of the bias do you think more or fewer than 171 of the 880 respondents re

Statistics
StatisticsO Ask More People In the 2016 presidential pre election surveys ABC Post sampled 740 likely voters during October 10 13 2016 and asked if they were planning to vote for Clinton and then asked the same question of a sample of 1135 likely voters taken from October 22 25 2016 However in their last survey taken November 3 6 2016 just before the election held on November 8 2016 they asked this question of a sample of 2220 likely voters Why do you think ABC Post did this

Statistics
Statisticsspan A certain brand of automobile tire has a mean life 38 000 miles and a standard deviation of 2 300 miles Assume the life spans of the tires have a bell shaped distribution Yes According to the z scores would the life spans of any of these tires be considered unusual No of b The life spans of three randomly selected tires are 35 700 miles 40 300 miles and 38 000 miles Using the empirical rule find the percentile that corresponds to each life span The life span 35 700 miles corresponds to a percentile of The life span 40 300 miles corresponds to a percentile of The life span 38 000 miles corresponds to a percentile of Round to the nearest whole number as needed 2 3 4 DO let 40 38

Statistics
StatisticsWhich of the following statements of T distribution is NOT true All t curves are unimodal symmetric and have an area of 1 00 The T distribution changes shape depending on the size of the sample As the sample size increases the T distribution becomes more normal When sample size is large we often use T distribution

Statistics
ProbabilityIf an infinite number of random samples of size n are drawn from any population with mean u and standard deviation o then as the sample size n becomes large the sampling distribution of sample means will approach normality even if the population distribution is not normally distributed is known as the O central limit theorem normal distribution sampling distribution

Statistics
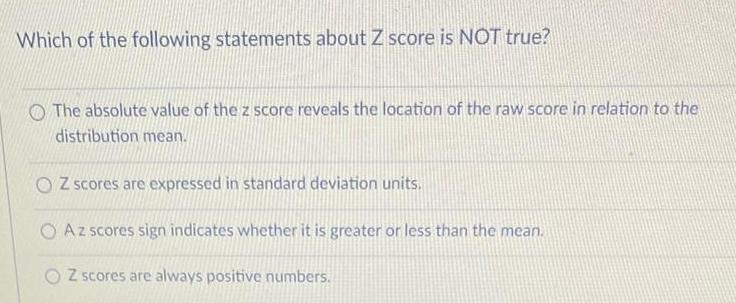
StatisticsWhich of the following statements about Z score is NOT true The absolute value of the z score reveals the location of the raw score in relation to the distribution mean OZ scores are expressed in standard deviation units Az scores sign indicates whether it is greater or less than the mean OZ scores are always positive numbers


Statistics
StatisticsFor every normal distribution 9544 95 44 of the are under curve lies between the mean and a point that is two standard deviations to the right and two standard deviations to the left c mean True

Statistics
StatisticsA binomial distribution has a variable that O consists of three categories O consists of only one category O consists of multiple categories O consists of two categories


Statistics
StatisticsGamma Corporation issued 95 000 shares of 0 50 par value common stock Later that year Gamma purchased 22 000 shares of its own common stock Two months later it reissued 2 600 shares How many shares are issued and outstanding OA 95 000 issued and 75 600 outstanding OB 97 600 issued and 75 600 outstanding OC 95 000 issued and 95 000 outstanding OD 117 000 issued and 114 400 outstanding

Statistics
StatisticsCompany reports the following information for its fiscal year end of March 31 2022 Click the icon to view the information What is the total paid in capital for Shelac Company at March 31 2022 OA 368 million OB 305 million OC 63 million OD 793 million Data table Common stock 0 01 par per share Paid in capital in excess of par Common Retained earnings Total stockholders equity value 63 million 305 million 425 million 793 million X

Statistics
StatisticsSaltwell Industries received 11 500 000 for the issuance of its stock on May 14 The par value of the Saltwell stock was only 11 500 Was the excess amount of 11 488 500 profit to Saltwell If not what was it Suppose the par value of the Saltwell stock had been 2 per share 4 per share or 7 per share Would a change in the par value of the company s stock affect Saltwell s total paid in capital Give the reason for your answer The excess is The 11 488 500 is common stock revenue gross margin other gains paid in capital GID

Statistics
StatisticsConsider a sample with a mean of 30 and a standard deviation of 5 Use Chebyshev s theorem to determine the minimum percentage of the data within each of the following ranges Round your answers to the nearest integer a 20 to 40 75 b 15 to 45 88 9 c 23 to 37 60 9 d 18 to 42 82 6 e 13 to 47 92 3 X X

Statistics
Statistics8 The ages in years and heights in inches of all pleners for a Click the icon to view the data sets CV heights CV ages Compare the results What can you conclude Round to one decimal place as needed 1 Age and Height Data Round to one decimal place as needed O A Ages and heights for all pitchers on this team have about the same amount of variability OB Ages are more variable than heights for all pitchers on this team OC Heights are more variable than ages for all pitchers on this team Heights Ages NNBRRRRR 72 72 80 70 70 70 72 78 74 28 28 26 26 29 24 27 26 29

Statistics
Statistics9 The ages in years and weights in pounds of all wide receivers for a football team are listed Find the coefficient of variation for each of the two data sets Then compare the results Click the icon to view the data sets 1 CV weights Round to one decimal place as needed Round to one decimal place as needed CV ages Compare the results What can you conclude OA Weights are more variable than ages for all wide receivers on this team OB Ages and weights for all wide receivers on this team have about the same amount of variability OC Ages are more variable than weights for all wide receivers on this team 1 Age and Height Data Weights 206 190 192 204 193 101 Ages 25 28 26 27 29 24 S

Statistics
Probability1 Researchers interviewed students and professors and asked them which type of entertainment they preferred books movies or video games The results are in the table below Students Professors Total Books Movies Video Games Total 21 15 38 6 18 51 27 33 89 a What fraction of the people in the study are students 38 89 2 27 29 b What fraction of the professors in the study preferred movies 18 51 c What fraction of the people who preferred books are students 21 27 d What fraction of the people in the study are professors who preferred video games 27 89 e Does there appear to be an association between role student professor and entertainment preference Explain