Statistics Questions
The best high school and college tutors are just a click away, 24×7! Pick a subject, ask a question, and get a detailed, handwritten solution personalized for you in minutes. We cover Math, Physics, Chemistry & Biology.

Statistics
ProbabilitySelect ALL systems that are equivalent to the one shown here 700 lb 25 A 1250 lb ft 3 5A 2 5A 1250 lb 4 2 5 ft B B 600 lb B 700 lb 1 ft Ift 1250 lb 2 5 ft 250 lb B 600 lb 500 lb 250 lb 2 5 ft 2 5 ft 500 lb 1250 lb B 1250 lb 1ft

Statistics
StatisticsSelect ALL systems that are equivalent to the 700 lb And 2 5 ft 1250 lb ft 2 5A 2 5 A 1250 lb 2 5 ft B B 600 lb B 700 lb 1 ft 1250 lb Ift 2 5 ft 250 lb n B 600 lb 500 lb 250 lb 2 5 2 5 ft 8 500 lb 1250 lb 1 ft B 1250 lb 1 ft

Statistics
ProbabilityThe following distributed load can be replaced with a single resultant force where the magnitude is determined by FR L 2L 8L FR L 2 W FR L 21 8L FR L 2 Fr L 2L 8 Fr L 8L W 2x 8

Statistics
StatisticsThe distribution of the number of hours that a random sample of people spend doing chores per week is shown in the pie chart Use 32 as the midpoint for 30 hours Make a frequency distribution for the data Then use the table to estimate the sample mean and the sample standard deviation of the data set Click the icon to view the pie chart First construct the frequency distribution Class Frequency f 0 4 3 5 9 14 10 14 20 15 19 18 16 9 5 20 24 25 29 30 Find an approximation for the sample mean X Type an integer or decimal rounded to the nearest tenth as needed

Statistics
StatisticsWestern Electronics completed these selected transactions during March 2021 i Click the icon to view the transactions Requirement 1 Report these items on Western Electronics balance sheet at March 31 2021 Select the balance sheet accounts then calculate each accounts balance and the total current liabilities amount at March 31 input field is not used in the table leave the field empty do not select a label or enter a zero Account Current liabilities Western Electronics Balance Sheet partial March 31 2021 Amount

Statistics
StatisticsMake a scatter plot for the given data Use the scatter plot to describe whether or not the variables appear to be related X y 8 6 1 5 4 10 7 17 9 5 8 11 17 14 OA 10 AY 22 9 T 21 The variables appear to be related OB 10 AY 22 X 21 The variables appear to be related www O C 10 22 X 21 The variables do not appear to be related mus pos O D 10 AY 22 X 21 The variables appear to be r

Statistics
StatisticsFind the indicated probability 100 employees of a company are asked how they get to work and whether they work full time or part time The results are shown below If one of the 100 employees is randomly selected find the probability of getting someone who carpools or someone who works fu time 1 Public transportation 8 full time 10 part time 2 Bicycle 3 full time 3 part time 3 Drive alone 27 full time 35 part time 4 Carpool 6 full time 8 part time O 0 24 O 0 52 O 0 17 O 0 46
Statistics
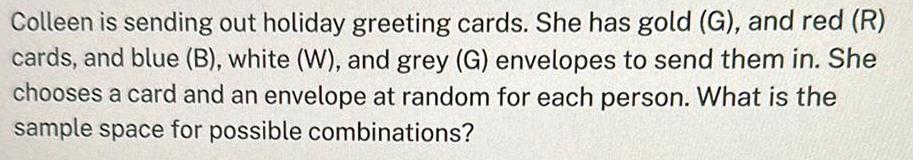
StatisticsColleen is sending out holiday greeting cards She has gold G and red R cards and blue B white W and grey G envelopes to send them in She chooses a card and an envelope at random for each person What is the sample space for possible combinations

Statistics
StatisticsComputer the correlation coefficient using the following data Round to two decimal places X 8 1 2 8 6 2 5 3 3 5

Statistics
Statisticsthe scatter plot to describe whether or not the variables appear to be related VIIVVV HIV A 100 80 3878 Ay 60 40 20 uvi pivi IV 04 0 20 40 60 80 100 Do these variables appear to be related Generation Millennials Gen X Boomers Silent Greatest Generation A No they do not appear to be correlated B Yes they appear to be negatively correlated OC Yes they appear to be positively correlated B AY 100 80 60 40 20 Won t Try Sushi X 75 THE 66 53 38 0 Don t Approve of Marriage Equality 0 0 20 40 60 80 100 Q Q y 35 44 53 69 Ay 100 80 80 40 20 04 0 20 40 60 80 100 oo Q D Ay 100 80 60 200 40 20 04 C 0 20 40 60 80

Statistics
StatisticsMake a scatter plot of the given data Choose the correct graph below The table to the right shows teenage drug use in different countries Make a scatter plot for the given data Use the scatter plot to describe whether or not the variables appear to be related 14 20 04 Other Ibagat Drugs 0 20 40 80 Marijuana A There appears to be no correlation There appears to be a negative correlation B Other Ilegal Drugs B 404 20 18 3 0 0 20 40 60 Marijuana Part 2 of 2 O Use the scatter plot to describe whether or not the variables appear to be related Choose the correct answer below K C Other Ilegal Drugs 40 204 0 0 19 20 40 60 Marijuana Q Points 0 5 of 1 o Country A B C D E F Who Have Used Other Illegal Marijuana Drugs y X 24 4 20 5 42 4 40 15 D Other Ilegal Drugs 40 20 25 1 17 7 0 20 40 60 Marijuana Country G H I J K Q Q Who Have Used Other Illegal Marijuana Drugs X y 23 13 6 5 6 4 50 31 34 22 D

Statistics
ProbabilityFind the indicated probability A 6 sided die is rolled What is the probability of rolling a 4 or a 5 O 1 6 O 1 36 O the answer is none of these choices O 7 36

Statistics
ProbabilityAnswer the question considering an event to be unusual if its probability is less than or equal to 0 05 Assume that a study of 500 randomly selected school bus routes showed that 486 arrived on time Is it unusual for a school bus to arrive late O No O Yes

Statistics
ProbabilityFind the indicated probability In a survey 306 respondents said they lived in an apartment and 626 said they lived in a house If one of the survey respondents is randomly selected find the probability of gettin someone who lives in an apartment Round to the nearest thousandth if necessary O the answer is none of these choices O 0 001 O 0 328

Statistics
ProbabilityIn a certain class of students there are 8 boys from Wilmette 6 girls from Kenilworth 9 girls from Wilmette 5 boys from Glencoe 5 boys from Kenilworth and 9 girls from Glencoe If the teacher calls upon a student to answer a question what is the probability that the student will be from Glencoe O the answer is none of these choices O 0 333 O 0 407 O 0 119 0 0314

Statistics
ProbabilityFind the indicated probability If you pick a card at random from a well shuffled deck that contains no joker so 52 cards total what is the probability that you get a face card or a spade Assume that this deck contains 13 spades and there are 3 face cards that are spades jack queen and king there are 3 face cards that are hearts 3 face cards that are diamonds and 3 face cards that are clubs giving you a total of 12 face cards O 3 52 O 22 52 O the answer is none of these choices O 25 52

Statistics
ProbabilityFind the indicated probability The table below describes the smoking habits of a group of asthma sufferers Smoking Habits of Asthma Sufferers Occasional Smoker 48 36 84 Men Women Total Nonsmoker Doesn t O 0 529 O 0 213 Smoke 435 320 755 Regular Smoker 76 74 150 Heavy Smoker 44 33 77 Total 603 463 1066 If one of the 1066 people is randomly selected find the probability of getting someone who is a regular or heavy smoker

Statistics
ProbabilityFind the indicated probability A card is drawn from a well shuffled deck of 52 cards What is the probability of drawing an ace or a 7 O2 13 08 O 4 13 O 13 2

Statistics
StatisticsFill in the blanks in the table below calculate 1 the Nominal GDP for 2020 2 Nominal GDP for 2021 and 3 real GDP for 2021 use year 2020 as a base year Blank 1 Blank 2 Blank 3 Volume of Goods Services Prices Nominal GDP Real GDP 2020 30A 30G 30M A 2021 A 1 G 10 M 2 A 2 G 12 M 4 1 390 A 35A 35G 35M 2 3

Statistics
ProbabilityCassie was the lucky journalist assigned to cover the Best Beard Competition She recorded the contestants beard colors in her notepad Cassie also noted if the contestants were signed up for the mustache competition later in the day Red beard Grey beard Only in the beard competition Also in the mustache competition 3 1 2 5 What is the probability that a randomly selected contestant is also in the mustache competition given that the contestant has a grey beard Simplify any fractions

Statistics
ProbabilityKenny joined a book club to spend more quality time with his cousin At the first meeting club members recorded how many hours a week they typically read and whether they preferred e readers or paperback books About 1 hour per week About 3 hours per week E readers 3 5 Paperback books 4 5 What is the probability that a randomly selected club member prefers paperback books given that the club member reads about 1 hour per week Simplify any fractions
Statistics
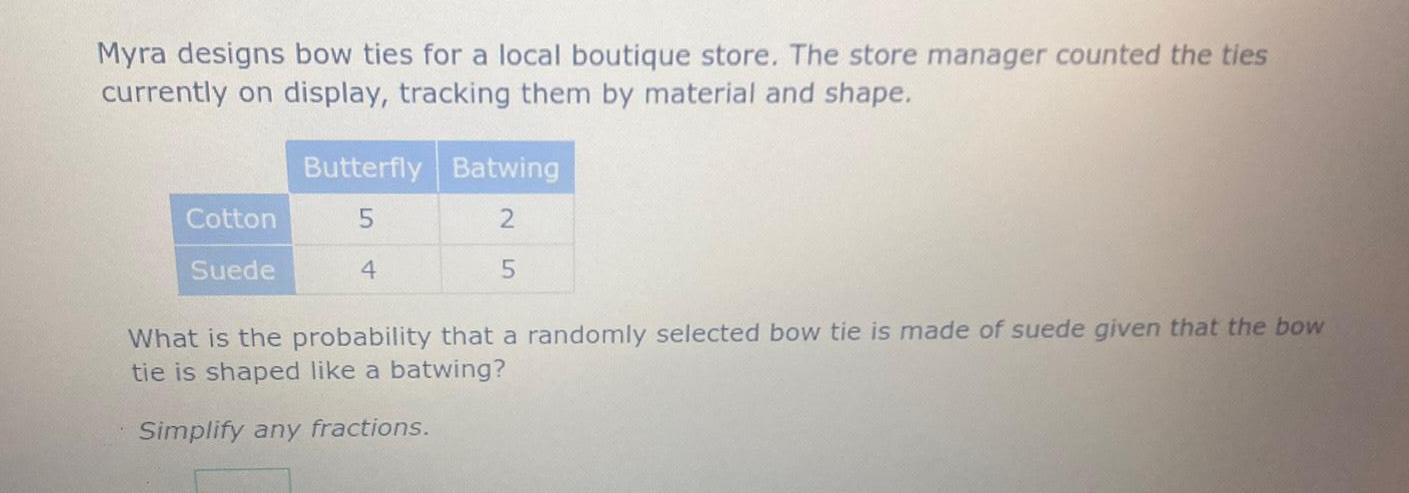
ProbabilityMyra designs bow ties for a local boutique store The store manager counted the ties currently on display tracking them by material and shape Cotton Suede Butterfly Batwing 5 2 5 4 What is the probability that a randomly selected bow tie is made of suede given that the bow tie is shaped like a batwing Simplify any fractions

Statistics
StatisticsTo Year 2010 2020 2030 2040 2050 2060 2070 2080 2090 2100 2110 Total carbon Emissions Smokestack 8 9 GT 10 8 GT 13 2 GT 16 0 GT 19 6 GT 23 8 GT 36 2 GT 44 2 GT 53 8 GT 65 6 GT 80 0 GT Gaseous Carbon Atmosphere 391 415 445 479 519 569 646 753 882 1042 1244 Ocean Water Ocean Surface 1000 1035 1050 1066 1085 1107 1137 1178 1224 1275 1333 What is the relationship between an increase in total carbon concentration the smokestack and increased carbon in the ocean surface How might this change marine life populations What impact could fifty years at this level of emissions have on marine fauna On marine flora In addition to circulating through the carbon cycle where else might excess carbon be found In fifty years where would you be most likely to see excess carbon Which areas are most highly and quickly affected by an increase in carbon emissions and increase in fossil fuel consumption How would these effects manifest themselves What are the dangers benefits to these Deep Ocean 38000 What is the relationship between an increase in fossil fuel consumption and increased carbon in terrestrial plants How might this change flora populations What impact could twenty years at this level of consumption have on flora 38021 38057 38107 38170 38250 38349 38478 38642 38845 39091 Oil and Gas 500 444 375 292 190 66 0 Fossil Fuels 10 10 0 Coal 3500 3457 3405 3342 3264 3170 2933 2528 2035 1433 700 Biosphere Carbon Soil 2000 2002 1828 2016 2026 2038 2051 2068 2089 2113 2141 Terrestrial Plants 700 708 718 730 743 758 776 801 830 862 899

Statistics
ProbabilityBruce attended a music store s banjo sale He counted the types of banjos and made note of their discounts 4 strings 5 strings 25 off 50 off 6 6 4 What is the probability that a randomly selected banjo has 5 strings given that the banjo is 50 off Simplify any fractions Vic

Statistics
StatisticsA factory produces plates Their diameters are normally distributed Mean diameter 11 in Standard deviation 0 01 in An inspector samples 65 plates at a time Part A What is the standard error of the mean for each sample Enter the correct value in the box to answer the question Round your answer to the nearest ten thousandth Show Hints

Statistics
StatisticsOver a weekend Lester counted the number of single scoop ice creams ordered at his store He tracked the flavors and the day on which it was ordered Chocolate Vanilla Saturday 2 4 Submit Sunday 4 3 What is the probability that a randomly selected ice cream was ordered on a Saturday given that the ice cream was chocolate Simplify any fractions

Statistics
StatisticsOn a standardized test the scores of seniors at a high school were normally distributed with a mean of 22 3 and a standard deviation of 3 5 For random samples of 25 scores what interval centered on the mean captures 99 7 of the sample means Enter the correct values in the boxes to answer the question Show Hints 11 8 X to 32 8 X 7

Statistics
StatisticsReagan an aspiring meteorologist spent the past few weekends studying the clouds She took detailed notes on the types of clouds observed and the time of day they were observed Stratocumulus Stratus Morning Afternoon 5 3 4 4 What is the probability that a randomly selected cloud was marked as stratus given that the cloud was observed in the morning Simplify any fractions Submit

Statistics
StatisticsApplication 1 7 Have we found the beef Here are data on the amount of fat in grams in 12 different McDonald s beef sandwiches along with a dotplot The mean fat content for these sandwiches is 22 833 grams 11 22 21 40 27 10 15 20 8 25 Fat g 1 Find the range of the distribution 17 30 15 29 27 26 35 2 Find the interquartile range Interpret this value in context 3 Calculate the standard deviation Interpret this value in context 40 31 4 a The dotplot suggests that the Bacon Clubhouse Burger with its 40 grams of fat is a possible outlier Recalculate the range interquartile range and standard deviation for the other 11 sandwiches b Compare these values with the ones you obtained in Questions 1 through 3 Explain why each result makes sense

Statistics
StatisticsThe College Boards which are administered each year to many thousands of high school students are scored so as to yield a mean of 513 and a standard deviation of 130 These scores are close to being normally distributed What percentage of the scores can be expected to satisfy each of the following conditions a Greater than 600 b Greater than 700 Less than 450 Between 450 and 600 C d

Statistics
StatisticsConsider the following quantities If the quantity is a parameter type p If the quantity is a statistic type s a 1 answer b 01 answer c 1 answer d 81 answer e 2 answer f 02 answer g 2 answer h 82 answer V C U T

Statistics
StatisticsFor the given data find Ex n and Ex n 1 10 x2 13 3 20 x4 11 5 16 x6 16 7 19 28 16

Statistics
StatisticsA sample of 300 residents from Seattle is taken to estimate the median income of all Seattle residents Is this study OA REPRESENTATIVE B NON REPRESENTATIVE A simple random sample of 2000 men over age 18 is taken to estimate the mean weight of all adult males Is this study OA REPRESENTATIVE B NON REPRESENTATIVE A simple random sample of 10 men over the age 18 is taken to estimate the mean height of all adult males Is this study A REPRESENTATIVE OB NON REPRESENTATIVE A telephone survey of 1000 registered voters is conducted during the day in order to determine the chances of a certain candidate winning an election Is this study OA REPRESENTATIVE B NON REPRESENTATIVE A simple random sample of 400 U S citizens is taken in order to estimate the mean cholesterol level of U S citizens Is this study A REPRESENTATIVE B NON REPRESENTATIVE

Statistics
ProbabilityA sample of 30 dentists from Seattle is taken to estimate the median income of all Seattle residents Is this study A REPRESENTATIVE O B NON REPRESENTATIVE A simple random sample of men over age 18 is taken to estimate the mean weight of all adult males Is this study A REPRESENTATIVE B NON REPRESENTATIVE A telephone survey is conducted during the day in order to determine the chances of a certain candidate winning an election Is this study OA REPRESENTATIVE B NON REPRESENTATIVE A simple random sample of 40 U S citizens is taken in order to estimate the mean cholesterol level of U S citizens Is this study O A REPRESENTATIVE B NON REPRESENTATIVE

Statistics
StatisticsThe triangular area in green below is known as Price of Apple 2 00 1 75 1 50 1 25 1 00 0 75 0 50 0 25 0 1 2 3 4 5 6 Quantity of Apples in thousands a circumventing equilibrium b consumer surplus c deadweight loss d producer surplus Supply Demand h

Statistics
StatisticsFor the given data find x n and Ex n x 20 x 25 x3 15 x4 20 x5 19 x6 9 x7 20 xg 21

Statistics
Statisticser the following data set 20 61 52 45 38 22 20 30 37 25 44 49 37 37 60 64 58 49 Below is a partially completed stem and leaf diagram for this data set 2 4 28

Statistics
StatisticsThis graph shows the results of a study about how people of different ages use national TV as a source of news Percentage by Age Group 100 90 80 70 60 50 40 30 20 10 O Natiional TV Used as News Source Frequently Sometimes Key teenagers young adults older adults Never

Statistics
Statisticsa An opinion poll contacts 1743 adults and asks them Which political party do you think has better ideas for leading the country in the 21st century In all 689 of the 1743 say The Democrats The sample in this setting is O A the 1743 people interviewed B the 689 people who chose the Democrats C all 235 million adults in the United States D None of the above b Archaeologists plan to examine a sample of 3 meter square plots near an ancient Greek city for artifacts visible in the ground They choose separate samples of plots from floodplain coast foothills and high hills What kind of sample is this A A Simple random sample B A voluntary response sample C A stratified random sample D None of the above c A committee on community relations in a college town plans to survey local businesses about the importance of students as customers From telephone book listings the committee chooses 268 businesses at random Of these 64 return the questionnaire mailed by the committee The population for this study is O A the 268 businesses chosen B the 64 businesses that returned the questionnaire C all businesses in the college town D None of the above

Statistics
StatisticsFor each problem select the best response a A description of different houses on the market includes the following three variables Which of the variables is quantitative A The school district B The exterior paint colors OC The street number D The monthly electric bill OE None of the above b A professor records the values of several variables for each student in her class These include the variables listed below Which of these variables is categorical A Score on the final exam out of 200 points OB Final grade for the course A B C D or F C The number of lectures the student missed OD The total number of points earned in the class i e the total of the points on all exams and quizzes in the course The maximum number of points possible is 500 OE None of the above c A description of different houses on the market includes the following three variables Which of the variables is quantitative A The school district OB The exterior paint colors C The street number D The monthly electric bill OE None of the above

Statistics
StatisticsThe answer above is NOT correct Which of the following selected variables associated with clinical trials of a drug are quantitative variables CHECK ALL THAT APPLY A Gender Male Female B Smoking history cigarettes per year C Age in years 20 20 30 30 40 40 50 50 60 60 or above D Dosage form 1 tablet 2 capsule 3 liquid solution 4 other

Statistics
StatisticsConsider the following tasks times and predecessors for an assembly of set top cable converter boxes TASK TIME PRECEDING ELEMENT MINUTES TASKS A 1 I HBCDEFGHT Efficiency 2 1 2 2 3 1 1 1 A B B CD A F G E H Given a cycle time of four minutes what is the efficiency of your layout Use any rule that you wish to assign tasks to workstations as the rule used should not affect the efficiency answer Round your answer to the nearest whole percent

Statistics
Statisticsata collected by a price reporting agency from more than 90 000 gasoline and convenience stores throughout the U S showed that the average price for a gallon of unleaded gasoline was 3 28 The following data show the price per gallon for a sample of 20 gasoline and convenience stores located in San Francisco 3 59 3 79 4 59 3 36 3 55 3 91 3 45 3 60 3 55 3 36 3 37 3 79 3 75 3 99 4 15 3 66 3 83 3 73 3 81 3 37 a Use the sample data to estimate the mean price in dollars for a gallon of unleaded gasoline in San Francisco b Compute the sample standard deviation in dollars Round your answer to the nearest cent c Compare the mean price per gallon for the sample data to the national average price What conclusions can you draw about the cost of living in San Francisco The average price for a gallon of unleaded gasoline in San Francisco is Select the national average This indicates that the cost of living in San Francisco is Select t
Statistics
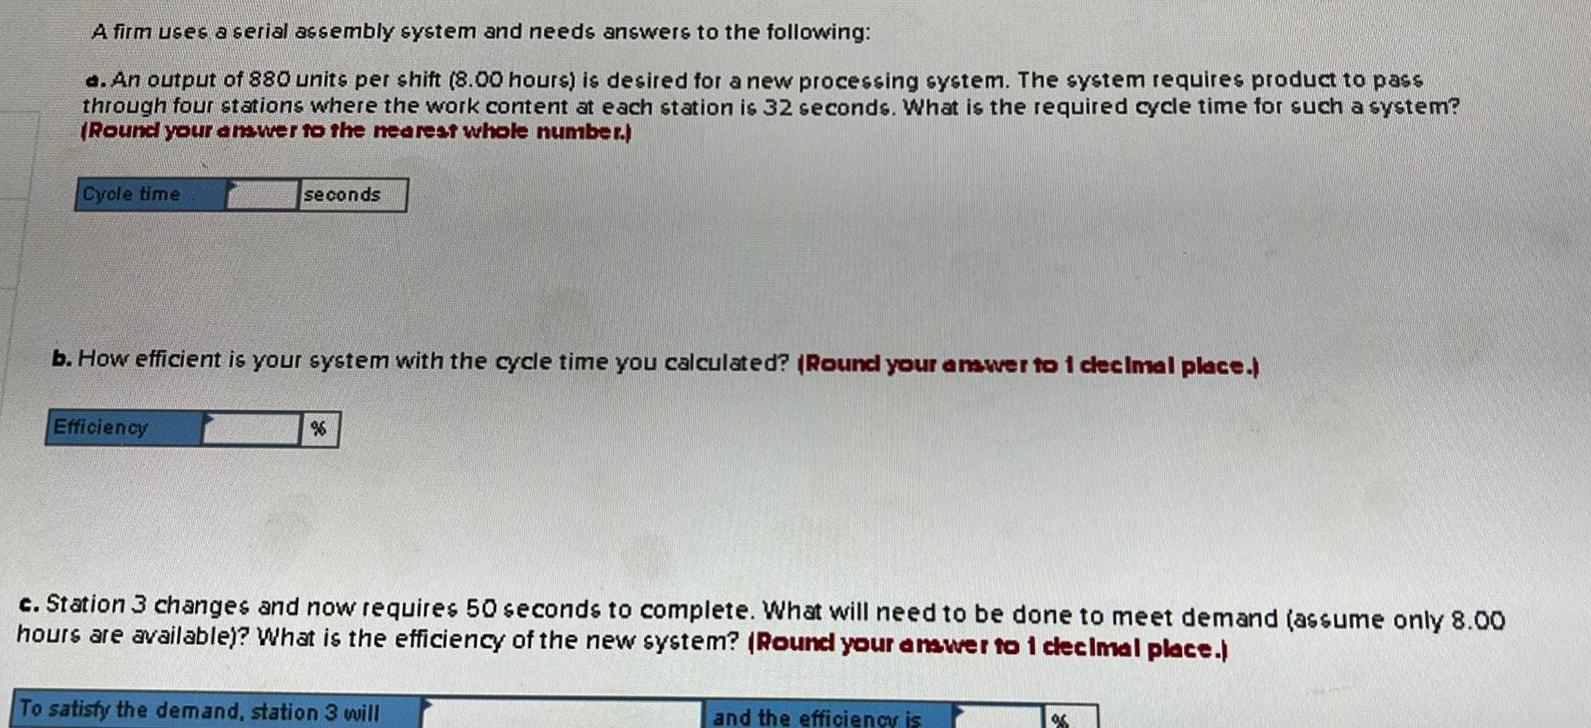
StatisticsA firm uses a serial assembly system and needs answers to the following a An output of 880 units per shift 8 00 hours is desired for a new processing system The system requires product to pass through four stations where the work content at each station is 32 seconds What is the required cycle time for such a system Round your answer to the nearest whole number Cycle time seconds b How efficient is your system with the cycle time you calculated Round your answer to 1 decimal place Efficiency c Station 3 changes and now requires 50 seconds to complete What will need to be done to meet demand assume only 8 00 hours are available What is the efficiency of the new system Round your answer to 1 decimal place To satisfy the demand station 3 will and the efficiency is 98

Statistics
Statisticsmanatee deaths from powerboat collisions in Florida Yea r 2007 2008 2009 2010 2011 2012 2013 2014 2015 2016 100 80 60 Powerboa Deat ts hs 1027 1010 982 942 922 902 897 900 M 916 931 73 90 97 83 87 81 73 69 86 104 In 1997 were 755 000 powerboats registered and 54 manatee deaths 1000 600 600 Powerboats registered x1000 Side by Side Macmillan Learning Now imagine that powerboats became even more popular in Florida and that there were 1 5 million powerboats registered in a year Make the prediction regardless of its validity Enter your answer to at least two decimal places manatee deaths Select the correct explanation for why you should not use the regression equation you found to make this prediction even though it does not lead to a completely senseless result O We cannot trust this prediction even though the result is not completely senseless because it is much larger than the number of deaths for any other year O We cannot trust this prediction even though the result is not completely senseless because it is a prediction outside the range of the data collected extrapolation O We cannot trust this prediction even though the result is not completely senseless because the slope is too small O We cannot trust this prediction even though the result is not completely senseless because the slope is too large

Statistics
Probabilitymanatee deatns from powerboat collisions in Florida Yea r 2007 2008 2009 2010 2011 2012 2013 2014 2015 2016 Manatee deaths from powerboat collisions 100 80 60 40 20 Powerboa Deat ts hs 400 1027 1010 982 942 922 902 897 900 916 931 73 90 97 83 87 81 73 69 86 104 In 1997 there were 755 000 powerboats registered and 54 manatee deaths 1000 600 800 Powerboats registered x1000 Side by Side Macmillan Learning Now imagine that Florida took a drastic measure and limited the number of powerboat registrations to 200 000 per year Use the exact prediction equation found for this question y 46 75 0 1358x to predict the number of manatee deaths by powerboat in this condition Enter your answer rounded to two decimal places manatee deaths This equation should not be used to predict the number of manatee deaths by powerboat in this condition because it is and make sense because it is negative

Statistics
StatisticsMacmillan Learning Stacked The Department of Motor Vehicles warns of the effect of drinking alcohol on blood alcohol content BAC in percent o volume One drink is defined as 12 ounces oz of beer or 4 oz of table wine or 1 25 oz of 80 proof liquor The impact of a single drink on a person s BAC depends on sex and weight For a 160 pound man the blood alcohol co a function of the number of drinks consumed in one hour can be expressed by the regression line BAC 0 023 x number of drinks What does the slope of this line tell you This is a horizontal line with a slope of zero This means the value of y is constant The slope is 0 023 this means that on average BAC decreases by 0 023 for each drink consumed The slope is 160 this means that on average BAC increases by 160 for each drink consumed The slope is 0 023 this means that on average BAC increases by 0 023 for each drink consumed Why do you think the intercept is zero O The intercept is zero because BAC can not be negative O The intercept is zero because individuals who did not have any drinks had a BAC of 0 O The intercept is not zero because the slope is too high O The intercept is zero because eventually every line goes through the origin

Statistics
StatisticsSide by Side til recently the Zika virus was a rare and mild public Ith concern and little was known about it In early 2015 zil reported an epidemic of Zika viral infection Reports n followed of unusual numbers of neurological orders such as microcephaly in newborns a condition aracterized by a very small head and poor brain growth Macmillan Learning Explain why we cannot conclude from this information alone that Zika infections cause microcephaly in newborns O There may be a lurking variable that is increase in both Zika infections and mi in newborns It is not biologically plausible for the 2 cause brain issues for newborns One needs to conifirm that microceph defects occur before the Zika virus inf O Correlation and regression lines desc linear relationships so no conclusion be drawn

Statistics
StatisticsMacmillan Learning Frequency notes per second 9 8 7 16 5 4 3 2 16 18 20 22 24 Temperature degrees Celsius 26 28 1 J D McLister The energetics of male reproductive behavior in the treefrog Hyla versicolor MS thesis University of California at Irvine 200 Given that the relationship between temperature and call frequency in the scatterplot is clearly linear and that te explains approximately 75 of the variability in call frequency you conclude that temperature is the main factor in mating call frequency temperature may influence mating call frequency temperature causes 75 of the variation in mating call frequency

Statistics
StatisticsMacmillan Learning Because elderly people may have difficulty standing straight to have their heights measured a study looked at predicting height from height to the knee The data in centimeters cm for five elderly men are listed in the table Knee height x cm Height y cm 57 7 O 2 5 0 32x O 44 1 2 4x O 0 3 2 5x 192 1 47 4 153 3 43 5 146 4 44 8 162 7 55 2 169 1 Use your calculator or software What is the equation of the least squares regression line for predicting height from k height Enter the coefficients rounded to one decimal place O 2 4 44 1x