Statistics Questions
The best high school and college tutors are just a click away, 24×7! Pick a subject, ask a question, and get a detailed, handwritten solution personalized for you in minutes. We cover Math, Physics, Chemistry & Biology.

Statistics
StatisticsA boxplot for a set of data is given below Find the five number summary Find the minimum Find Q1 Find the median 0 1 2 3 4 5 6 7 8 9 10 11 12 13 14 15 16 17 18 19 20 DATA Find Q3 Find the maximum

Statistics
StatisticsSoc 3 6 Med Med Bus 3 7 3 10 The following table presents homeownership rates in percentages by state for the years 1985 1996 and 2002 These values represent the proportion of homes owned by the occupant to the total number of occupied homes State Alabama Alaska Arizona Arkansas California Colorado Connecticut Delaware Dist of Columbia Florida Georgia Hawaii Idaho Illinois Indiana Iowa Kansas Kentucky Louisiana Maine Maryland Massachusetts Michigan Minnesota Mississippi Missouri COST 1985 1996 2002 70 4 71 0 73 5 61 2 62 9 67 3 64 7 62 0 65 9 66 6 66 6 70 2 54 2 55 0 58 0 63 6 64 5 69 1 69 0 69 0 71 6 71 5 40 4 67 2 67 1 68 7 62 7 69 3 71 7 51 0 50 6 57 4 71 0 71 4 73 0 60 6 68 2 70 2 74 2 75 0 72 8 73 9 67 5 70 2 73 2 73 5 70 2 64 9 67 1 73 9 73 7 76 5 65 6 66 9 72 0 60 5 61 7 62 7 70 7 73 3 76 0 75 4 77 3 70 0 69 6 73 0 74 8 69 2 70 2 74 6 70 3 37 4 3 51 3 0 2 5 2 0 1 5 1 0 67 6 69 9 68 3 68 5 5 0 75 6 44 1 State The Boxplot 3 33 Construct a boxplot for the following measurements 33 31 19 25 23 27 11 9 29 3 17 9 2 5 8 2 9 1 3 76 For Montana Nebraska Nevada New Hampshire New Jersey New Mexico New York North Carolina North Dakota Ohio CAN Oklahoma Oregon Pennsylvania Rhode Island South Carolina South Dakota Tennessee Texas Utah TYPE Vermont Virginia Washington West Virginia Wisconsin Wyoming 3 34 The following data are the resting pulse rates for 30 randomly selected individuals who were participants at a 10K race 49 40 59 56 55 70 49 59 55 49 58 54 55 72 51 54 56 55 65 57 61 41 52 60 49 57 46 55 63 55 hin moton 3 35 Consumer Reports in its May 1998 issue provides cost per daily feeding for 28 brands of dry dog food and 23 brands of canned dog food Using the Minitab computer program the following side by side boxplot for these data was created DOG FOOD COSTS BY TYPE OF FOOD 1985 66 5 68 5 57 0 65 5 69 5 62 3 67 2 68 2 70 3 50 3 55 0 68 0 70 4 70 0 69 9 68 2 69 5 67 9 69 2 72 0 70 5 68 4 69 4 61 5 63 1 66 2 71 6 71 7 74 0 61 4 56 6 59 6 72 0 72 9 77 3 67 6 67 8 71 5 67 6 68 8 70 1 63 8 72 7 70 2 1996 2002 68 6 69 3 66 8 68 4 61 1 65 5 a Construct a stem and leaf plot of the pulse rates b Construct a boxplot of the pulse rates c Describe the shape of the distribution of the pulse rates d The boxplot provides information about the distribution of pulse rates for what population 65 0 64 6 67 1 52 7 60 5 61 8 71 5 72 7 70 3 68 5 DRY 69 5 68 5 74 3 66 8 63 1 67 0 75 9 74 3 77 0 63 8 68 2 72 0 73 2 68 0 72 8 a From these graphs determine the median lower quartile and upper quartile for the daily costs of both dry and canned dog food b Comment on the similarities and differences in the distributions of daily costs for the two types of dog food Summarizing Data from More Than One Variable Graphs and Correlation
Statistics
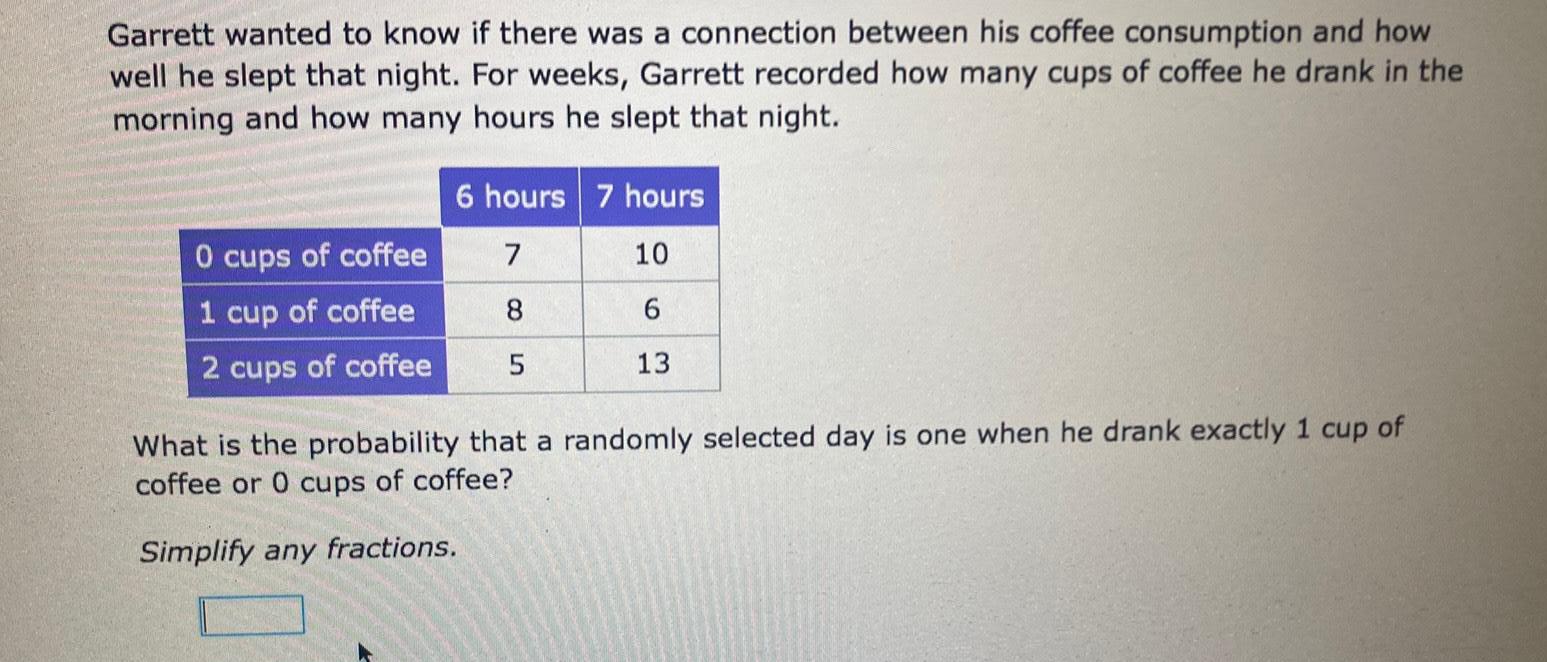
StatisticsGarrett wanted to know if there was a connection between his coffee consumption and how well he slept that night For weeks Garrett recorded how many cups of coffee he drank in the morning and how many hours he slept that night 0 cups of coffee cup of coffee 2 cups of coffee 6 hours 7 hours 7 10 8 6 5 13 What is the probability that a randomly selected day is one when he drank exactly 1 cup of coffee or 0 cups of coffee Simplify any fractions

Statistics
StatisticsIn a standard deck of 52 playing cards there are 4 aces 4 kings 4 queens and 4 jacks All other cards have number values The kings queens and jacks are called face cards You are dealt two cards in sequence Find the probability that you are dealt two face cards Enter the exact correct answer in simplified form in the box Show Hints P two face cards A

Statistics
ProbabilityUpdate A bag contains 4 green 3 yellow 2 purple and 1 blue marble s You draw a marble put it aside and then draw another marble Find the probability that you draw a blue marble and then a green marble or a yellow marble Enter the simplified fraction in the box Show Hints

Statistics
ProbabilityStudents at a school were asked whether they would be interested in free guitar lessons They were also asked whether they were left or right handed The results of the survey are shown in the table Left handed Right handed Part A Interested 6 16 Not interested 10 88 For the event A of being left handed and the event B of being interested in free guitar lessons use the Multiplication Rule to find P ANB Enter the correct answer in the box

Statistics
StatisticsA study determined that an average 25 year old male in 2014 could expect to live at least 50 3 more years and an average 25 year old female in 2014 could expect to live at least 54 8 more years a To what age could an average 25 year old male expect to live b To what age could an average 25 year old female expect to live c Who can expect to live longer a male or a female By how many years a Let x be the age to which an average 25 year old male can expect to live Type an inequality Type an expression using x as the variable

Statistics
ProbabilityStudents at a high school were asked whether they had ever made dinner for their families The results of the survey are shown in the table Let A represent the event Haven t made dinner and let B represent the event Freshman Freshman Senior Total Part A Have made Haven t made 0 51 0 24 0 75 0 17 0 08 0 25 Total 0 68 0 32 1 Find the probabilities P BA and P B A Haven t made B Freshman

Statistics
StatisticsSadie attended a music store s banjo sale She counted the types of banjos and made note of their discounts 25 off 50 off 4 strings 8 6 5 strings 7 7 6 strings 3 1 What is the probability that a randomly selected banjo has 5 strings or 4 strings Simplify any fractions

Statistics
ProbabilityFor a few weeks a music producer kept track of newly released songs on a music streaming website He recorded the music genre and number of times the song was played on its release date Country Rock 0 500 plays 501 1 000 plays 5 3 4 3 What is the probability that a randomly selected song was rock or had 501 1 000 plays Simplify any fractions

Statistics
ProbabilityHOW OLD ARE U S PRESIDENTS The table gives the ages of the first 44 U S presidents when they took office President Age President Age Washington 57 Taylor J Adams 61 57 57 58 Lincoln 57 A Johnson 61 Grant 54 Hayes 68 51 49 Jefferson Madison Monroe J Q Adams Jackson Van Buren W H Harrison Tyler Polk F Fillmore Pierce Buchanan President B Harrison 64 50 Cleveland 48 McKinley 65 52 56 46 54 49 51 47 Garfield Arthur Cleveland T Roosevelt Taft Wilson Harding Coolidge Hoover F D Roosevelt Truman Age President 55 Eisenhower 55 Kennedy 54 42 51 56 55 51 54 51 60 L B Johnson Nixon Ford Carter Reagan G H W Bush Clinton G W Bush Obama 1 Make a frequency histogram of the data using intervals of width 4 starting at age 40 Age 61 43 55 56 61 52 69 64 46 54 47

Statistics
Statistics5 of 2 ok nt nces Office salaries expense Insurance expense Rent expense Selling space Rent expense Office space Store supplies expense Advertising expense Totals Additional Information 15 550 0 7 500 7 500 0 9 800 189 900 a Store supplies still available at fiscal year end amount to 2 550 b Expired insurance an administrative expense is 1 650 for the fiscal year c Depreciation expense on store equipment a selling expense is 1 600 for the fiscal year d To estimate shrinkage a physical count of ending merchandise inventory is taken It shows 10 800 of inventory is still available at fiscal year end 4 Compute the current ratio acid test ratio and gross margin ratio as of Note Round your answers to 2 decimal places Current ratio Acid test ratio Gross margin ratio 189 900 1 1 1 nuary 31

Statistics
Probability0 Three distributions I II and III are shown below as well as three sets of summary a Match each histogram to its set of summary statistics and explain your reasoning b Estimate the IQR for each distribution Hint consider where to place vertical lines that divide the total area into four equal parts Then find the distance between the first and third lines 0 0 TTTTT 0 2 2 2 4 4 4 6 6 6 8 8 8 10 10 10 Set A Mean Median Standard Deviation Mean Set B Median Standard Deviation Mean Set C Median 5 7 6 4 2 3 Standard Deviation 5 0 4 8 2 0 5 0 4 9 3 0

Statistics
Probability3 20 In a study of 1 329 American men reported in American Statistician 1974 28 115 122 the men were classified by serum cholesterol and blood pressure The group of 408 men who had blood pressure readings less than 127 mm Hg were then classified according to their serum cholesterol level Serum Cholesterol mg 100cc 0 0 199 9 200 0 219 9 220 0 259 9 greater than 259 Frequency 119 88 127 74 a Estimate the mode median and mean for the serum cholesterol readings if possible b Which of the three summary statistics is most informative concerning a typical

Statistics
StatisticsRacing experience years 6 3 10 4 4 2 4 7 a Verify that the mean years of experience is 5 years Does this value appear to adequately represent the center of the data set b Verify that y 5 46 c Calculate the sample variance and standard deviation for the experience data How would you interpret the value of the standard deviation relative to the

Statistics
StatisticsWhat if a thirteenth brand of coffee was added to the data set in the previous problem Death Wish is one of the world s strongest coffees with caffeine concentration of 458 mg cup How would this affect the standard deviation

Statistics
Probability2 16 pints Prepare journal entries to record the following merchandising transactions of Lowe s which uses the perpetual inventory system and the gross method August 1 Purchased merchandise from Aron Company for 10 000 under credit terms of 1 10 n 30 FOB destination invoice dated August 1 August 5 Sold merchandise to Baird Corporation for 7 000 under credit terms of 2 10 n 60 FOB destination invoice dated August 5 The merchandise had cost 5 000 August 8 Purchased merchandise from Waters Corporation for 9 000 under credit terms of 1 10 n 45 FOB shipping point invoice dated August 8 Paid 170 cash for shipping charges related to the August 5 sale to Baird Corporation August 9 August 10 Baird returned merchandise from the August 5 sale that had cost Lowe s 500 and was sold for 1 000 The merchandise was restored to inventory August 12 After negotiations with Waters Corporation concerning problems with the purchases on August 8 Lowe s received a price reduction from Waters of 900 off the 9 000 of goods purchased Lowe s debited accounts payable for 900 August 14 At Aron s request Lowe s paid 130 cash for freight charges on the August 1 purchase reducing the amount owed accounts payable to Aron August 15 Received balance due from Baird Corporation for the August 5 sale less the return on August 10 August 18 August 19 Paid the amount due Waters Corporation for the August 8 purchase less the price allowance from August 12 Sold merchandise to Tux Company for 6 000 under credit terms of n 10 FOB shipping point invoice dated August 19 The merchandise had cost 3 000 August 22 Tux requested a price reduction on the August 19 sale because the merchandise did not meet specifications Lowe s gave a price reduction allowance of 1 000 to Tux and credited Tux s accounts receivable for that amount August 29 Received Tux s cash payment for the amount due from the August 19 sale less the price allowance from August 22 August 30 Paid Aron Company the amount due from the August 1 purchase Return to question

Statistics
StatisticsSuppose that que scores in a beginning statistics class have a mean of 6 7 with a standard deviation of 0 4 Using Chebyshev s Theorem what is the minimum percentage of quiz scores between 5 5 and 7 9 Round your answer to one decimal place Answer How to enter your answer opens in new window 2 Points Keypad Keyboard Shortcuts

Statistics
StatisticsFind the mean median and mode of the following data If necessary round to one more decimal place than the largest number of decimal places given in the data Answer 2 Points Rate of Fatal Alcohol Impaired Car Crashes per 100 Million Vehicle Miles of Travel 0 40 0 30 0 64 0 66 0 53 0 74 0 61 0 28 0 70 0 70 0 76 0 79 0 40 0 58 0 51 0 37 0 30 0 68 0 53 0 37 Copy Data Keypad Keyboard Shortcuts

Statistics
StatisticsConsider a set of data in which the sample mean is 34 4 and the sample standard deviation is 7 Calculate the z score given that x 29 9 Round your answer to two decimal places AnswerHow to enter your answer opens in new window 2 Points Keypad

Statistics
StatisticsSuppose that prices of a gallon of milk at various stores in one town have a mean of 3 71 with a standard deviation of 0 10 Using Chebyshev s Theorem what is the minimum percentage of stores that sell a gallon of milk for between 3 41 and 4 01 Round your answer to one decimal place AnswerHow to enter your answer opens in new window 2 Points Keypad Keyboard Shortcuts

Statistics
StatisticsThe following table presents the daily high temperatures for the city of Macon Georgia in degrees Fahrenheit for the winter months of January and February in a recent year 69 53 58 61 59 63 64 64 71 76 76 58 51 52 67 48 55 56 73 52 66 57 74 63 61 67 65 58 56 51 77 66 53 56 53 58 62 75 70 52 77 Send data to Excel Construct a stem and leaf plot using the digits 4 5 6 and 7 as the stems Do not separate the answers with a comma If there are no leaves select the None button S a

Statistics
StatisticsThe following stem and leaf plot represents the prices in dollars of general admission tickets for the last 30 concerts at one venue Use the data provided to find the quartiles Step 3 of 3 Find the third quartile Answer How to enter your answer opens in new window Stem 4 5 6 7 Ticket Prices in Dollars Leaves 22 2 3 3 1 2 4 5 00 1 3 01 2 2 6 4 2 Key 412 42 49 7 8 8 3 9 89 4 Tables Copy Data Keypad Keyboard Shortcuts

Statistics
StatisticsNational Weather Service reports the annual snowfall in Juneau Alaska to have a mean of 86 inches with a standard deviation of 8 5 inches Assuming the distribution is bell shaped how much annual snowfall can about 95 of years in Juneau expect to have Between 77 5 inches and 94 5 inches Between 80 inches and 100 inches Between 69 inches and 103 inches 5 inchos

Statistics
StatisticsGoucher College Hood College Johns Hopkins University Loyola University Maryland Maryland Institute College of Art McDaniel College Morgan State University Mount St Mary s University Notre Dame of Maryland University Salisbury University St John s College St Mary s College of Maryland Stevenson University Stevenson Towson University United States Naval Academy University of Baltimore University of Maryland Baltimore County University of Maryland College Park University of Maryland Eastern Shore University of Maryland University College 81 65 11 80 64 92 68 75 62 74 60 84 81 76 8 78 61 44 65 100 2 267 2 005 26 152 5 645 2 178 2 780 7 712 2 406 2 371 8 567 527 1 582 3 615 22 923 4 512 5 041 13 767 41 200 3 193 60 603

Statistics
StatisticsConsider the boxplot below of 160 high school freshmen 80 males and 80 females Approximately what percent of the female students weigh less than the minimum weight of the male students Female H Male 100 125 150 175 Weights lbs 200 225 250

Statistics
StatisticsYou are examining the wait time for help with rebooking tickets with major airline s phone service What would a large standard deviation of wait times mean The wait times for rebooking tickets are not very similar to one another Some customers waited a lot longer than others or a lot less than other customers The wait times for rebooking tickets are very similar to one another Customers waited nearly the same amount of time The wait times for rebooking tickets are exaclty the same for every customer Customers waited a very long amount of time

Statistics
StatisticsOne home was randomly selected from three different neighborhoods in a large metropolitan area The table shows the home price and the z score when compared to other homes in their neighborhood Neighborhood Jackson Park Wilson Canyon Chestnut Lake Price 212 000 231 000 223 000 Z score A 1 35 0 0 29 In which neighborhood was the home below average the price In which neighborhood was the home equal to the average price

Statistics
StatisticsThe mean height of players in the National Basketball Association NBA is 78 inches with a standard deviation of 3 2 inches The mean height of players in the National Football League NFL is 74 inches with a standard deviation of 1 8 inches NBA player Lebron James is 81 inches tall NFL player Tom Brady is 76 inches tall What is the z score for Tom Brady s height Round your answer to 2 decimal places

Statistics
ProbabilityThe data below are the naptimes for 34 children in a daycare Click here to open this data in StatCrunch Compute the five number summary Time minutes 28 40 30 45 20 Q1 21 36 33 32 30 45 43 43 34 20 40 41 7 Minimum 28 31 32 42 16 21 30 36 26 38 29 35 10 23 30 25 21 A

Statistics
ProbabilityThe box plot represents the weekly salaries in dollars of 80 randomly selected employees of a company The five number summary that was used to construct this box plot is also below Approximately how many employees are in each quartile Minimum 475 Q 650 Median 845 Q975 Maximum 2600 Boxplot for Weekly Earnings 500 1000 1500 Weekly Salary 2000 2500

Statistics
StatisticsIn 2019 College Board reported that the mean score for the math section of the SAT was 528 with a standard deviation of 110 A math department at local university would like to give a scholarship to any student that scored in the top 2 5 of students in the math section What is the minimum score needed to get this scholarship Assume the scores are normally distributed

Statistics
StatisticsAccording to the Arkansas Waterfowl Report an average of 1 2 million ducks migrate through the state yearly with a standard deviation of 0 2 million ducks Assuming the distribution is bell shaped what percent of years would there be between 1 4 and 1 6 million ducks migrating through Arkansas A

Statistics
StatisticsA Gallup Poll from October 15 2020 asked 1 014 U S adults if they thought marijuana should be legalized The data provided has two categorical variables Age Group 18 34 35 54 55 and Legalize Marijuana Yes No What percent of 18 34 year olds responded that marijuana should be legalized Round your anser to 2 decimal places Click here to open the data in StatCrunch

Statistics
ProbabilityConsumer Reports Health reported the accompanying caffeine concentration mg cup for 12 brands of coffee Click here to open this data in StatCrunch Compute the standard deviation for the caffeine concentration Round your answer to 1 decimal place Coffee Brand Eight O clock Caribou Kickapoo Starbucks Bucks Country Coffee Co Archer Farms Gloria Jean s Coffees Chock Full o Nuts Peet s Coffee Maxwell House Folgers Millstone Caffeine Concentration mg cup Data table of caffeine concentrations in coffee 195 155 115 195 180 110 110 130 55 60 60

Statistics
StatisticsThe contingency table below represents the responses to a first day survey of MATH 153 students in 2021 The two questions displayed are about which hand they write with AND whether they can play a musical instrument Preferred hand Left hand Right hand Ambidextrous Play musical instrument No 2 54 5 Yes 3 41 2 What does the number 41 represent in this table

Statistics
ProbabilityThe contingency table below summarizes a survey given to 130 randomly selected middle schoolers Grade Has Cell Phone No Cell Phone 6th 12 33 7th 10 22 8th 34 19 Total 56 74 Total 45 32 53 130 What percent of these middle schoolers are 7th graders Round your answer to 1 decimal place

Statistics
ProbabilityA recent survey asked 450 people if they thought women in armed force should be allowed to participate in combat The results of the survey are given in the table below Gender Male Female Total Yes 144 36 180 No 189 270 Total 225 225 450

Statistics
StatisticsThe table below provides hospitalization information about a sample of ten female who gave birth at a Medical Center in New York The pie chart below depicts the table data for the variable Marital Status Patient 1 2 3 4 5 6 7 8 9 10 Insurance Company CIGNA Medicaid Medicaid Medicaid Medicaid CIGNA CIGNA Blue Cross Medicaid Medicaid Baby birth weight grams 3300 3400 3400 2400 3200 3400 3600 3500 2700 2700 Marital Status Married Single Divorced Single Married Married Single Married Divorced Married B A What marital status does slice C represent in the pie chart A What percent of the mothers provided are divorced C

Statistics
StatisticsThe table below shows the political party for 46 U S Political Party Democrat Republican Other A Frequency 17 19 Democrat 17 Republican 19 Other 10 What is the relative frequency for Democrat 0 413 0 217 0 270 0 370

Statistics
StatisticsFor each of the following implications state the converse inverse and contrapositiv a If a quadrilateral is a parallelogram then its opposite sides are congruent b If an angle is not acute then it is a right angle c If he is mad then he wants to smile d If a number is a whole number then it is not a natural number

Statistics
StatisticsFollowing are the running times in minutes for the 12 top grossing movies rated PG or PG 13 and the 12 top grossing movies rated R for the recent weekend Construct back to back stem and leaf plots for these data sets If there are no leaves on a particular stem select the None button Movies rated PG or PG 13 The Last Exorcism Part II Quartet The Hobbit An Unexpected Journey Jack the Giant Slayer The Incredible Burt Wonderstone Escape From Planet Earth Lincoln Life of Pi Oz The Great and Powerful Wreck It Ralph Snitch Safe Haven Source Box Office Mojo Send data to Excel PG or PG 13 R None 88 98 Movies rated R Identity Thief A Good Day to Die Hard 166 114 100 89 145 126 127 No 108 112 Spring Breakers 115 The Call Source Box Office Mojo Zero Dark Thirty Dead Man Down 21 and Over Argo Hansel and Gretel Witch Hunters Parker Silver Linings Playbook 111 97 157 110 93 120 88 118 118 122 94 95

Statistics
StatisticsYou and 10 other people are in a drawing to win a free car You have to pick a number from 2 to 12 The winner of the car will be determined from rolling two dice The sum of the dice will determine the winning number a Write a sample space of the possible rolls of the dice Write a sample space for the sums b Create a frequency table for the sums c What is the probability of rolling a sum of 4 Write your answer in fraction and percent form d What is the probability of rolling a sum of 10 Write your answer in fraction and percent form e If the probability 1 9 what is the number of the sum f Using your sample space determine which number would have the highest probability for you to win the car Explain why this is the highest probability

Statistics
Probabilitygrade for a statistics student are given What is the student s weighted mean score The student s weighted mean score is 91 50 Simplify your answer Round to two decimal places as needed W Homework Quiz Quiz Project Final Exam Score Percent 88 85 98 95 88

Statistics
ProbabilityYou plan to take a 1905 mile trip in your car which averages 30 miles per gallon How many gallons of gasoline should you expect to use Would a car that has only half the gas mileage require twice as much gasoline for the same trip Explain You should expect to use about Type an integer or a decimal gallons of gasoline

Statistics
Statistics3 2 Accidents on a DIKE Pain Examining te 8 mile bike path shows that they occur uniformly along the length of the path Figure 3 4 displays the density curve that describes the distribution of accidents Height 1 8 1 16 1 O 1 2 3 4 5 om 6 Distance along bike path miles 7 8 FIGURE 3 4 The density curve for the location of accidents along an 8 mile bike path for Exercise 3 2 Mean Median and Quartiles The density curve pictured in Figure on page 78 is called a uniform density Because of the ease of computing under this density curve it allows many computations to be done by hand a What is the mean u of the density curve pictured in Figure 3 4 That where would the curve balance What is the median That is where i point with area 0 5 on either side

Statistics
Statistics5 Upper Arm Lengths Anthropomorphic data are measurements on the human body that can track growth and weight of infants and children and evalu ate changes in the body that occur over the adult life span The resulting data can be used in areas as diverse as ergonomics and clothing design The upper arm length of males over 20 years old in the United States is approximately Normal with mean 39 1 centimeters cm and standard deviation 2 3 cm Draw a Normal curve on which this mean and standard deviation are correctly located Hint Draw an unlabeled Normal curve locate the points where the curvature changes then add number labels on the horizontal avis

Statistics
Statistics5 Here are the weights in ounces of 36 navel oranges selected from a large shipment to a grocery store 5 7 5 4 5 8 5 3 4 6 4 9 5 6 5 3 5 5 5 5 5 4 5 8 5 3 5 5 5 5 5 4 5 8 5 9 5 4 5 1 5 0 5 5 5 7 4 9 5 0 5 3 5 1 5 2 5 7 5 6 5 8 4 5 5 2 5 4 5 7 5 6

Statistics
StatisticsWhat s your percentile Reports on a students test score such as the SAT or a child s height or weight usu ally give the percentile as well as the actual value of the variable The percentile is just the cumulative propor tion stated as a percent the percent of all values of the variable that were lower than this one The upper arm lengths of females in the United States are approximately Normal with mean 35 8 cm and standard deviation 2 1 cm and those for males are approximately Normal with mean 39 1 cm and standard deviation 2 3 cm a Cecile a 73 year old female in the United States has an upper arm length of 33 9 cm What is her percentile b Measure your upper arm length to the nearest tenth of a centimeter referring to Exercise 3 5 page 84 for the measurement instructions What is your

Statistics
Statistics7 The middle half The quartiles of any distribution are the values with cumulative proportions 0 25 and 0 75 They span the middle half of the distribu tion What are the quartiles of the distribution of gas mileage