Statistics Questions
The best high school and college tutors are just a click away, 24×7! Pick a subject, ask a question, and get a detailed, handwritten solution personalized for you in minutes. We cover Math, Physics, Chemistry & Biology.

Statistics
StatisticsConsider the data set given below 34 47 31 23 20 41 28 10 22 17 17 Find the 5 number summary of this data a Minimum b Q1 c Median d Q3 e Maximum

Statistics
Statisticsa The mean is closest to b The median is closest to A B C c Is this data skewed to the right symmetric or skewed to the left Enter SKEWED RIGHT SYMMETRIC or SKEWED LEFT without the quotations

Statistics
StatisticsOne cubic foot holds 7 48 gallons of water and 1 gallon of water weighs 8 33 pounds How much does 7 3 cubic feet of water weigh in pounds In tor Click the icon to view the USCS measurements The weight in pounds is approximately lb

Statistics
StatisticsA certain race is a distance of 32 furlongs How far is the race in a yards b feet Click the icon to view the USCS measurements a The race is yards Type an integer or a decimal

Statistics
Statistics4 14 A credit union takes a sample of four mortgages each month to survey the homeowners satisfaction with the credit union s servicing of their mortgage Each mortgage is classified as a fixed rate F or variable rate V a What are the 16 possible combinations of the four mortgages Hint One such possibility would be F V V3F4 b List the combinations in event A At least three of the mortgages are variable rate
Statistics
Probability4 8 The state vehicle inspection bureau provided the following information on the percentage of cars that fail an annual vehicle inspection due to having faulty lights 15 of all cars have one faulty light 10 have two faulty lights and 5 have three or more faulty lights a What is the probability that a randomly selected car will have no faulty lights b What is the probability that a randomly selected car will have at most one faulty light c What is the probability that a randomly selected car will fail an inspection due to a faulty light

Statistics
Statisticsu are studying the effects of smoking by pregnant women on rates of asthma in their ildren You collect data on the number of cigarettes smoked per day and whether or not the ild developed asthma by the age of two The data is below moked 1 5 cigarettes per day 9 3 developed asthma oked 6 10 cigarettes per day 10 4 developed asthma oked 11 20 cigarettes per day 25 5 developed asthma moked 21 40 cigarettes per day 35 1 developed asthma moked 41 60 cigarettes per day 38 4 developed asthma order to study the relationship between the number of cigarettes smoked by pregnant women per day and the rcentage of their children developed asthma by the age of two using statistical knowledge we convert the above ta into the following format and see if we can obtain an adequate fit using linear regression 4 Average number of cigarettes smoked per day 3 8 Percentage of children developed asthma hat is the value of the correlation coefficient Type numbers in the be by Part 1 10 points aby Part 2 10 points 20 points 15 5 30 5 50 5 9 3 10 4 25 5 35 1 38 4 Round your answer to 4 decimal places sume that the best fit line of the above data set is a good model for the study For expectant mothers who smoke 14 garettes per day what is the expected percentage of children who will develop asthma by the age of two percent Round your answer to 1 decimal place

Statistics
StatisticsConsider the following scatterplot regression equation and correlation of midterm and final exam scores for a class of 15 students Which of the following are true statements Y 90 6 0 489x r 0 602 Final Exam Score 110 100 90 80 70 60 50 40 30 20 0 0 20 0 0 40 80 60 Mdterm Exam Score O 100 Select one answer 10 points I The same number of students scored 100 on the midterm exam as scored 100 on the final exam II Students who scored higher on the midterm exam tended to score higher on the final exam III The correlation between midterm and final exam scores is negative IV The standard deviation of the final exam scores is greater than the standard deviation of the midterm exam scores A O I III and IV B O II and III C OI II III and IV D I and III EQI and IV

Statistics
StatisticsGiven the following summary statistics determine the regression equation used to predict y from x Round all answers to 2 decimal places slope 0 53 Sy 2 17 ST 2 74 7 X y 0 67 21 96 75 32 Type numbers in t aby Part 1 10 poin by Part 2 10 poin 20 points

Statistics
StatisticsConsider the following X 41 63 73 106 114 Y 214 223 172 124 101 1 What is slope of the regression line predicting Y from X rounded to 2 decimal places 1 68 2 What is the intercept of the regression line predicting Y from X rounded to 2 decimal places 2 99 3 What is the correlation between X and Y rounded to 2 decimal places Type numbers in the boxes by Part 1 10 points aby Part 2 10 points aby Part 3 10 points 30 points

Statistics
StatisticsConsider the following table summarizing the speed limit of a certain road and the number of Type numbers in the boxes accidents occurring on that road in January Part 1 10 points ab Part 2 10 points ab Part 3 10 points 30 points Posted Speed Limit 57 46 42 40 22 24 Reported Number of Accidents 28 27 20 18 18 10 1 Find the slope of the regression line predicting the number of accidents from the posted speed limit Round to 3 decimal places 2 Find the intercept of the regression line predicting the number of accidents from the posted speed limit Round to 3 decimal places 3 Predict the number of reported accidents for a posted speed limit of 32mph Round to the nearest whole number

Statistics
Probability10 points When buying a home the interest rate given on a loan typically depends on the applicant s credit score The Fair Isaac Corporation FICO is a major producer of credit scores The following table contains 10 randomly selected loan applicants along with their FICO scores and the interest they were given when financing their homes 3 A O 0 0144 B O 0 9642 C 0 9819 4 6 7 FICO Score Interest Rate 0 756 679 5 677 527 839 686 512 590 9 765 10 502 6 32 7 85 10 2 5 52 7 3 7 37 9 67 8 4 5 82 10 01 The linear correlation coefficient between FICO score and home loan interest rate is Select one ans
Statistics
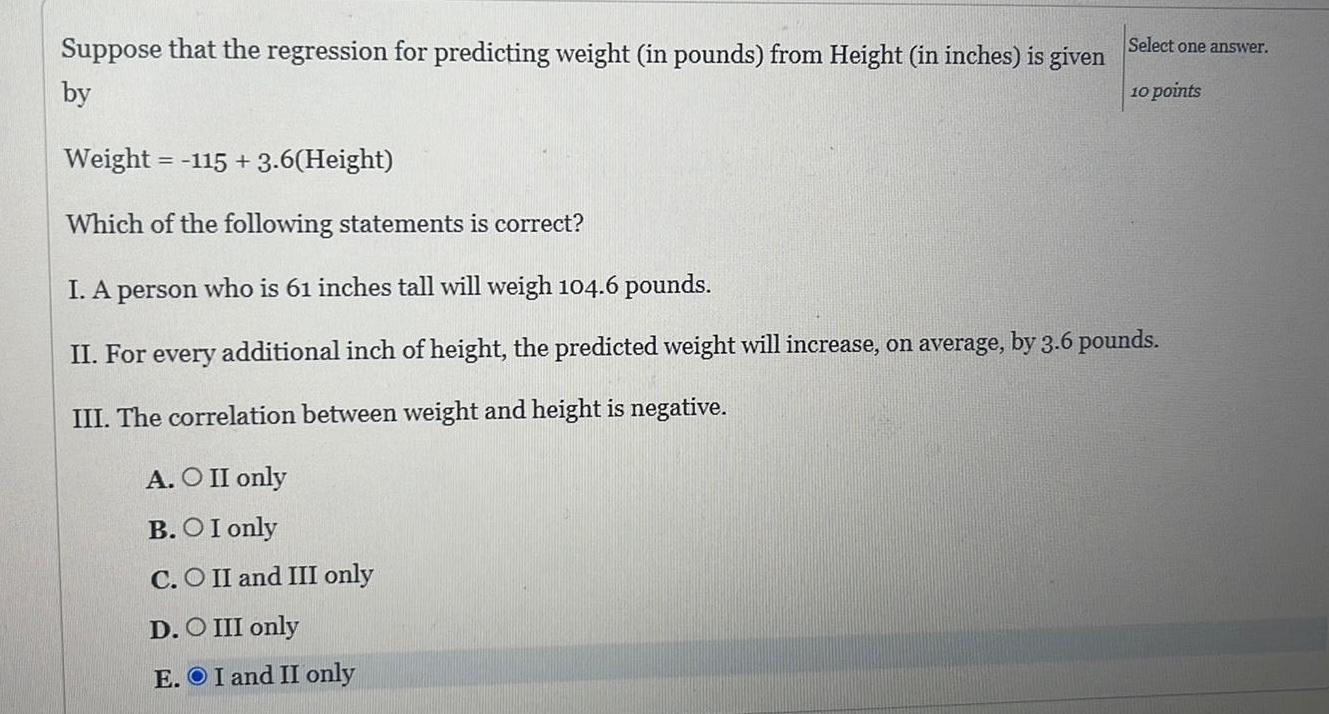
StatisticsSuppose that the regression for predicting weight in pounds from Height in inches is given by Select one answer 10 points Weight 115 3 6 Height Which of the following statements is correct I A person who is 61 inches tall will weigh 104 6 pounds II For every additional inch of height the predicted weight will increase on average by 3 6 pounds III The correlation between weight and height is negative A O II only B OI only C O II and III only D O III only E OI and II only

Statistics
StatisticsA local ice cream shop kept track of the number of cans of cold soda it sold each day and the temperature that day for two months during the summer The data are displayed in the scatterplot below Number of Cans Sold 195 190 185 180 175 170 165 65 95 Temperature in degrees Fahrenheit F 75 85 Select one answer 10 points The one outlier corresponds to a day on which the refrigerator for the soda was broken Which of the following is true A O A reasonable value of the correlation coefficient r for these data is 1 2 B O If the temperature were measured in degrees Celsius C 5 9 F 32 the value of r would change accordingly C If the outlier were removed r would increase D Off the outlier were removed r would decrease

Statistics
ProbabilityThe data in the scatterplot below are an individual s weight and the time it takes in seconds on a treadmill to raise his or her pulse rate to 140 beats per minute The o s correspond to females and the s to males Which of the following conclusions is most accurate Time 165 155 145 135 125 115 90 O 00 O 100 110 120 130 140 xx O Weights 150 160 170 180 A O There is a positive correlation between time and weight for males and for females B O There is a negative correlation between gender and weight C O There is a positive correlation between gender and weight D There is a negative correlation between time and weight for males and for females 0 F M Select one answer 10 points

Statistics
ProbabilityWhat can we say about the relationship between the correlation r and the slope b of the least squares line for the same set of data A O The slope b is always equal to the square of the correlation r B Or and b have the same sign or C Or is always larger than b D Ob is always larger than r E O Both r and b always have values between 1 and 1 Select one answer 10 points

Statistics
StatisticsType numbers in the boxes In psychology aptitude tests are designed to measure the ability to learn Questions are designed to be age appropriate so as not to be biased toward age due to knowledge acquired In 10 points this study an aptitude test is given on the skills necessary to use apps on a smart phone An aptitude test with a maximum score of 150 is given to measure the ability to learn how to use apps on a smartphone The regression line for the predicted value of aptitude given age is as follows Aptitude 110 8 1 12 Age Find the expected aptitude test score for a person whose age is 18 years Your answer should be rounded to the nearest whole number 90

Statistics
ProbabilitySuppose that the correlation r between two quantitative variables was found to be r 0 Which of the following is the best interpretation of this correlation value A O There is a strong linear relationship between the two variables B There is no linear relationship between the two variables C O There is a strong relationship between the two variables D O There is no relationship between the two variables Select one answer 10 points

Statistics
ProbabilityThe data in the scatterplot below are an individual s age in years and the expected life span in years The circles correspond to females and the x s to males Which of the following conclusions is most accurate Life Expectancy 90 70 60 50 40 30 20 10 0 0 x xo x 20 ex of 40 Age 60 80 X Male Female Select one answer 10 points A O There is a positive correlation between gender and life expectancy B O There is a negative correlation between gender and life expectancy C O There is a positive correlation between age and life expectancy for both males and females D There is a negative correlation between age and life expectancy for both males and females

Statistics
Probability3 Out of a group of 120 students that were surveyed about winter sports 28 said they ski and 52 said they snowboard Sixteen of the students who said they ski said they also snowboard Find P snowboard ski

Statistics
Probability2 A coach needs to choose two players from the hockey team to be captain and assistant captain If there are 20 players on the team how many ways he can assign the two roles

Statistics
ProbabilityThe spinner below is spun twice If the spinner lands on a border that spin does not count and spin again It is equally likely that the spinner will land in each of the six sectors K RED BLUE BLUE RED RED CYAN 94 For each question below enter your response as a reduced fraction Find the probability of spinning cyan on the first spin and blue on the second spin Find the probability of spinning blue on the first spin and cyan on the second spin Find the probability of NOT spinning blue on either spin Not blue on the first spin and not blue on the second spin

Statistics
StatisticsThe mean number of newspapers for sale in an airport newsstand is 11 4 with a standard deviation of 4 2 The mean age of the pilots is 37 9 with a standard deviation of 6 1 Compare the two tests and determine which data set has more variation

Statistics
Probability4 16 The population distribution in the United States based on race ethnicity and blood type as reported by the American Red Cross is given here Race Ethnicity White Black Asian All others 0 36 7 1 7 1 5 Blood Type A B 32 2 8 8 2 9 2 5 1 2 8 1 3 AB 3 2 5 3 1 a A volunteer blood donor walks into a Red Cross blood donation center What is the probability she will be Asian and have Type O blood b What is the probability that a white donor will not have Type A blood c What is the probability that an Asian donor will have either Type A or Type B blood d What is the probability that a donor will have neither Type A nor Type AB blood

Statistics
Probabilityov 4 3 sic sic sic sic us The state vehicle inspection bureau provided following information on the percentage of cars that fail an annual vehicle inspection due to having faulty lights 15 of all cars have one faulty light 10 have two faulty lights and 5 have three or more faulty lights a What is the probability that a randomly selected car will have no faulty lights b What is the probability that a randomly selected car will have at most one faulty light c What is the probability that a randomly selected car will fail an inspection due to a faulty light 4 9 The Texas Lottery has a game Daily 4 in which a player pays 1 to select four single digit numbers Each week the Lottery commission places a set of 10 balls numbered 0 9 in each of four containers After the balls are thoroughly mixed one ball is selected from each of the four containers The winner is the player who matches all four numbers a What is the probability of being the winning player if you purchase a single set of four numbers b Which of the probability approaches subjective classical or relative frequency did you employ in obtaining your answer in part a Basic Event Relations and Probability Laws 4 10 A die is rolled two times Provide a list of the possible outcomes of the two rolls in this form the result from the first roll and the result from the second roll 4 11 Refer to Exercise 4 10 Assume that the die is a fair die that is each of the outcomes has a probability of 1 36 What is the probability of observing a Event A Exactly one dot appears on each of the two upturned faces b Event B The sum of the dots on the two upturned faces is exactly 4 c Event C The sum of the dots on the two upturned faces is at most 4 4 12 Refer to Exercise 4 11 a Describe the event that is the complement of event A b Compute the complement of event A 4 13 Refer to Exercise 4 11 a Are events A and B mutually exclusive b Are events A and C mutually exclusive c Are events B and C mutually exclusive 4 14 A credit union takes a sample of four mortgages each month to survey the homeowners satisfaction with the credit union s servicing of their mortgage Each mortgage is classified as a fixed rate F or variable rate V a What are the 16 possible combinations of the four mortgages Hint One such possibility would be FjV V3F4

Statistics
StatisticsMass of nutmeg powder Mass of empty round bottom flask Mass of round bottom flask with Trimyristin Percent recovery of Crude Trimyristin Calculation Mass of Recrystallized Pure Trimyristin Recrystallization Yield Calculation Percent Recovery of Pure Trimyristin Calculation Note Calculations All work must be shown to receive credit 5 0g 76 56129 77 70319 23 878 0 18359 15 6985 8 67

Statistics
Probability10 Suppose there are 15 million part time workers and 100 million full time workers in an economy 2 million of the part time workers switch to full time work As a result what happens to the unemployment rate

Statistics
Statistics8 Assume the following data for a country total population 500M population under 16 years of age or institutionalized 120M not in labor force 150M unemployed 23M part time workers 10M What is the size of the labor force What is the unemployment rate What about the labor force participation rate

Statistics
Statistics2 Suppose that a country s annual growth rates were 5 3 4 1 2 2 3 4 6 and 3 in yearly sequence over a 10 year period Identify which stage of the business cycle each year belong to

Statistics
StatisticsA sample of 20 participants took part in a hearing experiment Among other things the absolute hearing threshold in decibels was measured for each participant The 20 measurements were as follows 25 22 18 35 37 34 31 27 24 21 18 39 36 33 20 20 20 17 17 17 Send data to calculator Draw the histogram for these data using an initial class boundary of 16 5 an ending class boundary of 41 5 and 5 classes of equal width Note that you can add or remove classes from the figure Label each class with its endpoints Frequency 10 9 8 7 6 Ch 0 LE Lind 0 throshold in decibels D 0 Q 0 00 00 0 X S

Statistics
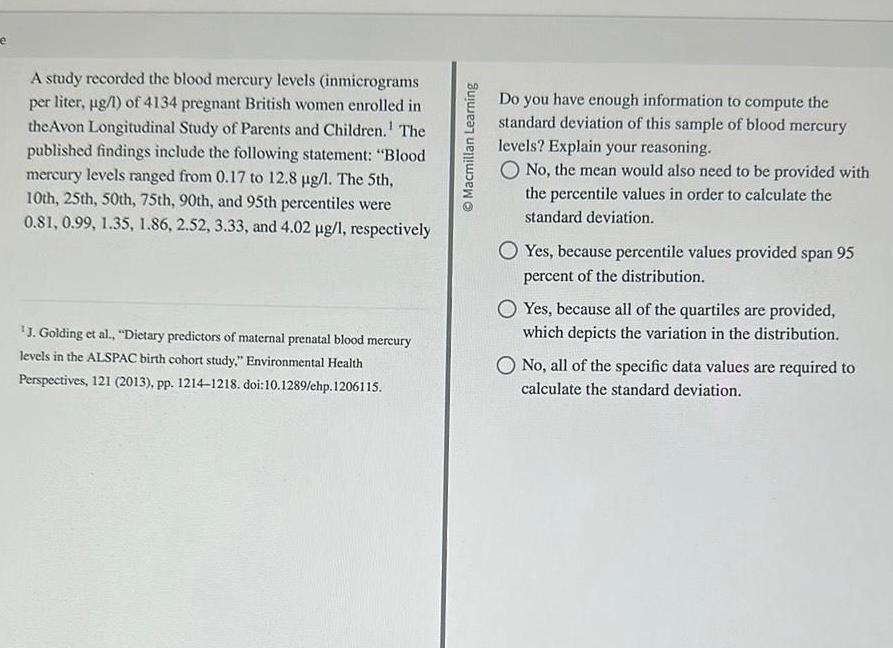
Statisticsde A study recorded the blood mercury levels inmicrograms per liter g l of 4134 pregnant British women enrolled in the Avon Longitudinal Study of Parents and Children The published findings include the following statement Blood mercury levels ranged from 0 17 to 12 8 g l The 5th 10th 25th 50th 75th 90th and 95th percentiles were 0 81 0 99 1 35 1 86 2 52 3 33 and 4 02 g l respectively J Golding et al Dietary predictors of maternal prenatal blood mercury levels in the ALSPAC birth cohort study Environmental Health Perspectives 121 2013 pp 1214 1218 doi 10 1289 ehp 1206115 Macmillan Learning What are the range and the interquartile range for this distribution Range Interquartile range

Statistics
StatisticsThe mean and standard deviation s measure center and spread but are not a complete description of a distribution Data sets with different shapes can have the same mean and standard deviation To demonstrate this fact use your calculator to find and s for these two small data sets Then make a dotplot of each and comment on the shape of each distribution D a t a DAL a 9 14 8 14 8 74 8 77 9 26 8 10 6 13 3 t 6 58 5 76 7 71 8 84 8 47 7 04 5 25 5 a B To access the complete data set click the link for your preferred software format Excel Minitab14 18 Minitab18 JMP SPSS TI R Mac TXT PC TXT CSV CrunchIt Macmillan Learning what is rounded to three decimal places XA What is the standard deviation for data set A Enter your answer rounded to three decimal places SA your What is the mean of data set B Enter your answer rounded to three decimal places XB What is the standard deviation for data set B Enter your answer rounded to three decimal places SB

Statistics
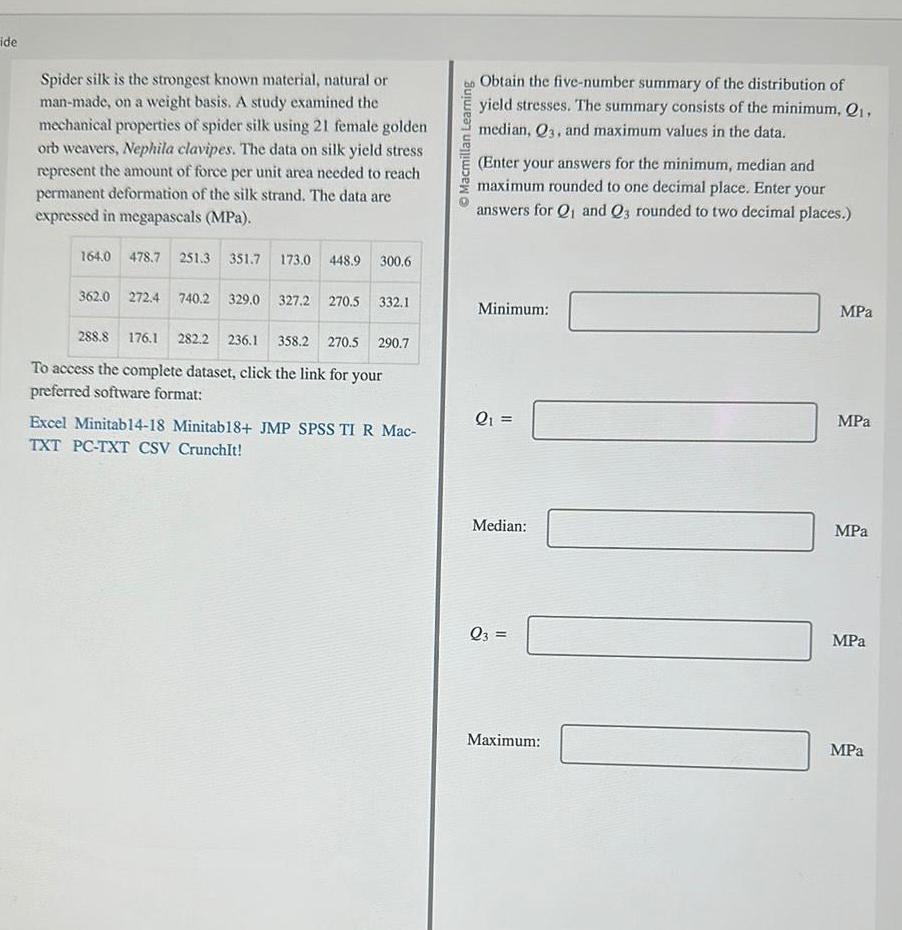
Statisticsde by Side Spider silk is the strongest known material natural or man made on a weight basis A study examined the mechanical properties of spider silk using 21 female golden orb weavers Nephila clavipes The data on silk yield stress represents the amount of force per unit area needed to reach permanent deformation of the silk strand The data are expressed in megapascals MPa 164 0 478 7 251 3 351 7 173 0 448 9 300 6 362 0 272 4 740 2 329 0 327 2 270 5 332 1 288 8 176 1 282 2 236 1 358 2 270 5 290 7 To access the complete dataset click the link for your preferred software format Excel Minitab14 18 Minitab 18 JMP SPSS TI R Mac TXT PC TXT CSV Crunchlt Macmillan Learning Choose the answer that has the data value s that qualify as suspected outlier s 164 0 MPa 740 2 MPa 164 0 MPa 740 2 MPa There are no data values that qualify as suspected outlier s

Statistics
Statisticsy Side NASA s Goddard Institute for Space Studies GISS allows you to download historical temperature records for locations worldwide The data file contains monthly temperature data in degrees Celsius for Los Angeles since 1880 Examine the distribution of meteorological annual mean temperatures metANN column in degrees Celsius C To access the complete data set click the link for your preferred software format Excel Minitab 14 18 Minitab 18 JMP SPSS TI R Mac TXT PC TXT CSV Crunchlt GISS Surface Temperature Analysis https data giss nasa gov gistemp station data Macmillan Learning Obtain the mean and the median for the metANN variable Enter your answers rounded to one decimal place XI 11 M How do the mean and the median compare The mean is much larger than the median The median is much larger than the mean The mean is slightly larger than the median The mean is equal to the median

Statistics
Statisticsde NASA s Goddard Institute for Space Studies GISS allows you to download historical temperature records for locations worldwide The data file contains monthly temperature data in degrees Celsius for Los Angeles since 1880 Examine the distribution of meteorological annual mean temperatures metANN column in degrees Celsius C To access the complete data set click the link for your preferred software format Excel Minitab 14 18 Minitab 18 JMP SPSS TI R Mac TXT PC TXT CSV CrunchIt GISS Surface Temperature Analysis https data giss nasa gov gistemp station data Macmillan Learning Is it likely that NASA repeatedly made the same data entry error in recording temperatures in Los Angeles What do you think is the most likely explanation for using the value 999 9 in the data file you downloaded They are likely not data entry errors The most likely explanation is 999 9 was used as a special code for years that did not have an annual mean temperature recorded They are likely data entry errors The most likely explanation is 999 9 was supposed to be entered as 99 9 They are likely not data entry errors The most likely explanation is 999 9 was supposed to be entered as 99 9 They are likely data entry errors The most likely explanation is 999 9 was used as a special code for years that did not have an annual mean temperature recorded

Statistics
StatisticsMacmillan Learning Spider silk is the strongest known material natural or man made on a weight basis A study examined the mechanical properties of spider silk using 21 female golden orb weavers Nephila clavipes The data on silk yield stress represents the amount of force per unit area needed to reach permanent deformation of the silk strand The data are expressed in megapascals MPa 164 0 478 7 251 3 351 7 173 0 362 0 272 4 740 2 329 0 448 9 327 2 270 5 300 6 332 1 288 8 176 1 282 2 236 1 358 2 270 5 290 7 Click to download the data in your preferred format Excel Minitab14 18 Minitab18 JMP SPSS TI R Mac TXT PC TXT CSV CrunchIt Use the software of your choice to make a dotplot of these data Select the correct description of the shape center and spread of the distribution O The distribution is unimodal and extremely left skewed except for a high outlier The center is approximately 240 MPa The spread is from 164 0 to 740 2 MPa The distribution is unimodal and extremely left skewed except for a high outlier The center is approximately 350 MPa The spread is from 164 0 to 478 7 MPa The distribution is unimodal and essentially symmetric except for a high outlier The center is approximately 291 MPa The spread is from 164 0 to 740 2 MPa The distribution is unimodal and essentially symmetric except for a high outlier The center is approximately 291 MPa The spread is from 164 0 to 478 7 MPa

Statistics
StatisticsA study of a new type of vision screening test recruited a sample of 175 children age three to seven years The publication provides the summary of the children s ages Twelve patients 7 were three years old 33 19 four years old 29 17 five years old 69 39 six years old and 32 18 seven years old Click to download the data in your preferred format Excel Minitab14 18 Minitab18 JMP SPSS TI R Mac TXT PC TXT CSV Crunchit T Yamada et al A new computer based pediatric vision screening test Journal of AAPOS 19 2015 pp 157 162 doi 10 1016 j jaapos 2015 01 011 Macmillan Learning Use software of your choice to display the reported ages in a histogram Compare the values of the mean and the median in relation to the age distribution in the study What general fact does your comparison illustrate Select the correct histogram and accompanying explanation Since the mean is less than the median we expect the histogram to be left skewed The histogram validates this fact H Since the mean is less than the median we expect the histogram to be left skewed The histogram validates this fact Since the mean is more than the median we expect the histogram to be right skewed The histogram validates this fact
Statistics
Statisticside Spider silk is the strongest known material natural or man made on a weight basis A study examined the mechanical properties of spider silk using 21 female golden orb weavers Nephila clavipes The data on silk yield stress represent the amount of force per unit area needed to reach permanent deformation of the silk strand The data are expressed in megapascals MPa 164 0 478 7 251 3 351 7 173 0 448 9 300 6 362 0 272 4 740 2 329 0 327 2 270 5 332 1 288 8 176 1 282 2 236 1 358 2 270 5 290 7 To access the complete dataset click the link for your preferred software format Excel Minitab14 18 Minitab18 JMP SPSS TI R Mac TXT PC TXT CSV CrunchIt Macmillan Learning Obtain the five number summary of the distribution of yield stresses The summary consists of the minimum Q1 median Q3 and maximum values in the data Enter your answers for the minimum median and maximum rounded to one decimal place Enter your answers for Q and Q3 rounded to two decimal places Minimum Q Median Q3 Maximum MPa MPa MPa MPa MPa

Statistics
ProbabilitySuppose that your boss must choose three employees in your office to attend a conference in Jamaica Because all 21 of you want to go he decides that the only fair way is to draw names out of a hat What is the probability that you Laura and Alan are chosen Enter a fraction or round your answer to 4 decimal places if necessary Answer Tables Keypad Keyboard Shortcuts
Statistics
Statisticse A study recorded the blood mercury levels inmicrograms per liter g l of 4134 pregnant British women enrolled in the Avon Longitudinal Study of Parents and Children The published findings include the following statement Blood mercury levels ranged from 0 17 to 12 8 g l The 5th 10th 25th 50th 75th 90th and 95th percentiles were 0 81 0 99 1 35 1 86 2 52 3 33 and 4 02 g l respectively J Golding et al Dietary predictors of maternal prenatal blood mercury levels in the ALSPAC birth cohort study Environmental Health Perspectives 121 2013 pp 1214 1218 doi 10 1289 ehp 1206115 Macmillan Learning Do you have enough information to compute the standard deviation of this sample of blood mercury levels Explain your reasoning O No the mean would also need to be provided with the percentile values in order to calculate the standard deviation O Yes because percentile values provided span 95 percent of the distribution OYes because all of the quartiles are provided which depicts the variation in the distribution O No all of the specific data values are required to calculate the standard deviation

Statistics
StatisticsTwo history classes with the same number of students took a final exam The box and whisker plots below sometimes called boxplots summarize the test scores for each class Use the box and whisker plots to answer the questions H 55 60 65 70 75 Test score b Which class had a higher median test score 80 a A score above 70 is considered passing Which class had more passing scores c Which class had the highest test score 85 d Which class had test scores with a larger interquartile range IQR 90 Class A Class B Choose one Choose one Choose one Choose one 95

Statistics
StatisticsMacmillan Learning A study of a new type of vision screening test recruited a sample of 175 children age three to seven years The publication provides the summary of the children s ages Twelve patients 7 were three years old 33 19 four years old 29 17 five years old 69 39 six years old and 32 18 seven years old 1 Click to download the data in your preferred format Excel Minitab14 18 Minitab18 JMP SPSS TI R Mac TXT PC TXT CSV Crunchlt IT Yamada et al A new computer based pediatric vision screening test Journal of AAPOS 19 2015 pp 157 162 doi 10 1016 j jaapos 2015 01 011 What is the mean age in the study You will need to either organize the data in a way that your technology will accept or do the computations by hand If so be sure to multiply each age by the number of children with that age in the numerator of the formula for the mean Enter your answer rounded to one decimal place

Statistics
StatisticsYou need to have a password with 6 letters followed by 2 odd digits between 0 and 9 inclusive If the characters and digits cannot be used more than once how many choices do you have for your password Answer Tables Keypad

Statistics
ProbabilityMacmillan Learning NASA s Goddard Institute for Space Studies GISS allows you to download historical temperature records for locations worldwide Go to http data giss nasa gov gistemp station data scroll down to Download Station Data and type Los Angeles You may be interested in looking up your own location as well A new page appears with a link to the Los Angeles California station data Click on this link to the next page which should contain a time plot of the annual mean temperature in degrees Celsius for Los Angeles since 1880 and a link to Download monthly data as text If this URL isn t working you can access the data set using one of the links provided To access the complete data set click the link for your preferred software format Excel Minitab14 18 Minitab18 JMP SPSS TI R Mac TXT PC TXT CSV CrunchIt Now clean up the data so that only true temperature values will be plotted You can do this by editing either the original text file or the data in your statistical software Take the time to consider how your specific software handles missing data if an empy cell won t work see your software s help function Create both a dotplot and a time plot of the cleaned up annual mean temperatures Interpret your graphs and conclude in context The time plot reveals in Los Angeles from 1 regular irregular up and down cycles with he dotplot reveals that the Y an overall decrease a relatively flat change an overall increase in annual mean temperatures mperatures is

Statistics
StatisticsA hardware company has sales agents in 6 states The number of agents in each state is shown in the bar graph below Using this bar graph answer the questions Number of Sales Agents 12 10 8 6 4 2 0 Maryland Indiana Arizona Colorado Illinois Missouri State a Which state has the fewest sales agents Maryland O Indiana O Arizona How many sales agents does that state have agent s Colorado O Illinois b How many more sales agents are in Colorado than in Indiana more agent s c How many states have more than 10 sales agents state s O Missouri
Statistics
StatisticsJohn has scored 12 23 and 19 points in his three basketball games so far How many points does he need to score in his next game so that his average mean is 19 points per game points X

Statistics
StatisticsConsider the following list of numbers 65 229 4 8 11 2 a Determine the maximum and minimum values b Calculate the mean and median a The maximum value is The minimum value is b The mean is 11 Round to the nearest hundredth as needed

Statistics
StatisticsThe U S Census tracks the percentage of persons 25 years or older who are college graduates That data for several years is given in the table below Determine whether the trend appears linear If so and assuming the trend continues in what year will the percentage first exceed 34 Round your answer down to the nearest year If the trend does not appear linear enter NOT LINEAR 2018 X Year Percent Graduates 1990 21 3 1992 21 4 1994 22 2 1996 23 6 1998 24 4 2000 25 6 2002 26 7 2004 27 7 2006 28 2008 29 4 Recall the definition of a line of best fit Plot the data to determine if there is a linear trend If there is a linear trend sketch a line that has a minimal distance from all points How can the endpoints of the sketched line be used to find a modeling function Is the given innut

Statistics
StatisticsApproximate the mean of the frequency distribution for the ages of the residents of a town Age 0 9 10 19 20 29 30 39 40 49 50 59 60 69 70 79 80 89 Frequency 3521HTS 39 22 19 42 40 17 9 C The approximate mean age is years Round to one decimal place as needed

Statistics
StatisticsA box contains 18 green marbles and 7 white marbles If the first marble chosen was a white marble what is the probability of choosing without replacement another white marble Express your answer as a fraction or a decimal number rounded to four decimal places Answer How to enter your answer opens in new window Tables Keypad