Probability Questions and Answers

Statistics
ProbabilitySuppose that the correlation r between two quantitative variables was found to be r 0 Which of the following is the best interpretation of this correlation value A O There is a strong linear relationship between the two variables B There is no linear relationship between the two variables C O There is a strong relationship between the two variables D O There is no relationship between the two variables Select one answer 10 points

Statistics
ProbabilityThe data in the scatterplot below are an individual s age in years and the expected life span in years The circles correspond to females and the x s to males Which of the following conclusions is most accurate Life Expectancy 90 70 60 50 40 30 20 10 0 0 x xo x 20 ex of 40 Age 60 80 X Male Female Select one answer 10 points A O There is a positive correlation between gender and life expectancy B O There is a negative correlation between gender and life expectancy C O There is a positive correlation between age and life expectancy for both males and females D There is a negative correlation between age and life expectancy for both males and females

Statistics
Probability3 Out of a group of 120 students that were surveyed about winter sports 28 said they ski and 52 said they snowboard Sixteen of the students who said they ski said they also snowboard Find P snowboard ski

Statistics
Probability2 A coach needs to choose two players from the hockey team to be captain and assistant captain If there are 20 players on the team how many ways he can assign the two roles

Statistics
ProbabilityThe spinner below is spun twice If the spinner lands on a border that spin does not count and spin again It is equally likely that the spinner will land in each of the six sectors K RED BLUE BLUE RED RED CYAN 94 For each question below enter your response as a reduced fraction Find the probability of spinning cyan on the first spin and blue on the second spin Find the probability of spinning blue on the first spin and cyan on the second spin Find the probability of NOT spinning blue on either spin Not blue on the first spin and not blue on the second spin

Statistics
Probability4 16 The population distribution in the United States based on race ethnicity and blood type as reported by the American Red Cross is given here Race Ethnicity White Black Asian All others 0 36 7 1 7 1 5 Blood Type A B 32 2 8 8 2 9 2 5 1 2 8 1 3 AB 3 2 5 3 1 a A volunteer blood donor walks into a Red Cross blood donation center What is the probability she will be Asian and have Type O blood b What is the probability that a white donor will not have Type A blood c What is the probability that an Asian donor will have either Type A or Type B blood d What is the probability that a donor will have neither Type A nor Type AB blood

Statistics
Probabilityov 4 3 sic sic sic sic us The state vehicle inspection bureau provided following information on the percentage of cars that fail an annual vehicle inspection due to having faulty lights 15 of all cars have one faulty light 10 have two faulty lights and 5 have three or more faulty lights a What is the probability that a randomly selected car will have no faulty lights b What is the probability that a randomly selected car will have at most one faulty light c What is the probability that a randomly selected car will fail an inspection due to a faulty light 4 9 The Texas Lottery has a game Daily 4 in which a player pays 1 to select four single digit numbers Each week the Lottery commission places a set of 10 balls numbered 0 9 in each of four containers After the balls are thoroughly mixed one ball is selected from each of the four containers The winner is the player who matches all four numbers a What is the probability of being the winning player if you purchase a single set of four numbers b Which of the probability approaches subjective classical or relative frequency did you employ in obtaining your answer in part a Basic Event Relations and Probability Laws 4 10 A die is rolled two times Provide a list of the possible outcomes of the two rolls in this form the result from the first roll and the result from the second roll 4 11 Refer to Exercise 4 10 Assume that the die is a fair die that is each of the outcomes has a probability of 1 36 What is the probability of observing a Event A Exactly one dot appears on each of the two upturned faces b Event B The sum of the dots on the two upturned faces is exactly 4 c Event C The sum of the dots on the two upturned faces is at most 4 4 12 Refer to Exercise 4 11 a Describe the event that is the complement of event A b Compute the complement of event A 4 13 Refer to Exercise 4 11 a Are events A and B mutually exclusive b Are events A and C mutually exclusive c Are events B and C mutually exclusive 4 14 A credit union takes a sample of four mortgages each month to survey the homeowners satisfaction with the credit union s servicing of their mortgage Each mortgage is classified as a fixed rate F or variable rate V a What are the 16 possible combinations of the four mortgages Hint One such possibility would be FjV V3F4

Statistics
Probability10 Suppose there are 15 million part time workers and 100 million full time workers in an economy 2 million of the part time workers switch to full time work As a result what happens to the unemployment rate

Statistics
ProbabilitySuppose that your boss must choose three employees in your office to attend a conference in Jamaica Because all 21 of you want to go he decides that the only fair way is to draw names out of a hat What is the probability that you Laura and Alan are chosen Enter a fraction or round your answer to 4 decimal places if necessary Answer Tables Keypad Keyboard Shortcuts

Statistics
ProbabilityMacmillan Learning NASA s Goddard Institute for Space Studies GISS allows you to download historical temperature records for locations worldwide Go to http data giss nasa gov gistemp station data scroll down to Download Station Data and type Los Angeles You may be interested in looking up your own location as well A new page appears with a link to the Los Angeles California station data Click on this link to the next page which should contain a time plot of the annual mean temperature in degrees Celsius for Los Angeles since 1880 and a link to Download monthly data as text If this URL isn t working you can access the data set using one of the links provided To access the complete data set click the link for your preferred software format Excel Minitab14 18 Minitab18 JMP SPSS TI R Mac TXT PC TXT CSV CrunchIt Now clean up the data so that only true temperature values will be plotted You can do this by editing either the original text file or the data in your statistical software Take the time to consider how your specific software handles missing data if an empy cell won t work see your software s help function Create both a dotplot and a time plot of the cleaned up annual mean temperatures Interpret your graphs and conclude in context The time plot reveals in Los Angeles from 1 regular irregular up and down cycles with he dotplot reveals that the Y an overall decrease a relatively flat change an overall increase in annual mean temperatures mperatures is

Statistics
Probability5 The fraction 7 is equivalent to what percent Round to two decimal places if needed 8

Statistics
ProbabilityIn a statistics class with 136 students the professor records how much money each student has in their possession during the first class of the semester The histogram below is of the data collected Click on the image for a larger view Frequency 60 50 40 30 20 10 0 0 10 20 30 40 50 60 A 70 OB 60 OC 40 D 50 a The number of students with under 10 dollars in their possession is closest to A about 20 B about 10 b The percentage of students with over 20 dollars in their possession is C over 40 D about 30 Amount of Money c The histogram 100 A is skewed right B has an outlier Oc is asymmetric D all of the above

Statistics
ProbabilityFind the first three terms of the sequence defined below where n represents the position of a term in the sequence Start with n 1 an 2 2

Statistics
ProbabilitySuppose that 8 out of the 19 doctors in a small hospital are General Practitioners 6 out of the 19 are under the age of 45 and 4 are both General Practitioners and under the age of 45 What is the probability that you are randomly assigned a General Practitioner or a doctor under the age of 45 Enter a fraction or round your answer to 4 decimal places if necessary Answer Keypa Keyboard Shorts Tables

Statistics
ProbabilityThe type and number of fish caught in the Charleston Harbor in March was recorded for a month The results are recorded in the table below What is the probability that the next fish caught is a drum or a flounder Enter a fraction or round your answer to 4 decimal places if necessary Answer Flounder 283 Number of Fish Caught in March Red Drum Black Drum Bluefish 288 356 164 Sea Trout 227 Tables Keypad

Statistics
ProbabilityAn eight sided die which may or may not be a fair die has four colors on it you have been tossing the die for an hour and have recorded the color rolled for each toss What is the probability you will roll an orange on your next toss of the die Express your answer as a simplified fraction or a decimal rounded to four decimal places blue 39 orange 33 purple 31 brown 30

Statistics
ProbabilityA bag contains 100 lettered tiles The table below shows the frequency of each letter Consider Y as a consonant J K Q X Z 1 B C F P V W Y G H M D L S U 2 3 4 Letters Number of tiles Part A N R T 6 Show Hints O 8 A I 9 E Let A be the event of randomly selecting an E Let B be the event of randomly selecting a letter in the word mathematics 12 Determine whether the events are mutually exclusive or inclusive Select the words from the drop down list to correctly complete the sentence

Statistics
ProbabilityMartina is learning about the 50 states of the United States WA CA HI NV 10 9 UT AZ AK MT NV UT WY A VT OH MI MN ND CO NM AZ NM ND SD NE IA MT ID TX MN PA CA AK ME Wi KS MO OK AR MI IL IN OH KY TN Gulf of Mexico PA SC MS AL GAY NH To help her learn their locations she created the Venn diagram shown below using the postal codes of the states NC B LA MS AL FL GA SC NC NY NH TX VA MD DE WA NJ CT RI MA OR HI MA CT NI DE MD C WY CO SD NE WI WV KS OK IA AR MO IL IN KY TN Set A includes states that border Canada or Mexico and set B includes the states that border an ocean or the Gulf of Mexico Note that Pennsylvania share a water border with Canada but Wisconsin does not What is the probability that a randomly selected state borders Canada or Mexico or does not border an ocean or gulf the box Sign out ES Sep 11 10

Statistics
ProbabilityJorge has a 12 sided number cube with sides labeled 1 12 When the cube is rolled each side is equally likely to face up What is probability of rolling an even number or a prime number Enter the correct value in the box Show Hints The probability of rolling an even number or a prime number is 7 8 9

Statistics
ProbabilityTwenty game tokens numbered 51 through 70 are placed in a box Let A be the event that a multiple of 3 is randomly chosen from the box Let B be the event that an even numbered token is randomly chosen from the box The Venn diagram below models the situation 53 61 55 65 A 51 AC 57 63 69 A 67 59 Make a two way relative frequency table to represent A B AC and BC Enter the correct numbers in the boxes to complete the table B 54 52 56 58 B 60 66 62 64 68 70 Show Hints BC Total 0 35

Statistics
ProbabilityConsider the spinner shown 12 11 10 9 1 8 Part A 2 7 3 4 5 Find P blue or 1 Enter the correct value in the box


Statistics
ProbabilityConsider the spinner shown C11 Part A Find P 8 or pink Enter the correct value in the box

Statistics
ProbabilityConsider the spinner LD 6 5 7 4 Part A 8 3 1 2 10 Find P green or even Enter the correct value in the box

Statistics
ProbabilityWrite the vector equation for computing the moment of force F about axis AB Will your answer be a scalar or a vector F 501 40 20k lb C X 2 ft A 3 ft N 4 ft B

Statistics
ProbabilityDetermine the combined moment created by the 400 N force about point O O 0 4 m 0 2 m 30

Statistics
ProbabilityUpdate A bag contains 4 green 3 yellow 2 purple and 1 blue marble s You draw a marble put it aside and then draw another marble Find the probability that you draw a blue marble and then a green marble or a yellow marble Enter the simplified fraction in the box Show Hints

Statistics
ProbabilityStudents at a school were asked whether they would be interested in free guitar lessons They were also asked whether they were left or right handed The results of the survey are shown in the table Left handed Right handed Part A Interested 6 16 Not interested 10 88 For the event A of being left handed and the event B of being interested in free guitar lessons use the Multiplication Rule to find P ANB Enter the correct answer in the box

Statistics
ProbabilityStudents at a high school were asked whether they had ever made dinner for their families The results of the survey are shown in the table Let A represent the event Haven t made dinner and let B represent the event Freshman Freshman Senior Total Part A Have made Haven t made 0 51 0 24 0 75 0 17 0 08 0 25 Total 0 68 0 32 1 Find the probabilities P BA and P B A Haven t made B Freshman

Statistics
ProbabilityFor a few weeks a music producer kept track of newly released songs on a music streaming website He recorded the music genre and number of times the song was played on its release date Country Rock 0 500 plays 501 1 000 plays 5 3 4 3 What is the probability that a randomly selected song was rock or had 501 1 000 plays Simplify any fractions

Statistics
ProbabilityHOW OLD ARE U S PRESIDENTS The table gives the ages of the first 44 U S presidents when they took office President Age President Age Washington 57 Taylor J Adams 61 57 57 58 Lincoln 57 A Johnson 61 Grant 54 Hayes 68 51 49 Jefferson Madison Monroe J Q Adams Jackson Van Buren W H Harrison Tyler Polk F Fillmore Pierce Buchanan President B Harrison 64 50 Cleveland 48 McKinley 65 52 56 46 54 49 51 47 Garfield Arthur Cleveland T Roosevelt Taft Wilson Harding Coolidge Hoover F D Roosevelt Truman Age President 55 Eisenhower 55 Kennedy 54 42 51 56 55 51 54 51 60 L B Johnson Nixon Ford Carter Reagan G H W Bush Clinton G W Bush Obama 1 Make a frequency histogram of the data using intervals of width 4 starting at age 40 Age 61 43 55 56 61 52 69 64 46 54 47

Statistics
Probability0 Three distributions I II and III are shown below as well as three sets of summary a Match each histogram to its set of summary statistics and explain your reasoning b Estimate the IQR for each distribution Hint consider where to place vertical lines that divide the total area into four equal parts Then find the distance between the first and third lines 0 0 TTTTT 0 2 2 2 4 4 4 6 6 6 8 8 8 10 10 10 Set A Mean Median Standard Deviation Mean Set B Median Standard Deviation Mean Set C Median 5 7 6 4 2 3 Standard Deviation 5 0 4 8 2 0 5 0 4 9 3 0

Statistics
Probability3 20 In a study of 1 329 American men reported in American Statistician 1974 28 115 122 the men were classified by serum cholesterol and blood pressure The group of 408 men who had blood pressure readings less than 127 mm Hg were then classified according to their serum cholesterol level Serum Cholesterol mg 100cc 0 0 199 9 200 0 219 9 220 0 259 9 greater than 259 Frequency 119 88 127 74 a Estimate the mode median and mean for the serum cholesterol readings if possible b Which of the three summary statistics is most informative concerning a typical

Statistics
Probability2 16 pints Prepare journal entries to record the following merchandising transactions of Lowe s which uses the perpetual inventory system and the gross method August 1 Purchased merchandise from Aron Company for 10 000 under credit terms of 1 10 n 30 FOB destination invoice dated August 1 August 5 Sold merchandise to Baird Corporation for 7 000 under credit terms of 2 10 n 60 FOB destination invoice dated August 5 The merchandise had cost 5 000 August 8 Purchased merchandise from Waters Corporation for 9 000 under credit terms of 1 10 n 45 FOB shipping point invoice dated August 8 Paid 170 cash for shipping charges related to the August 5 sale to Baird Corporation August 9 August 10 Baird returned merchandise from the August 5 sale that had cost Lowe s 500 and was sold for 1 000 The merchandise was restored to inventory August 12 After negotiations with Waters Corporation concerning problems with the purchases on August 8 Lowe s received a price reduction from Waters of 900 off the 9 000 of goods purchased Lowe s debited accounts payable for 900 August 14 At Aron s request Lowe s paid 130 cash for freight charges on the August 1 purchase reducing the amount owed accounts payable to Aron August 15 Received balance due from Baird Corporation for the August 5 sale less the return on August 10 August 18 August 19 Paid the amount due Waters Corporation for the August 8 purchase less the price allowance from August 12 Sold merchandise to Tux Company for 6 000 under credit terms of n 10 FOB shipping point invoice dated August 19 The merchandise had cost 3 000 August 22 Tux requested a price reduction on the August 19 sale because the merchandise did not meet specifications Lowe s gave a price reduction allowance of 1 000 to Tux and credited Tux s accounts receivable for that amount August 29 Received Tux s cash payment for the amount due from the August 19 sale less the price allowance from August 22 August 30 Paid Aron Company the amount due from the August 1 purchase Return to question

Statistics
ProbabilityThe data below are the naptimes for 34 children in a daycare Click here to open this data in StatCrunch Compute the five number summary Time minutes 28 40 30 45 20 Q1 21 36 33 32 30 45 43 43 34 20 40 41 7 Minimum 28 31 32 42 16 21 30 36 26 38 29 35 10 23 30 25 21 A

Statistics
ProbabilityThe box plot represents the weekly salaries in dollars of 80 randomly selected employees of a company The five number summary that was used to construct this box plot is also below Approximately how many employees are in each quartile Minimum 475 Q 650 Median 845 Q975 Maximum 2600 Boxplot for Weekly Earnings 500 1000 1500 Weekly Salary 2000 2500

Statistics
ProbabilityConsumer Reports Health reported the accompanying caffeine concentration mg cup for 12 brands of coffee Click here to open this data in StatCrunch Compute the standard deviation for the caffeine concentration Round your answer to 1 decimal place Coffee Brand Eight O clock Caribou Kickapoo Starbucks Bucks Country Coffee Co Archer Farms Gloria Jean s Coffees Chock Full o Nuts Peet s Coffee Maxwell House Folgers Millstone Caffeine Concentration mg cup Data table of caffeine concentrations in coffee 195 155 115 195 180 110 110 130 55 60 60

Statistics
ProbabilityThe contingency table below summarizes a survey given to 130 randomly selected middle schoolers Grade Has Cell Phone No Cell Phone 6th 12 33 7th 10 22 8th 34 19 Total 56 74 Total 45 32 53 130 What percent of these middle schoolers are 7th graders Round your answer to 1 decimal place

Statistics
ProbabilityA recent survey asked 450 people if they thought women in armed force should be allowed to participate in combat The results of the survey are given in the table below Gender Male Female Total Yes 144 36 180 No 189 270 Total 225 225 450

Statistics
Probabilitygrade for a statistics student are given What is the student s weighted mean score The student s weighted mean score is 91 50 Simplify your answer Round to two decimal places as needed W Homework Quiz Quiz Project Final Exam Score Percent 88 85 98 95 88

Statistics
ProbabilityYou plan to take a 1905 mile trip in your car which averages 30 miles per gallon How many gallons of gasoline should you expect to use Would a car that has only half the gas mileage require twice as much gasoline for the same trip Explain You should expect to use about Type an integer or a decimal gallons of gasoline

Statistics
ProbabilityFind the following Probabilities given 500 people were surveyed Total Sports a b C Men Women Total Dance 0 04 0 32 0 36 0 20 0 12 0 32 TV 0 16 0 16 0 32 0 40 0 60 1 00 That a person surveyed does not dance That a woman surveyed likes sports How many people surveyed were men who liked dance

Statistics
ProbabilityOpening Activity In a class of 30 students 3 out of the 16 girls and 6 out of the 14 boys are left handed Draw a Venn diagram and find the probability that a student chosen at random is a boy or left handed L 3 6 B 8 13

Statistics
Probabilityf 4 2 f x 0 for x 4 f 4 0 and f x 0 for x 4 fiction that has the properties described below Choose the correct graph below O A Ay 4 2 B 4 2 57 Next question O C D
Statistics
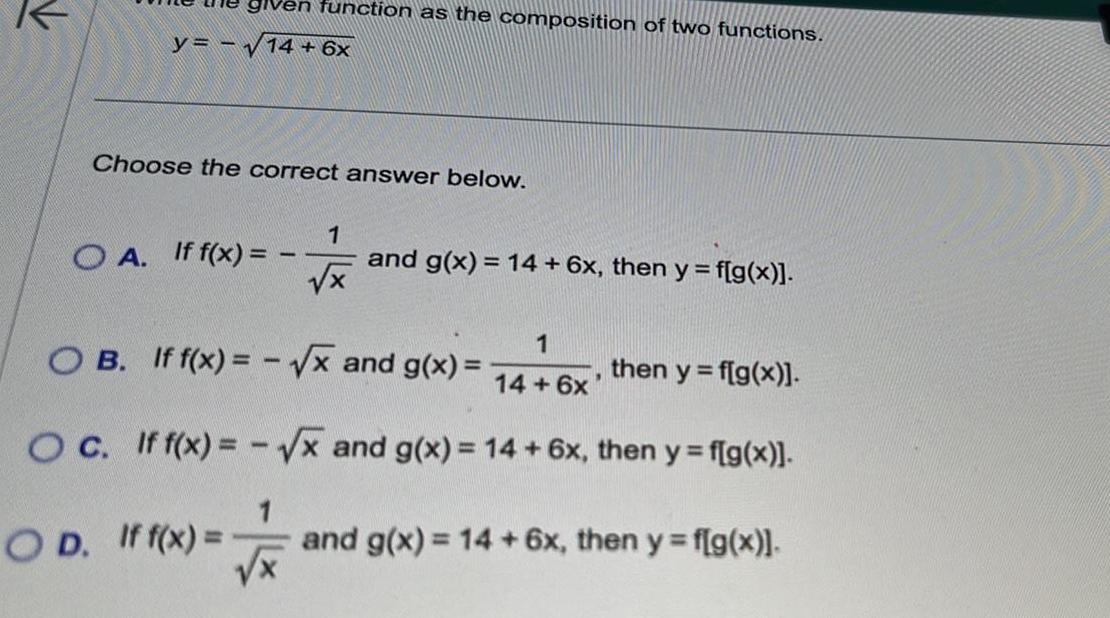
Probabilityfunction as the composition of two functions y 14 6x Choose the correct answer below OA If f x 1 1 x and g x 14 6x then y f g x 1 OB If f x x and g x then y f g x 14 6x OC If f x x and g x 14 6x then y f g x OD If f x and g x 14 6x then y f g x

Statistics
Probabilityy 24x16x 9 given function Next question This test 20 points pembin This question 1 points pomm The x intercept s is are Type an ordered pair Use a comma to separate answers as needed Use integers or fractions for any numbers in the expression

Statistics
ProbabilityO y x 2 x 8x 1 Choose the correct setup below to differentiate the function O d y x 2 x 2 x 8x 1 dx d dx O y x 2 x 8x 1 x 8x 1 x 2 dx dx x 8x 1 y 2 x 2 x 2 2 x 8x 1 dx d x 2 2 x 8x 1 x 8x 1 dx d y x 2 x x 1 x 2 dx y x 2 x 8x 1 x 8x 1 x 2

Statistics
ProbabilityWhich of the functions below are increasing for all x B I 1 t Q This test 20 point s possible This question 1 point s possible A Submit tes Select the correct choice below and if necessary fill in the answer box to comple choice Type A B C or D Use a comma to separate answers as needed OB None of the functions are increasing for all x

Statistics
Probabilityf x x 1 2 x 5 function has one relative extreme point Find it and determine whether it is a relative maximum or a relative minimum The relative extreme point is Type an ordered pair Is the relative extreme point a relative maximum or a relative minimum Relative maximum Relative minimum 1 point s po
