Probability Questions and Answers

Statistics
ProbabilityAllie buys a box of granola bars to hand out to her friends at school There are twelve granola bars in the box in which six are chocolate chip three are raisin and three a peanut butter Allie randomly passes out the granola bars to her friends Determine whether each statement indicates the correct probability for the occurrence of events as described Select Yes or No for each statement AB C The probability that the first two friends both get chocolate chip is 0 250 The probability that the first friend gets peanut butter and the second friend gets chocolate chip is 0 136 The probability that the first friend gets raisin and the second friend gets peanut butter is 0 063 Yes 00 No

Statistics
Probability13 Two marbles are drawn from a bag containing 11 red 10 white and 9 purple What is the probability of drawing Red first purple second 1 red and 1 purple No white marbles Same color DRAG DROP THE ANSWER 11 X 30 29 30 II 30 10 XXNSE 10 9 y 8 X X 29 30 29 X x 2 29 20 19 30 29 II 9 30 29

Statistics
ProbabilitySuppose you spin the spinner one time AA 15 U a B A D A BA Probability C A D Construct a probability model Outcomes D B B C b What is the probability of the spinner not landing on ar

Statistics
Probability8 A coin is tossed and a die is rolled What is the probability that the coin shows tails and the die shows a multiple of 2 Leave your answer in fraction form

Statistics
Probability10 Kylie has a collection of bows for her hair She has two different sizes small and large All the bows are either solid or have a pattern Small Pattern 8 Solid 7 Large 6 7 What is the probability as a percentage that a randomly selected bow is large and has a pattern Enter your answer rounded to the nearest whole number in the space provided 06

Statistics
ProbabilityPlace an X In the table to show whether each pair of events is mutually exclusive or inclusive A person is 27 years old and 29 years old A student is walking and listening to music A number is even and is a multiple of 5 A number is odd and is a multiple of 2

Statistics
Probability2 a Noah surveyed 500 sophomores and juniors about their third period classes His results are summarized in the relative frequency tab Math Science History Total 0 24 0 20 0 68 0 08 0 15 0 32 0 32 0 35 1 00 Sophomore 0 24 0 09 0 33 Junior Total Part A What is the probability that a surveyed student does not have third period history b Part B What is the probability that a surveyed junior has third period math c Part C How many surveyed students are sophomores with third period science

Statistics
ProbabilityA card is picked from the following cards Find the probability that the card drawn is purple Answer Note Use slash to separate numerator and denominator

Statistics
ProbabilityPart 3 of 4 102 points O Points 0 of 1 Save Another useful measure of variation for a data set is the mean absolute X deviation MAD It is calculated by the formula MAD a Find the mean absolute deviation of the data set here Compare the result b The mean absolute deviation of the data is X

Statistics
Probability23 A survey was conducted among office workers regarding if their preferences on coffee versus soda The Venn diagram below represents the responses Survey of Office Workers Drinks Coffee Drinks Soda 31 12 25 83 Find the following probabilities as a fraction do not simplify P Coffee only P S P CUS P CS

Statistics
ProbabilityA total of 200 people attend a party as shown in the table A person is selected at random to win a prize The probability of selecting a female is 0 6 The probability of selecting a child given that the person is a female is 0 25 The probability of selec a male given that the person is a child is 0 4 Complete the two way table to show the number of adults children males and females who attended the party Male Female TOTAL Adults 150 Children 50 TOTAL 80 120 200

Statistics
Probability22 The probability that the event A occurs is 3 is the probability that A occurs given that B occurs Answer Note Use slash to separate numerator from denominator the probability that event B occurs is 5 8 and the probability that events A and B both occur is 9

Statistics
Probability21 At Kennedy Middle School the probability that a student takes Technology and Spanish is 0 087 The probability that a student takes Technology is 0 68 What is the probability that a student takes Spanish given that the student is taking Technology Type your result in the empty box provided below in decimal form rounded to the hundredth place Answer

Statistics
ProbabilityWhat is the sum of the first nine terms of the given geometric series 6 24 96 384

Statistics
ProbabilityB You pick a card at random from the following cards put it back and then pick another card at random Find P blue blue Write your result in th empty box provided below Answer into numerator and denominator

Statistics
Probability17 In a class of 25 students 3 2 of the class are boys of the class have blonde hair and of the class are boys with blonde hair 5 If one student is to be chosen at random from the class what is the probability that the student is a boy or has blonde hair Show your work on the scratchpad P boy or blonde hair

Statistics
Probability5 The probability that event A occurs is 7 A and B both occur Write your result in the empty box provided below in a simplest fraction form P A and B Note Use slash to separate numerator and denominator 2 and the probability that event B occurs is If A and B are independent events what is the probability that 3

Statistics
ProbabilityGiven P A 0 20 P B 0 70 P BIA 0 55 and P A B 0 16 which statement is correct about events A and B A is the complement of B B A and B are independent events A and B are dependent events DB is the complement of A


Statistics
Probability4 What is the summation formula for the series below 4 8 16 32 2048 10 B 10 C 4 4n 6 2 4 1 n 1 10 2n 6 n 1 10 4 2 n 1 n 1

Statistics
Probability340 340 310 320 310 360 350 330 260 380 340 320 310 360 350 330 ake a dotplot of these data type Dotplot ow boxplot 260 270 280 290 300 310 320 330 340 350 360 370 Calories per Serving alain what the dot above 260 represents 380

Statistics
ProbabilityState Alabama Alaska Arizona Arkansas California Colorado Connecticut Delaware Dist of Columbia Florida Georgia Hawaii Idaho Illinois Indiana Iowa Med 1985 1996 2002 70 4 71 0 73 5 61 2 62 9 67 3 64 7 62 0 65 9 66 6 66 6 70 2 54 2 55 0 58 0 63 6 64 5 69 1 69 0 69 0 716 70 3 71 5 75 6 37 4 40 4 44 1 67 2 67 1 68 7 62 7 69 3 71 7 51 0 50 6 57 4 71 0 71 4 73 0 60 6 68 2 Bus 3 7 Soc State 33 31 19 25 23 27 11 9 29 3 17 9 2 5 8 2 9 1 3 3 34 The following data are the resting pulse rates for 30 randomly selected individuals who were participants at a 10K race Montana Nebraska Nevada COST 49 40 59 56 55 70 49 59 55 49 58 54 56 55 65 57 61 41 52 60 49 57 3 35 Consumer Reports in its May 1998 issue provides cost per daily feeding for 28 brands of dry dog food and 23 brands of canned dog food Using the Minitab computer program the following side by side boxplot for these data was created 3 5 3 0 2 5 2 0 1 5 1 0 5 0 a Construct a stem and leaf plot of the pulse rates b Construct a boxplot of the pulse rates c Describe the shape of the distribution of the pulse rates d The boxplot provides information about the distribution of pulse rates for what population DOG FOOD COSTS BY TYPE OF FOOD New Hampshire New Jersey New Mexico New York North Carolina North Dakota Ohio Oklahoma Oregon Pennsylvania Rhode Island South Carolina South Dakota Tennessee Texas Utah Vermont Virginia Washington West Virginia Wisconsin Wyoming 3 10 The following table presents homeownership rates in percentages by state for the years 1985 1996 and 2002 These values represent the proportion of homes owned by the occupant to the total number of occupied homes CAN TYPE a From these graphs determine the median lower quartile and upper quartile for the daily costs of both dry and canned dog food b Comment on the similarities and differences in the distributions of daily costs for the two types of dog food Summarizing Data from More Than One Variable Graphs and Correlation 70 2 67 6 74 2 75 0 69 9 72 8 73 9 68 3 67 5 70 2 Kansas Kentucky Louisiana Maine Maryland Massachusetts Michigan Minnesota Mississippi Missouri 68 5 73 2 73 5 70 2 64 9 67 1 73 7 76 5 73 9 65 6 66 9 72 0 60 5 61 7 62 7 70 7 73 3 76 0 70 0 75 4 77 3 69 6 73 0 74 8 69 2 70 2 74 6 Source U S Bureau of the Census http www census gov ftp pub hhes www hvs html 3 36 For the homeownership rates given in Exercise 3 10 construct separate boxplots for the years 1985 1996 and 2002 1985 66 5 68 6 68 5 66 8 57 0 61 1 65 5 65 0 62 3 64 6 68 2 67 1 70 3 50 3 68 0 52 7 55 0 70 4 70 0 69 5 69 9 68 2 67 9 69 2 72 0 69 4 70 5 68 4 61 5 63 1 66 2 56 6 59 6 71 6 71 7 74 0 61 4 72 0 72 9 77 3 67 6 67 8 71 5 67 6 68 8 70 1 60 5 61 8 63 8 71 5 72 7 72 7 69 5 70 2 70 3 68 5 74 3 68 5 66 8 63 1 67 0 75 9 74 3 77 0 63 8 68 2 72 0 73 2 68 0 72 8 b What major differences exist among the plots for the three years c Why do you think the plots have changed over these 17 years 1996 2002 69 3 68 4 54 55 72 51 46 55 63 55 DRY 65 5 69 5 67 2 a Construct relative frequency histogram plots for the homeownership data given in the table for the years 1985 1996 and 2002 d How could Congress use the information in these plots for writing tax laws that allow major tax deductions for homeownership PIC COLLAGE


Statistics
ProbabilityDr Scotch s research involves tracking degeneration of myelin in the brains of older adults and its impact on the ability to perform tasks that require fine motor skills Because this is his specific focus which of the meta theories may he subscribe to contextual maturational mechanistic

Statistics
ProbabilityQ4 Question 1 26 Cont d One of the variables in the Drafting NFL Quarterbacks problem is Quarterback Production Score What type of variable is Quarterback Production Score 1 pt a Quantitative b Qualitative c Cannot tell from the problem statement

Statistics
ProbabilityThe histogram below gives the length of service of members of the Department of Chemistry at a particular university The classes in years of service are 0 4 9 5 9 9 etc and the vertical axis represents the number of faculty What percent of the department faculty have less than 25 years of service Answer 9 8 CO 7 6 12 5 4 3 2 1 8 5 12 18 15 Chemistry Faculty 28 25 38 35 48 Tt

Statistics
Probabilityook int int ences Sydney Retailing buyer and Troy Wholesalers seller enter into the following transactions May 11 Sydney accepts delivery of 37 500 of merchandise it purchases for resale from Troy invoice dated May 11 terms 3 10 n 90 FOB shipping point The goods cost Troy 25 125 Sydney pays 435 cash to Express Shipping for delivery charges on the merchandise May 12 Sydney returns 1 200 of the 37 500 of goods to Troy who receives them the same day and restores them to its inventory The returned goods had cost Troy 804 May 20 Sydney pays Troy for the amount owed Troy receives the cash immediately Both Sydney and Troy use a perpetual inventory system and the gross method 1 Prepare journal entries that Sydney Retailing buyer records for these three transactions 2 Prepare journal entries that Troy Wholesalers seller records for these three transactions Complete this question by entering your answers in the tabs below Required 1 Required 2 Prepare journal entries that Sydney Retailing buyer records for these three transactions Check my we
Statistics
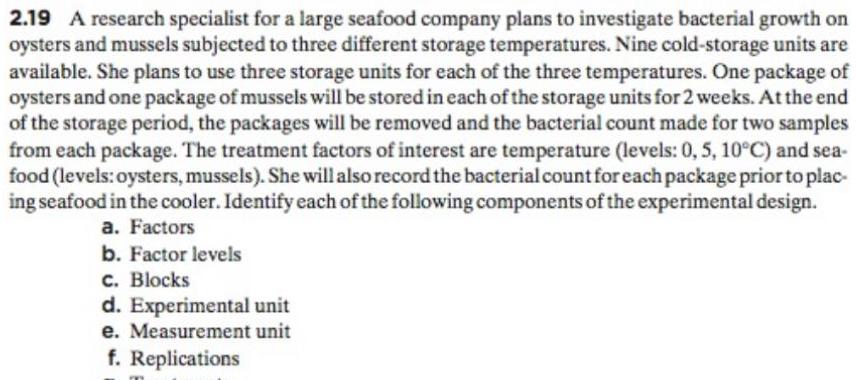
Probability2 19 A research specialist for a large seafood company plans to investigate bacterial growth on oysters and mussels subjected to three different storage temperatures Nine cold storage units are available She plans to use three storage units for each of the three temperatures One package of oysters and one package of mussels will be stored in each of the storage units for 2 weeks At the end of the storage period the packages will be removed and the bacterial count made for two samples from each package The treatment factors of interest are temperature levels 0 5 10 C and sea food levels oysters mussels She will also record the bacterial count for each package prior to plac ing seafood in the cooler Identify each of the following components of the experimental design a Factors b Factor levels c Blocks d Experimental unit e Measurement unit f Replications

Statistics
ProbabilityThe graph of 4x4 8x y 4y4 36x 36y is a lemniscate dy a Find by implicit differentiation dx b Find the slope of the tangent line to the lemniscate at 5 1 a dy dx

Statistics
Probability3 Homework K Question 17 3 3 20 Use the implicit differentiation of the equation to determine the slope of the graph at the given point y x 41 x 2 y 7 The slope of the graph at the given point is Type an integer or a simplified fraction Points

Statistics
ProbabilitySuppose an economist wishes to determine the relationship between the age and price of houses A study yields the following data A B O Matched pairs C Inference for regression Two independent samples Worksheet 1 C1 1 2 3 4 5 27 74864 49 35 51 42 C2 87886 48 63 50 72 55 If column 1 is the price in hundreds of thousands of dollars of a sample of five houses from ten years ago and column 2 is the price in hundreds of thousands of dollars of the same homes today which of the following is the appropriate inference method to analyze these data Select one answer 10 points

Statistics
ProbabilityCAL BIOCHEMISTRY 72 248 254 1976 apid and Sensitive Method for the Quantitation of Microgram Quantities of Protein Utilizing the Principle of Protein Dye Binding MARION M BRADFORD Reproduction Research Laboratories Department of Biochemistry University of Georgia Athens Georgia 30602 Received September 11 1975 accepted January 29 1976 A protein determination method which involves the binding of Coomassie rilliant Blue G 250 to protein is described The binding of the dye to protein auses a shift in the absorption maximum of the dye from 465 to 595 nm and is the increase in absorption at 595 nm which is monitored This assay is ery reproducible and rapid with the dye binding process virtually complete in pproximately 2 min with good color stability for 1 hr There is little or no nterference from cations such as sodium or potassium nor from carbohydrates uch as sucrose A small amount of color is developed in the presence of trongly alkaline buffering agents but the assay may be run accurately by the use of proper buffer controls The only components found to give excessive nterfering color in the assay are relatively large amounts of detergents such as sodium dodecyl sulfate Triton X 100 and commercial glassware detergents Interference by small amounts of detergent may be eliminated by the use of proper controls aboratory practice in protein purification often requires a rapid an sitive method for the quantitation of protein Methods presentl inal primary literature article that describes the Bradford Assay A rapid and sensitive method for the quantitation of microgram quantities of protein utilizing the principle of protein dye binding Then answer the questions below about the article 3 9 pts According to the article Coomassie Brilliant Blue G 250 can be red or blue a What causes the color change from red to blue b Approximately how long does it take for the color to change In the pre lab video instructions stated to incubate Bradford dye protein for 10 minutes According to Figure 3 in the paper how much would the absorbance change if I waited one hour to make my measurement 4 5 pts In the manuscript the author looks at a variety of substances to see if they interfere with the Bradford assay We will be using NaCl in our Buffer this semester Would 50 mM NaCl interfere with the assay at 595 nm Provide evidence for your answer

Statistics
ProbabilityA researcher wants to find out if U S adults still support the death penalty at a proportion of 0 64 as it was in 2003 This graph indicates the sampling distribution for the proportion of supporters in random samples of 25 adults The standard deviation is approximately 0 10 04 0 5 0 6 0 7 0 8 0 9 What is the approximate test statistic for p 0 84 A O 2 B O 1 C Oo D O1 E O2 Select one 10 points
Statistics
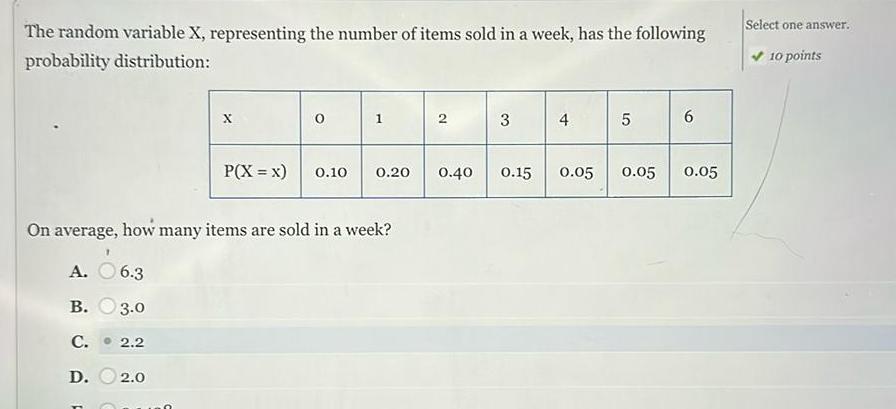
ProbabilityThe random variable X representing the number of items sold in a week has the following probability distribution D 2 0 X F 0 P X x 0 10 1 On average how many items are sold in a week A 6 3 B 3 0 C 2 2 0 20 2 0 40 3 0 15 4 5 0 05 0 05 6 0 05 Select one answer 10 points

Statistics
ProbabilityIn an experiment the probability that event A occurs is 7 occurs is 38 Submit and the probability that event B If A and B are independent events what is the probability that A and B both occur Simplify any fractions

Statistics
ProbabilityName that variable A survey of a large college class asked the following questions 1 Are you female or male In the data male 0 female 1 2 Are you right handed or left handed In the data right 0 left 1 3 What is your height in inches 4 How many minutes do you study on a typical weeknight c b d

Statistics
Probabilityture on health in 35 countries with the highest gross domestic product in that year 2 Health expenditure per capita is the sum of public and private TABLE 1 3 Per capita total expenditure on health international dollars Dollars Country Dollars Country 293 Saudi Arabia 1725 1414 South Africa 4191 4885 3126 Spain 4526 3741 Sweden 1454 2398 Switzerland 938 Thailand 4759 646 1061 Turkey 843 5601 United Arab Emirates 4552 207 United Kingdom 4334 6308 United States 4812 1551 Venezuela 215 1587 Argentina Australia Austria Belgium Brazil Canada China Colombia Denmark France Germany India Country Indonesia Iran Italy Japan Korea South Malaysia Mexico Netherlands Nigeria Norway Poland Russia Dollars 1681 1121 2846 4244 6187 658 1053 2233 3311 9146 656 health expenditure in PPP international divided by population Health expenditures include the provision of health services family planning activi ties nutrition activities and emergency aid designated for health but

Statistics
Probability1 37 Fur seals on St Paul Island Every year hundreds of thou sands of northern fur seals return to their haul outs in the Pribilof Islands in Alaska to breed give birth and teach their pups to swim hunt and survive in the Bering Sea U S commercial fur sealing operations continued on St Paul until 1984 but despite a reduction in harvest the population of fur seals has continued to decline Possible reasons include climate shifts in the North Pacific chang es in the availability of prey and new or increased interac tion with commercial fisheries that increase mortality Here are data on the estimated number of fur seal pups born on St Paul Island in thousands from 1979 to 2014 where a dash indicates a year in which no data were collected 28 FURSEALS Pups Born thousands Year 245 93 1988 203 82 1989 179 44 1990 203 58 1991 165 94 1992 173 27 1993 182 26 1994 167 66 1995 171 61 1996 Pups Born thousands 202 23 171 53 201 30 182 44 192 10 170 12 Year 1997 1998 1999 2000 2001 2002 2003 2004 2005 Pups Born thousands 179 15 158 74 145 72 122 82 Year 2006 2007 2008 2009 2010 2011 2012 2013 2014 Pups B thousa 109 102 94 96 91

Statistics
Probability27 Deaths among young people Among persons aged 15 24 years in the United States there were 28 486 deaths in 2013 The leading causes of death and num ber of deaths were accidents 11 619 suicide 4878 homicide 4329 cancer 1496 heart disease 1170 con genital defects 362 19 a Make a bar graph to display these data b Can you make a pie chart using the information given Explain carefully why or why not

Statistics
Probability25 What color is your car most popular color cars and light trucks vary with region type of vehicle and over time In North America silver and gray are the most popular choices for midsize cars black and red for sports cars and white for light trucks Despite this variation overall white remains the top choice worldwide for the fifth consecutive year increasing its lead by 7 over the previous year Here is the distribu tion of the top colors for vehicles sold globally in 2015 17 CARCOLOR Colo White Black Silver Gray Red Beige brown Blue Other colors Popularity 35 17 12 11 8 8 7 Fill in the percent of vehicles that are in other colors Make a graph to display the distribution of color

Statistics
Probability6 a Mara runs a bakery and wants to open a new store She conducts a survey to see if customers would be interested in this new store In the survey 1 in 10 respondents indicated living within a ten minute drive of the new store Of these respondents 50 were interested in the new store Respondents living within a ten minute drive of the new store represented 81 of all respondents who were interested in the new store Part A What is the probability that a respondent in the survey was interested in the new store b Part B Which decision should Mara make A Since the percentage of respondents to the survey who wanted a new store is low overall she should not open a new store B Since 81 of all respondents to the survey were interested in the new store she should open a new store C Since the percentage of respondents to the survey who wanted a new store is high overall she should open a new store Since exactly half of all respondents to the survey were interested in the new store she should not open a new store D

Statistics
Probability2 A survey was conducted between males and females to see if they prefer cheeseburgers or hamburgers The results of the survey are posted in the Venn diagram below 26 Cheeseburger 21 Female 18 16 Find the following probabilities as a percent If necessary round to the nearest whole P cheeseburger female P hamburger male P cheeseburger

Statistics
Probability5 a A bookcase has 36 math books and 14 science books Twelve of the math books are hardback books and 5 of the science books are also hardback books Part A What is the probability that a randomly selected book is not a hardback book b Part B What is the probability that a randomly selected book is not a math book

Statistics
Probability13 Place an X in the table to show whether events A and B are dependent or independent P A 0 42 P B 0 23 and P A and B 0 966 P A 0 55 P B 0 28 and P A and B 0 154 P A 0 08 P B 0 12 and P A and B 0 0096 P A 0 36 P B 0 71 and P A and B 0 35

Statistics
ProbabilityOne card is selected at random from a deck of cards Find the probability of selecting the following possibilities in the first column Note Write your answer in simplest form and separate the numerator and denominator using a slash Possibility A queen or king A heart or a 6 A red card or a diamond Probability 11


Statistics
ProbabilityB 0 5 For two mutually exclusive events A and B P A What is the probability that either event A or event B occurs 0 4 0 8 5 10 0 6 and P B 1 10

Statistics
Probability4 a A box contains 2 cans of chicken soup 17 cans of lentil soup and 7 cans of tomato soup Jackie randomly selects one can and sets it aside He randomly selects another can Let C be the event that the can has chicken soup Let L be the event that the can has lentil soup Let T be the event that the can has tomato soup Part A Which statement is correct A Event L is the complement of event C B The events C and L are dependent C The events L and T are independent D Event C is the complement of event T b Part B What is the probability that the first randomly selected can is lentil soup and the second randomly selected can is tomato soup

Statistics
Probability3 An apple grower produces two types of apples Golden Delicious and Granny Smith Golden Delicious apples are 71 of the grower s apples During the picking and cleaning process 8 of Golden Delicious apples get bruised while 3 of Granny Smith apples get bruised What is the probability that an apple is bruised during the picking and cleaning process Round to the nearest thousandth

Statistics
Probability1 a b Ryann observed 500 vehicles in three different colors Her results are summarized in the two way relative frequency table Gray Blue White Total Type of Vehicle Sedan Truck SUV Total 0 10 0 08 0 12 0 30 0 03 0 01 0 06 0 10 0 06 0 18 0 36 0 60 0 19 0 27 0 54 1 00 Part A What is the probability that an observed vehicle is not an SUV Part B What is the probability that an observed sedan is blue c Part C How many observed vehicles are white trucks