Probability Questions and Answers

Statistics
ProbabilityAn engineering school reports that 55 of its students were male M 40 of its students were between the ages of 18 and 20 A and that 25 were both male and between the ages of 18 and 20 Select one answer 10 points What is the probability of a random student being female between the ages of 18 and 20 Assume P F P not M A O 0 15 B O 0 16 C O 0 30 D O 0 40

Statistics
ProbabilitySelect one answer According to the information that comes with a certain prescription drug when taking this drug there is a 20 chance of experiencing nausea N and a 50 chance of experiencing decreased sexual drive D The information also states that there is a 15 chance of experiencing both side effects 10 points What is the probability of experiencing neither of the side effects A O 0 10 B O 0 40 C O 0 45 D O 0 70 E O 0 85

Statistics
ProbabilitySuppose your friends have the following ice cream flavor preferences 70 of your friends like chocolate C The remaining do not like chocolate 40 of your friends sprinkles S topping The remaining do not like sprinkles 25 of your friends who like chocolate C also like sprinkles 5 Select one answer 10 phras If your friend had chocolate how likely is it that they also had sprinkles Note Some answers are rounded to 2 decimal places A O 0 10 B O 0 18 C O 0 28 D O 0 36 E O0 63

Statistics
ProbabilityA fair die is rolled 12 times Consider the following four possible outcomes i ii 526321416534 iv 112233445566 iii 666666666666 154351244645 Select one answer 10 points Which of the following is the most likely outcome i ii iii iv A O i because number of die outcomes 1 2 3 4 5 6 is equal but in a random order B ii because the number of die outcomes 1 2 3 4 5 6 is equal C O iii because the number 6 is just as likely as any other number on a die D O iv because you won t necessarily get the same number of of die outcomes 1 2 3 4 5 6 with a fair die E O They are all equally likely attempt

Statistics
ProbabilitySuppose that the handedness of the last fifteen U S presidents is as follows 40 were left handed L 47 were Democrats D If a president is left handed there is a 13 chance that the president is a Democrat S Select one answer 10 points Based on this information on the last fifteen U S presidents is being left handed independent of being a Democrat A O Yes since 0 47 is not equal to 0 13 B O No since 0 40 is not equal to 0 13 C O Yes since 0 40 0 47 is not equal to 0 13 D O No since 0 47 is not equal to 0 13
Statistics
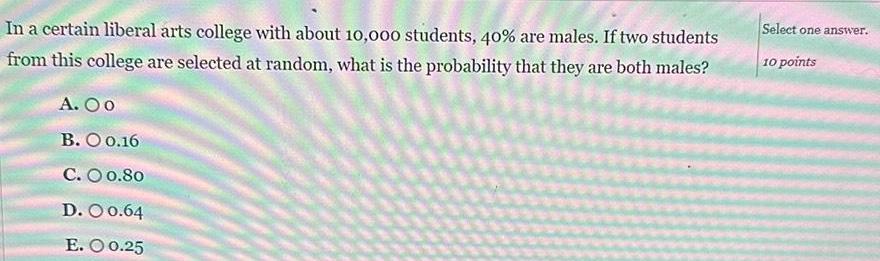
ProbabilityIn a certain liberal arts college with about 10 000 students 40 are males If two students from this college are selected at random what is the probability that they are both males A Oo B O 0 16 C O 0 80 D O 0 64 E O 0 25 Select one answer 10 points

Statistics
ProbabilitySelect one answer An engineering school reports that 55 of its students were male M 40 of its students were 10 points between the ages of 18 and 20 A and that 25 were both male and between the ages of 18 and 20 What is the probability of a random student being a female who is not between the ages of 18 and 20 A O 0 27 B O 0 25 C O 0 30 D O 0 45

Statistics
ProbabilityThe following probabilities are based on data collected from U S adults during the National Health Interview Survey 2005 2007 Individuals are placed into a weight category based on weight height gender and age Probability Underweight A O 0 0889 B O 0 35 C O 0 254 D O 0 604 0 019 Healthy Weight 0 377 Overweight Not Obese 0 35 Select one answer 10 points Obese 0 254 Based on this data what is the probability that a randomly selected U S adult weighs more than the healthy weight range

Statistics
ProbabilityFor safety reasons four different alarm systems were installed in the vault containing the safety deposit boxes at a Beverly Hills bank Each of the four systems detects theft with a probability of 0 99 independently of the others The bank obviously is interested in the probability that when a theft occurs at least one of the four systems will detect it What is the probability that when a theft occurs at least one of the four systems will detect it A O 0 99 4 B O 0 01 4 Select one answer C 01 0 99 4 D 01 0 01 4

Statistics
ProbabilityIn the population 8 of males have had a kidney stone Suppose a medical researcher randomly selects two males from a large population Let A represent the event the first male has had a kidney stone Let B represent the event the second male has had a kidney stone True or false A and B are independent events A O True B Felco Select one answer 10 points

Statistics
Probabilityfair coin is tossed 12 times Which of the following outcomes i ii iii or iv is most likely i HTHTHTHTHTHT ii HTTHHTTHTHHT iii HHHHHHHHHHHH iv TTTHTHHHHTHH Select one answe 10 points A O i because there are an equal number of heads and tails B ii because there are an equal number of heads and tails but in a random order C O iii because heads are just as likely as tails D O iv because you won t necessarily get the same number of heads and tails with a fair coin E O They are all equally likely

Statistics
ProbabilitySelect one answer 10 points The CSU system reported the following probabilities for their student body in 2013 The probability of their student being a male between 17 and 19 is P A 0 11 The probability of their student being a female between 20 and 24 P B 0 30 What is P A and B given that year A O 0 033 B O 0 410 C O 0 377 D OO

Statistics
ProbabilityA six sided cube is rolled What is the probability that the number is odd or less than 4 Event A Numbers on a six sided cube are odd 1 3 5 Event B Numbers on a six sided cube are less than 4 1 2 3 A 01 2 B 02 3 C 05 6 D 01 Select one answer 10 points

Statistics
ProbabilityLet A and B be two independent events If P A 0 5 what can you say about P A B A O Cannot find it because P B is not known B O Cannot find it because P A and B is not known C O Cannot find it because both P B and P A and B are not known D O It is equal to 0 5 E O It is equal to 0 25 Select one answer 10 points

Statistics
ProbabilityDmitry suspects that his friend is using a weighted die for board games To test his theory he wants to see whether the proportion of odd numbers is different from 50 He rolled the die 40 times and got an odd number 14 times Dmitry conducts a one proportion hypothesis test at the 5 significance level to test whether the true proportion of odds is different from 50 a Ho p 0 5 H p0 5 which is a two tailed test b Use Excel to test whether the true proportion of odds is different from 50 Identify the test statistic z and p value from the Excel output rounding to three decimal places Provide your answer below test statistic p value 41

Statistics
ProbabilityDmitry suspected that his friend is using a weighted die for board games To test his theory he wants to see whether the proportion of odd numbers is different from 50 He rolled the die 40 times and got an odd number 14 times Dmitry conducts a one proportion hypothesis test at the 5 significance level to test whether the true proportion of odds is different from 50 a Which answer choice shows the correct null and alternative hypotheses for this test Select the correct answer below O Ho p 0 35 Ha p 0 35 which is a right tailed test O Ho p 0 5 Hap 0 5 which is a left tailed test O Ho p 0 35 Ha p 0 35 which is a two tailed test O Ho p 0 5 Ha p0 5 which is a two tailed test II

Statistics
ProbabilityAn online store sells a variety of photo albums The albums range in photo capacity and orientation Horizontally Vertically Under 50 photos 50 photos or more 2 5 2 5 What is the probability that a randomly selected photo album is oriented horizontally and holds 50 photos or more Simplify any fractions

Statistics
ProbabilitySuppose the null hypothesis Ho is doctors believe that a surgical procedure is successful at least 80 of the time What is the Type I error in this scenario Select the correct answer below Doctors think the surgical procedure is successful less than 80 of the time when in fact it really is successful less than 80 of the time Doctors think the surgical procedure is successful less than 80 of the time when in fact it is successful at least O 80 of the time O Doctors think the surgical procedure is successful at least 80 of the time when in fact it is not O Doctors think the surgical procedure is successful at least 80 of the time when in fact it is

Statistics
Probability3 If a coin is tossed twice which of the following gives the probability that it will land both times heads up on both times tails up 1 0 75 2 0 67 3 0 25 4 0 50

Statistics
Probability2 If a month is picked at random which of the following represent the probability its name will begin with the letter J 1 0 08 2 0 25 3 0 12 4 0 33

Statistics
ProbabilityWhich of the following could not be the value of a probability Explain your choice 3 2 4 1 53

Statistics
ProbabilityFor questions 9 10 use the spinner at the right The spinner is spun twice Find each probability 1 2 O 1 3 1 4 O 1 8 O 1 16 O 1 32 O 1 64 Bewing forms gle W7GimEN P I then 3 4 3 H 1

Statistics
ProbabilityOne marble is randomly selected from the jar at the right then NOT REPLACED and a second marble is selected Find the following probabilities O 1 49 O2 49 3 49 O 6 49 O 1 77 O 1 14 P Blue then Orange

Statistics
ProbabilityIf the spinner below is spun find each probability O 1 8 O 1 4 O 3 8 O 1 2 5 8 Landing on an even number


Statistics
ProbabilityA bucket of golf balls contains 8 white balls 2 purple balls 5 green balls and 11 red balls 00 5 13 O 6 13 O 7 13 O8 13 O9 13 O 10 13 O 11 13 Find the probability of selecting a black ball

Statistics
ProbabilityA bag of m m s contains 7 red 10 blue 5 brown 4 Green and 9 orange If one m m is selected at random find the following probabilities Express your answer as a fraction in lowest terms O 1 7 2 7 O 3 7 O4 7 1 5 2 5 3 5 Find the probability of selecting a blue m m Option 8

Statistics
Probabilitysummarizes the number of working computers in household for a simple random sample of 19 households Find the five number summary Report the five number summary in the following order Min Q1 Median Q2 Q3 Max Number of Computers 0 1 2 3 4 5 Frequency 1 2 3 7 5 1

Statistics
ProbabilityThe Nielsen Company is an information data and market measurement firm that endeavors to provide its clients with valuable insights into consumer behavior and marketing information by collecting data that measures what consumers watch and what they buy For example the company publishes information on the TV viewing habits of Americans in the Nielsen Report on Television A random sample of 20 people yielded the weekly viewing times in hours which is shown in the data set below What is the interquartile range 27 68 22 32 40 37 28 36 29 33 34 32 32 15 36 33 45 7 18 23 Provide your answer below
Statistics
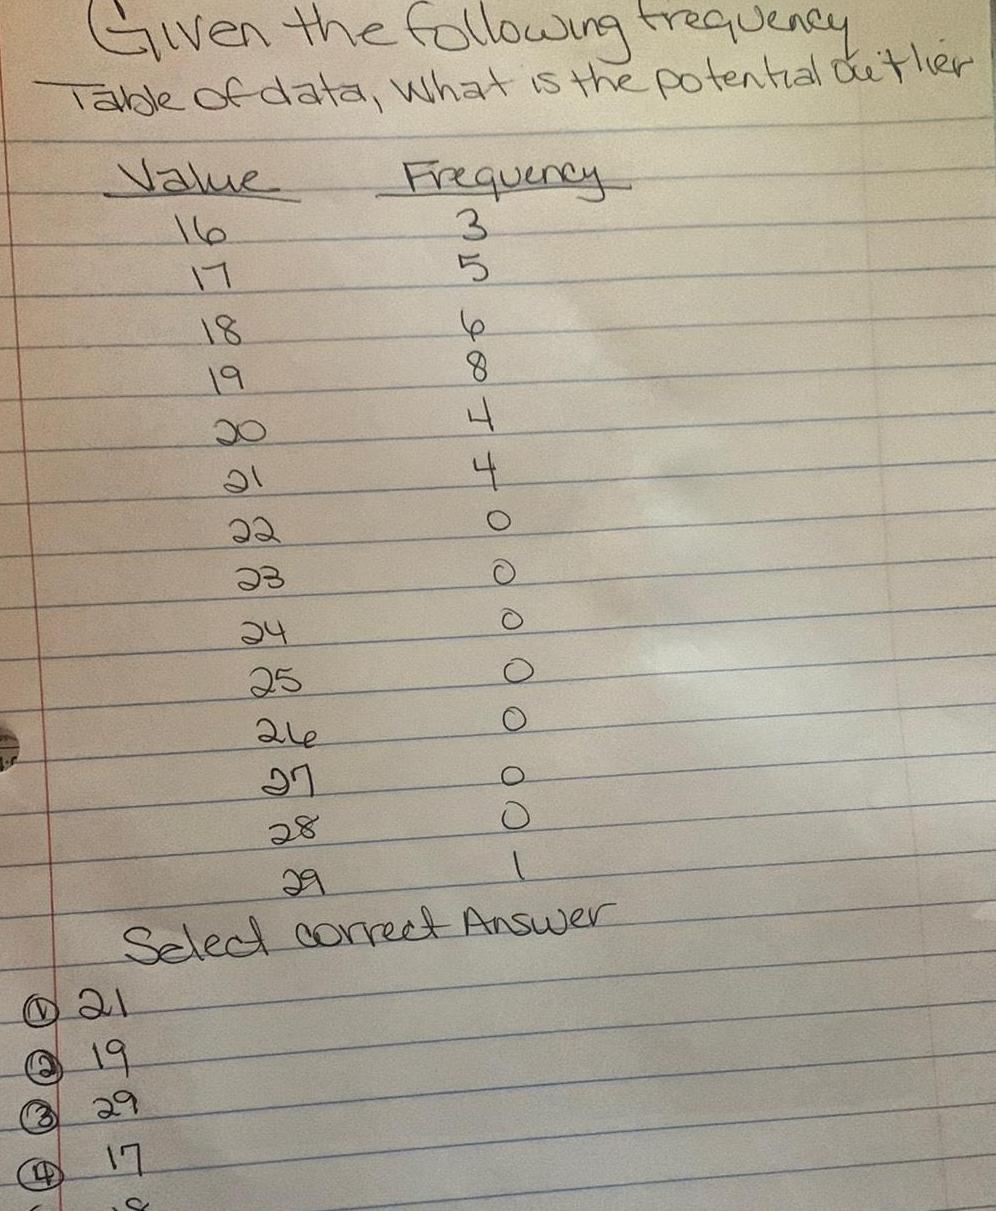
ProbabilityGiven the following frequency Table of data What is the potential outler Value 16 18 19 21 19 29 17 8 20 21 22 23 24 25 21e 27 28 Frequency 3 IAS JW 5 8 4 4 Select correct Answer

Statistics
Probability10 12am Your post is so well done Letitia It looks like you now really know what you are talking about in terms of confidence intervals This sounds like a really big study If you were doing this study within one clinic or hospital do you think that a study on the entire clinic would yield a mean close to the mean of your one unit or would the sample size have to be much larger than that What would happen if you sampled every clinic or hospital in your state Would you expect the confidence interval to be larger or smaller as you grow the number of participants in your study Reply 1

Statistics
ProbabilityThe Global Attractions Attendance Report is an annual report published by the Themed Entertainment Association It is an annual attendance study for themed entertainment and museum industries around the world The following data set includes the total yearly attendance for the top 15 water parks in millions during one year What is the potential outlier 6 7 7 7 8 8 10 10 10 11 11 13 15 16 24 Provido your answor holow

Statistics
ProbabilityWhen aggregating loyalty each 1 spent at the restaurant equates to 1 point for every item 2 points for sushi 3 points for ramen How many points will each customer have and assign a flag Y to customers with over 150 points which qualifies them to join the loyalty program 10 marks

Statistics
ProbabilitySuppose lengths of text messages are normally distributed and have a known population standard deviation of 3 characters and an unknown population mean A random sample of 22 text messages is taken and gives a sample mean of 31 characters What is the correct interpretation of the 90 confidence interval Select the correct answer below We estimate that 90 of text messages have between 29 95 and 32 05 characters O We estimate with 90 confidence that the true population mean is between 29 95 and 32 05 characters We estimate with 90 confidence that the sample mean is between 29 95 and 32 05 characters

Statistics
Probability13 Use the sequence below to answer each question 8 25 10 4 Part A Create a geometric sequence function Make sure to use f n notation 5 Part B Find the 7th term in the sequence write as a FRACTION

Statistics
ProbabilityA bicycle rental company charges a one time fee of 15 plus 4 for every hour of rental Part A Which recursive formula correctly models the cost in dollars of a rental for n hours a 1 4 a n a n 1 15 a 1 19 ain a n 1 15 a 1 19 a n a n 1 4 Part B How much will the bicycle rental cost in dollars for 7 hours Xa

Statistics
ProbabilityB And the explicit formula for the given sequence 1 5 25 125 a 3 a 5 1 n a 3 5 1 9 2 5 1 1

Statistics
ProbabilityThe explicit formula shown is used to generate a sequence of numbers 15 5 n 1 Find the 21st term of the sequence 021

Statistics
ProbabilityWhat is the 14th term of the sequence Round your answer to six decimal places 120 90 Ta n 60 30 0 1 125 2 50 3 20 2 3 4 8 5 3 2 6 1 28 4 5 6 77 Enter the correct number in the box
Statistics
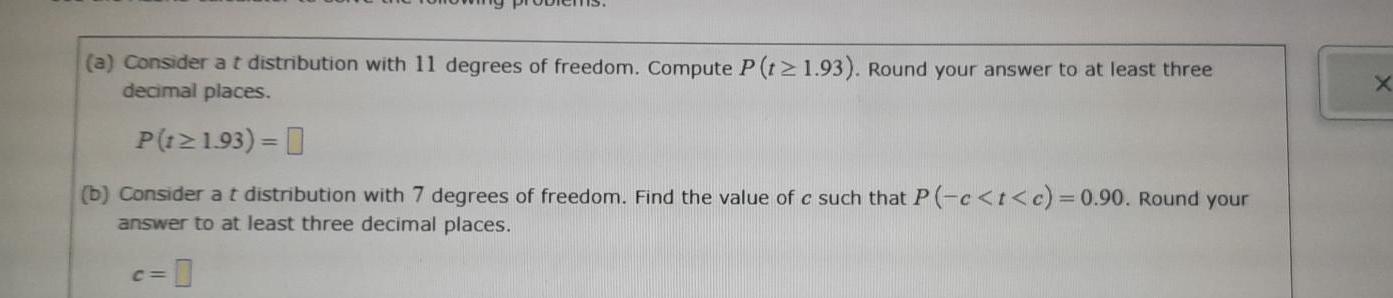
Probabilitya Consider a t distribution with 11 degrees of freedom Compute P t 1 93 Round your answer to at least three decimal places P 1 1 93 b Consider a t distribution with 7 degrees of freedom Find the value of c such that P c t c 0 90 Round your answer to at least three decimal places c 0 X

Statistics
ProbabilitySuppose that the New England Colonials baseball team is equally likely to win a game as not to win it If 5 Colonials games are chosen at random what is the probability that exactly 2 of those games are won by the Colonials Round your response to at least three decimal places If necessary consult a list of formulas

Statistics
ProbabilityLocation Pet shelter Number of students 6 17 9 18 Work this semester Each student is volunteering at one of four locations Here is a summary Library Hospital Tutoring center Three students from the club are selected at random one at a time without replacement What is the probability that the first two students volunteer at the pet shelter and the third volunteers at the library Do not round your intermediate computations Round your final answer to three decimal places If necessary consult a list of formulas

Statistics
ProbabilityA study of college football games shows that the number of holding penalties assessed has a mean of 2 3 penalties per game and a standard deviation of 0 8 penalties per game What is the probability that for a sample of 40 college games to be played next week the mean number of holding penalties will be 2 05 penalties per game or less Carry your intermediate computations to at least four decimal places Round your answer to at least three decimal places

Statistics
Probabilitygive the revenue x from theatrical release in millions of dollars and the revenue y from streaming service rentals in millions of dollars for each of the fifteen movies Also shown are the scatter plot and the least squares regression line for the data The equation for this line is y 3 11 0 15x Theater revenue x in millions of dollars Question 5 of 9 1 point Question Attempt 1 of 3 7 0 43 9 66 4 13 5 20 8 49 9 28 1 60 5 Send data to calculator Rental revenue y in millions of dollars Send data to Excel Based on the studio s data and the regression line complete the following in millions of dollars 27 4 61 8 26 2 36 8 26 5 14 2 31 0 7 0 43 9 66 4 13 5 20 8 10 0 2 0 7 3 9 8 10 5 5 2 16 1 2 1 15 5 a For these data values for theater revenue that are less than the mean of the values for theater revenue tend to be paired with values for rental revenue that are Choose one the mean of the values for rental revenue rendct y in millions of dollars 11 2 9 9 7 1 12 6 8 0 2 1 5 9 2 0 7 3 9 8 10 5 5 2 Renta in millio b According to the regression equation for an increase of one million dollars in theater revenue there is a corresponding increase of how many million dollars in rental revenue Rental revenue in millions of dollars 18 164 14 xx 12 10 Theater revenue in millions of dollars x x x X X xx X 5 Javier V Espas C

Statistics
ProbabilityThe mean SAT score in mathematics is 508 The standard deviation of these scores is 31 A special preparation course claims that the mean SAT score u of its graduates is greater than 508 An independent researcher tests this by taking a random sample of 37 students who completed the course the mean SAT score in mathematics for the sample was 518 Assume that the population is normally distributed At the 0 05 level of significance can we conclude that the population mean SAT score for graduates of the course is greater than 508 Assume that the population standard deviation of the scores of course graduates is also 31 Perform a one tailed test Then complete the parts below Carry your intermediate computations to three or more decimal places and round your responses as specified below If necessary consult a list of formulas a state the null hypothesis Ho and the alternative hypothesis H H 0 b Determine the type of test statistic to use Choose one c Find the value of the test statistic Round to three or more decimal places d Find the p value Round to three or more decimal places H x X a S OSO D P Q 00 NO DO

Statistics
ProbabilityLast year s mean hourly wage in dollars for all hospital clerical workers in a large state was 6 75 An administrator for the state believes that this year s mean hourly wage for hospital clerical workers is greater than last year s mean She hires statisticians to sample a number of hospital clerical workers and to carry out a hypothesis test State the null hypothesis Ho and the alternative hypothesis H that would be used for this test H 0 o 0 X D P S

Statistics
ProbabilityThere are 7 acts in a talent show A dancer a juggler a magician a pianist a singer a violinist and a whistler A talent show host randomly schedules the 7 acts Compute the probability of each of the following events Event A The first four acts are the whistler the juggler the pianist and the magician in any order Event B The singer is first the juggler is second the magician is third and the pianist is fourth Write your answers as fractions in simplest form P A P B 00

Statistics
ProbabilityA restaurant is reviewing customer complaints In a sample of 227 complaints 57 complaints were about the slow speed of the service Create a 95 confidence interval for the proportion of complaints that were about the slow speed of the service Use Excel to create the confidence interval rounding to four decimal places Provide your answer below

Statistics
ProbabilityClick the following link to view Saving and Investment data from FRED Then use that data to answer the following questions Real time data provided by Federal Reserve Economic Data FRED Federal Reserve Bank of Saint Louis For this exercise you will need to enter data from FRED for real gross private domestic investment GPDIC1 real private nonresidential fixed investment PNFIC1 and re private residential fixed investment PRFIC1 Using the data from FRED enter the values for the second quarter of 2023 shown as 2023 04 01 on FRED for the following series IDs Enter your answers exactly a they appear on FRED Title Real Gross Private Domestic Investment Real Private Nonresidential Fixed Investment Real Private Residential Fixed Investment Series ID GPDIC1 PNFIC1 PRFICI Value billions of constant dollars

Statistics
ProbabilityIn a recent survey 8 college graduates were each asked for the number of hours they work each week Here is a list of the responses 38 39 53 42 53 43 37 44 Find the range of the data set A