Probability Questions and Answers

Statistics
ProbabilityA pond contains 100 fish of which 27 are carp If 15 fish are caught what are the mean and variance of the number of carp among the 15 What assumptions are you making Let X denote the number of carp caught of the 15 fish caught What assumptions are you making Type your answers as integers or decimals Do not round O A X satisfies a hypergeometric distribution with parameters n N and o O B X satisfies a normal distribution with parameters OC X satisfies a exponential distribution with parameter OD X satisfies a binomial distribution with parameters n 6980336 and p and m

Statistics
ProbabilityCards from an ordinary deck are turned face up one at a time Compute the expected number of cards that need to be turned face up in order to obtain a 2 aces b 6 spades c all 13 diamonds HE a The expected number of cards that need to be turned face up in order to obtain 2 aces is Round to one decimal place as needed ct 0

Statistics
ProbabilityA fair die is rolled 20 times Calculate the variance of the sum of the rolls The expected sum of the 20 rolls is Type an integer or a simplified fraction HI

Statistics
ProbabilityA player throws a fair die and simultaneously flips a fair coin If the coin lands heads then she wins one third and if tails then she wins one half of the value that appears on the die Determine her expected winnings The expected winnings are Type an integer or a simplified fraction

Statistics
ProbabilityThe following data was calculated during a study on weight loss Interpret the p value for this hypothesis test A doctor would like to test the claim that the average weight loss after participating in a diet program is less than 10 pounds The test statistic is calculated as Zo 2 5 The p value is 0 0062 The probability of the observing value Zo 2 5 or greater if the null hypothesis is true is 99 38 The probability of the observing value Zo 2 5 or less if the null hypothesis is true is 99 38 O The probability of the observing value Zo 2 5 or greater if the null hypothesis is true is 0 62 O The probability of the observing value Zo 2 5 or less if the null hypothesis is true is 0 62

Statistics
ProbabilityA health and fitness club reviews the weights of all of their members and found that the average weight was 148 lb Is this value a statistic or a parameter O Statistic O Parameter

Statistics
ProbabilityHypothesis testing concepts For a test of Ho p 0 60 the test statistic is determined to be z 2 11 a If the alternative hypothesis is Ha p 0 60 The P value is 0 0174 four decimal places b If the alternative hypothesis is Ha p 0 60 The P value is 0 0174 four decimal places c For a test of Ho p0 60 the P value is places round to round to round to four decimal d Do either of the P values in b or c give significant evidence against Ho using a significance level of 5 O Both of the P values give significant evidence against Ho Neither of the P values suggest that the null hypothesis is plausible One of the P values gives significant evidence against Ho and the other P value indicates that the null hypothesis is plausible ONeither of the P values gives significant evidence against Ho Both of the P values indicate that the null hypothesis is plausible

Statistics
ProbabilityK The acceptable level for insect filth in a certain food item is 3 insect fragments larvae eggs body parts and so on per 10 grams A simple random sample of 50 ten gram portions of the food item is obtained and results in a sample mean of x 3 2 insect fragments per ten gram portion Complete parts a through c below a Why is the sampling distribution of x approximately normal OA The sampling distribution of x is assumed to be approximately normal B The sampling distribution of x is approximately normal because the sample size is large enough OC The sampling distribution of x is approximately normal because the population is normally distributed OD The sampling distribution of x is approximately normal because the population is normally distributed and the sample size is large enough b What is the mean and standard deviation of the sampling distribution of x assuming 3 and a 3 Hx Round to three decimal places as needed Round to three decimal places as needed of c What is the probability a simple random sample of 50 ten gram portions of the food item results in a mean of at least 3 2 insect fragments P x 3 2 Round to four decimal places as needed Is this result unusual OA This result is not unusual because its probability is large OB This result is unusual because its probability is small OC This result is unusual because its probability is large O D This result is not unusual because its probability is small What might we conclude A Since this result is unusual it is not reasonable to conclude that the population mean is higher than 3 OB Since this result is not unusual it is not reasonable to conclude that the population mean is higher than 3 OC Since this result is not unusual it is reasonable to conclude that the population mean is higher than 3 OD Since this result is unusual it is reasonable to

Statistics
ProbabilityAssume that the heights of of adult males in a certain region are normally distributed The heights in inches of 20 randomly selected adult males from this region are listed below 70 72 71 70 69 73 69 68 70 71 67 71 70 74 69 68 71 71 71 72 Use this sample data and construct a 98 confidence interval for the population standard deviation

Statistics
ProbabilityThe recommended hours of sleep per night for adults is 8 hours A doctor who works at a sleep study facility believes the average number of hours of sleep per night for adults is more than the recommended 8 hours To test this claim at 5 significance level the doctor collects the following data on a sample of 25 adults at a sleep study facility and records their amount of sleep the following is the data from this study sample size 25 adults sample mean 8 5 hours sample standard deviation 0 9 hours Identify the null and alternative hypothesis for this study by filling in the blanks with correct symbol Hop Select Ha p Select 8

Statistics
ProbabilitySuppose that the delivery times for a local pizza delivery restaurant are normally distributed with an unknown mean and standard deviation A random sample of 24 deliveries is taken and gives a sample mean of 27 minutes and sample standard deviation of 6 minutes The confidence interval is 24 47 29 53 Find the margin of error for a 95 confidence interval estimate for the population mean

Statistics
Probabilityhe pages per book in a library are normally distributed with an unknown opulation mean A random sample of books is taken and results in a 95 confidence interval of 237 293 pages What is the correct interpretation of the 95 confidence interval O We estimate with 95 confidence that the sample mean is between 237 and 293 pages O We estimate that 95 of the time a book is selected there will be between 237 and 293 pages O We estimate with 95 confidence that the true population mean is between 237 and 293 pages

Statistics
ProbabilityIn a large city s recent mayoral election 131 506 out of 309 153 registered voters actually turned out to vote If 20 registered voters are randomly selected find the probability that 7 of them voted in the mayoral election Use TI 84 plus calculator to find the binomial probability Round your answer to three decimal places

Statistics
ProbabilityA basketball player has a 0 654 probability of making a free throw If the player shoots 13 free throws what is the probability that she makes less than 6 of them Insert the correct symbol to represent this probability U P X Select V 5

Statistics
ProbabilityA casino features a game in which a weighted coin is tossed several times The table shows the probability of each payout amount To the nearest dollar what is the expected payout of the game round to the nearest whole dollar Payout Amount 150 0 161 2800 0 03 105000 0 0006 Probability

Statistics
ProbabilitySuppose A and B are mutually exclusive events and that P A 0 13 and P B 0 85 Find P A or B 0 98

Statistics
ProbabilityMatch each term with the correct definition given on the right 1 pt ea 1 Probability 2 Mutually Exclusive 3 Conditional Probability 4 Independent 5 Complement Rule 6 In 2014 15 Stephen Curry led the Golden State Warriors to their first NBA championship in forty years Curry was named the MVP of the league that year making over 44 of his 3 point attempts Here is a two way table summarizing the association between distance and outcome this Curry s shots during that year Suppose we select one of his shots at random Outcome of shot Made Missed Total At rim 218 99 317 a The event that a certain event does not happen b A number between 0 and 1 that describes the relative frequency of an event in a very large number of repetitions c Describes the probability that an event occurs given that another event is known to have occurred d If knowing the outcome of one even doesn t change the probability of another event e When two events cannot occur together 3 to 10 81 103 184 Distance from basket feet 10 to 16 55 68 123 16 to 3 point 115 164 279 3 point 386 493 879 7 What is the probability that Curry scored 2 pts USE PROBABILITY NOTATION Total 855 927 1782 8 What is the probability that Curry attempted a 3 point shot and made it 2 pts USE PROBABILITY NOTATIO 9 What is the probability that Curry attempted a shot from 10 to 16 feet or that he scored 2 pts

Statistics
Probability10 What is the probability that Curry attempted a shot at the rim given that he made the shot 2 pts USE PROBABITY NOTATION 11 If a shot taken was from 2 point range what was the probability that Curry made it 2 pts USE PROBABILITY NATATION denan And Go for it 12 The Philadelphia Eagles won Super Bowl LII 41 33 beating the New England Patriots Although the Eagles le for much of the game New England took a 1 point lead 33 32 in the fourth quarter During the next Eagles drive head coach Doug Pederson was faced with a difficult decision His team had the ball on their own 45 yard line with 5 39 left on the clock but it was 4th down and 1 yard to go NFL teams in this context have a wir probability of 0 367 If the Eagles chose to go for it and succeeded they would keep possession of the ball If the Eagles failed they would give the Patriots the ball in a favorable field position Coach Pederson made the decision to go for it Historically NFL teams succeed in converting 68 of all 4th and 1 attempts If Pederson and the Eagles chose to go for it and succeeded their probability to go on and win the game would be about 0 51 However if Pederson chose to go for it on 4th down and failed the Eagles would only have about a 0 18 probability to win the game SUCCESS Gain 1 Yard FAIL smer 14 15 16 yunluda207 F Win Game Lose Game Win Game latake

Statistics
Probability4 In the bottom of the ninth inning in a tie game the leadoff batter for the home team hits a double According to researcher Tom Tango teams in this situation have a win probability of 0 807 Because the home team only needs 1 run to win the game some managers will choose to have the next player attempt a sacrifice bunt which allows the runner on second base to reach third base while the hitter is thrown out If the sacrifice bunt is successful then the home team has a runner on third base with 1 out and a win probability of 0 830 However if the sacrifice bunt is unsuccessful and the runner is thrown out at third the home team has a runner on first with 1 out and a win probability of 0 637 Assume that the hitter is able to bunt the ball and doesn t strike out walk etc a Interpret the value of 0 807 in the context of this problem b Create a tree diagram for a sacrifice bunt attempt using the possible outcomes of the attempt as the first set of branches and the possible outcomes of the game as the second set of branches Assume that the hitter has a 0 75 probability of successfully executing the sacrifice bunt

Statistics
ProbabilityPart 2 Development issues Write your answer to the development questions in the space provided below clearly specifying your rating and including an appropriate justification Show all the details of your calculations 1 In winter in North America snow owl migrate south every four years in greater numbers The body size of snow owl follows a normal distribution with an average of 61 5 cm and a standard deviation of 4 75 cm A 5 points What is the probability that the size of a snow owl will be greater than 52 Cr B 5 points If we randomly select 10 snow oxen from this population what is the expected number of snow oxen in the sample whose size is between 46 3 cm and 52 cm

Statistics
Probability4 The one child policy is an official program launched in the late 1970s by the Chinese central government with the aim of limiting the number of children per family to one child We consider a family composed of the husband wife and an adult child and Let X be the number of smokers in this family The possible values of X are 0 1 2 3 Suppose that the probability mass function of X is given as follows F x c 4 x 0 5 pointe Fir For x 0 1 2 3 inotion

Statistics
Probability2 Many baseball pitchers can throw 3 different types of pitches fastball curve and change up A certain pitcher throws his fastball 55 of the time curveball 30 of the time and change up the remaining times The pitcher gets the batter out 70 of the time when he throws a fastball 60 of the time when he throws a curveball and 75 of the time when he throws a change up Randomly select one batter during a game a Express the provided information using probability notation b Display the provided information using a tree diagram Then calculate the probabilities of each of the 6 possible outcomes using the multiplication rule c Calculate the probability that the batter is not out d Given that the batter was out what is the probability that the pitcher threw a fastball 3 Candice loves to go bowling and she rolls a strike in 21 of her frames Assume the outcome of Candace s rolls are independent a What is the probability that Candace does not get a strike in a frame b What is the probability that Candace does not get a strike in 4 frames c What is the probability that Candace gets at least 1 strike in 4 frames

Statistics
Probabilityi 1 In 2018 quarterback Drew Brees had the highest statistical passer rating of any quarterback in the NFL The two way table summarizes the association between the quarter of the game and outcome of his pass attempts Suppose we select one pass attempt at random Quarter First 83 32 115 Second 115 44 159 Third 77 18 Fourth 80 29 109 Outcome Complete of pass attempt Incomplete Total a What is the probability that the pass attempt was in the first quarter 95 Total 355 123 478 b What is the probability that the pass attempt was after the first quarter c What is the probability that the pass attempt was in the first quarter and complete d What is the probability that the pass attempt was in the first quarter or complete e What is the probability that the pass attempt was in the first quarter given that it was complete f What is the probability that the pass attempt was complete given that it was in the first quarter g What is the probability that the pass attempt was complete given that it was after the first quarter h Explain what it means to say that the events Attempt was in the first quarter and Attempt was complete are independent Based on your previous answers are the events Attempt was in the first quarter and Attempt was complete independent Explain your reasoning

Statistics
ProbabilityQuestion 22 Which of the following could be the value of x if x 2 A B C D WSSISIWNIH q S x 29 9 9 5 9 x 18

Statistics
ProbabilityQuestion 15 What is 0 8749 rounded to the nearest hundredth have A 0 87 B 0 875 C 0 88 D 0 884 tenths hundredths thou


Statistics
ProbabilityThe perimeter of the trapezoid below is 42 cm What is its area A 576 cm B 112 cm C 48 cm D 24 cm 2 6 cm 12 cm 8 cm

Statistics
ProbabilitySection 1 Arithmetic Question 12 15 of what number is equal to 90 A 8 64 B 36 C 300 D 600

Statistics
ProbabilityQuestion 23 The perimeter of a rectangular yard is 84 meters What is its length if its width is twi ts length E 14 meters F 18 meters G 20 meters H 24 meters


Statistics
ProbabilityQuestion 32 What is the average of circumference of figure A and area of figure B 3 A 54 B 53 C 52 D 51 TO ST 16 Figure A 12 Figure B 5

Statistics
ProbabilityA swimming pool holds 3 500 cubic feet of water The swimming pool is 25 feet long and 10 feet wide How deep is the swimming pool A 2 B 4 C 6 D 14 01 3

Statistics
ProbabilityHow many tiles of 8 cm is needed to cover a floor of dimension 6 cm by 24 cm A 6 B 18 C 55 D 65

Statistics
ProbabilityQuestion 37 aujais mm 3 If the perimeter of the following figure be 23 what is the value of x A 4 B 6 C 8 D 11 3 X 5 5 X 3

Statistics
ProbabilityIf a b is divisible by 3 which of the following expression must also be divisible by 3 A 3a b B a 3b C a b D 4x axb

Statistics
ProbabilitySection 2 Quantitative Reasoning Question 36 If 1 6 then 25 A 25 A CC 5 DD 4 EE 25 FF 30

Statistics
ProbabilityA nutritionist wants to determine how much time nationally people spend eating and drinking Suppose for a random sample of 1079 people age 15 or older the mean amount of time spent eating or drinking per day is 1 22 hours with a standard deviation of 0 59 hour Complete parts a through d below a A histogram of time spent eating and drinking each day is skewed right Use this result to explain why a large sample size is needed to construct a confidence interval for the mean time spent eating and drinking each day OA Since the distribution of time spent eating and drinking each day is not normally distributed skewed right the sample must be large so that the distribution of the sample mean will be approximately normal OB The distribution of the sample mean will never be approximately normal OC Since the distribution of time spent eating and drinking each day is normally distributed the sample must be large so that the distribution of the sample mean will be approximately normal OD The distribution of the sample mean will always be approximately normal b There are more than 200 million people nationally age 15 or older Explain why this along with the fact that the data were obtained using a random sample satisfies the requirements for constructing a confidence interval OA The sample size is greater than 10 of the population B The sample size is greater than 5 of the population OC The sample size is less than 5 of the population D The sample size is less than 10 of the population c Determine and interpret a 95 confidence interval for the mean amount of time Americans age 15 or older spend eating and drinking each day Select the correct choice below and fill in the answer boxes if applicable in your choice Type integers or decimals rounded to three decimal places as needed Use ascending order OA The nutritionist is 95 confident that the mean amount of time spent eating or drinking per day is between and hours OB The nutritionist is 95 confident that the amount of time spent eating or drinking per day for any individual is hours between and OC There is a 95 probability that the mean amount of time spent eating or drinking per day is between hours OD The requirements for constructing a confidence interval are not satisfied d Could the interval be used to estimate the mean amount of time a 9 year old spends eating and drinking each day Explain and OA No the interval is about individual time spent eating or drinking per day and cannot be used to find the mean time spent eating or drinking per day for specific age OB Yes the interval is about the mean amount of time spent eating or drinking per day for people people age 15 or older and can be used to find the mean amount of time spent eating or drinking per day for 9 year olds OC No the interval is about people age 15 or older The mean amount of time spent eating or drinking per day for 9 year olds may differ OD Yes the interval is about individual time spent eating or drinking per day and can be used to find the mean amount of time a 9 year old spends eating and drinking each day E A confidence interval could not be constructed in part c

Statistics
ProbabilityClayton Kershaw of the Los Angeles Dodgers is one of the premier pitchers in baseball His most popular pitch is a four seam fastball The accompanying data represent the pitch speed in miles per hour for a random sample of 15 of his four seam fastball pitches Complete parts a through f Click here to view the data table Click here to view the standard normal distribution table page 1 Click here to view the standard normal distribution table page 2 Click here to view the table of critical t values Click here to view a table of critical values for the correlation coefficient d Are the requirements for constructing a confidence interval for the mean pitch speed of Clayton Kershaw s four seam fastball satisfied An interval be constructed because the data e Construct and interpret a 95 confidence interval for the mean pitch speed of Clayton Kershaw s four seam fastball Select the correct choice below and if necessary fill in the answer boxes to complete your choice approximately normal and there O A There is a 95 probability that the mean pitch speed of Kershaw s four seam fastball is between miles per hour Round to two decimal places as needed Use ascending order OB 95 of Kershaw s four seam fastballs are between and miles per hour Round to two decimal places as needed Use ascending order OC One can be 95 confident that the mean pitch speed of Kershaw s four seam fastball is between miles per hour Round to two decimal places as needed Use ascending order OD The interval cannot be found The interval for all pitchers in a league would be and f Do you believe that a 95 confidence interval for the mean pitch speed of four seam fastballs for all major league pitchers would be narrower or wider Why and than the variability between pitches for one pitcher because the variability between pitchers is most likely

Statistics
ProbabilityIn the probability distribution to the right the random variable X represents the number of hits a baseball player obtained in a game over the course of a season Complete parts a through f below a Verify that this is a discrete probability distribution This is a discrete probability distribution because and the of the probabilities is Type whole numbers Use ascending order b Draw a graph of the probability distribution Describe the shape of the distribution Graph the probability distribution Choose the correct graph below OA 0 4 0 3 0 2 0 1 0 9 012345 Number of Hits Q Q The distribution O B 0 4 0 3 0 2 0 1 04 012345 Number of Hits Describe the shape of the distribution Q O C 0 4 0 3 0 2 0 1 and is c Compute and interpret the mean of the random variable X Hx hits Type an integer or a decimal Do not round Which of the following interpretations of the mean is correct off 012345 Number of Hits Q Q G OD 0 4 0 3 X 0 between and inclusive 0 24 0 1 0 0x Round to three decimal places as needed e What is the probability that in a randomly selected game the player got 2 hits P x D 0 1661 0 3357 0 2878 1 2 3 0 1492 4 0 0364 5 0 0248 012345 Number of Hits Q Q OA The observed number of hits per game will be equal to the mean number of hits per game for most games B In any number of games one would expect the mean number of hits per game to be the mean of the random variable OC Over the course of many games one would expect the mean number of hits per game to be the mean of the random variable OD The observed number of hits per game will be less than the mean number of hits per game for most games d Compute the standard deviation of the random variable X hits

Statistics
ProbabilityThe shape of the distribution of the time required to get an oil change at a 10 minute oil change facility is unknown However records indicate that the mean time is 10 6 minutes and the standard deviation is 3 1 minutes a To compute probabilities regarding the sample mean using the normal model what size sample would be required The sample size needs to be greater than 30 The normal model cannot be used if the shape of the distribution is unknown The sample size needs to be less than 30 Any sample size could be used b The probability that a random sample of n 42 oil changes results in a sample mean time less than 10 minutes is approximately Round to 4 decimal places c Suppose the manager agrees to pay each employee a 50 bonus if they meet a certain goal On a typical Saturday the oil change facility will perform 45 oil changes between 10 A M and 12 P M Treating this as a andom sample at what mean oil change time would there be a 9 chance of being at or below This will e the goal established by the manager here would be a 9 chance of being at or below minutes Round to the nearest 1

Statistics
ProbabilityLet X denote the life length in hours of a battery Suppose X is known to be normally distributed with standard deviation o 2 25 hours A random sample of 12 batteries has an average life of x 51 3 hours We are interested in determining whether there is evidence to support the claim that mean battery life exceeds 50 hours Using a level of significance of 0 05 answer the following questions Part a 4 points State the null and alternative hypothesis for the appropriate hypothesis test Mo u S50hrs M 750 hrs z el Part b 5 points Identify the test statistic and p value teast statistic JJ If P 2 0 05 Pr value reject Part c 3 points State the conclusion of the test in the problem context is less equal M vahe we D is fo 2 score 51 3 50 2 25 112 Li reject greater we Ho than 2 0014 than If fail on 40 1

Statistics
Probability20 General data analysis skills a Explain the difference between quantitative and qualitative data b Explain the difference between independent variable and dependent variable c Where do each of these go on a graph d List the 5 essential parts of a graph e Be able to graph data and read a graph
Statistics
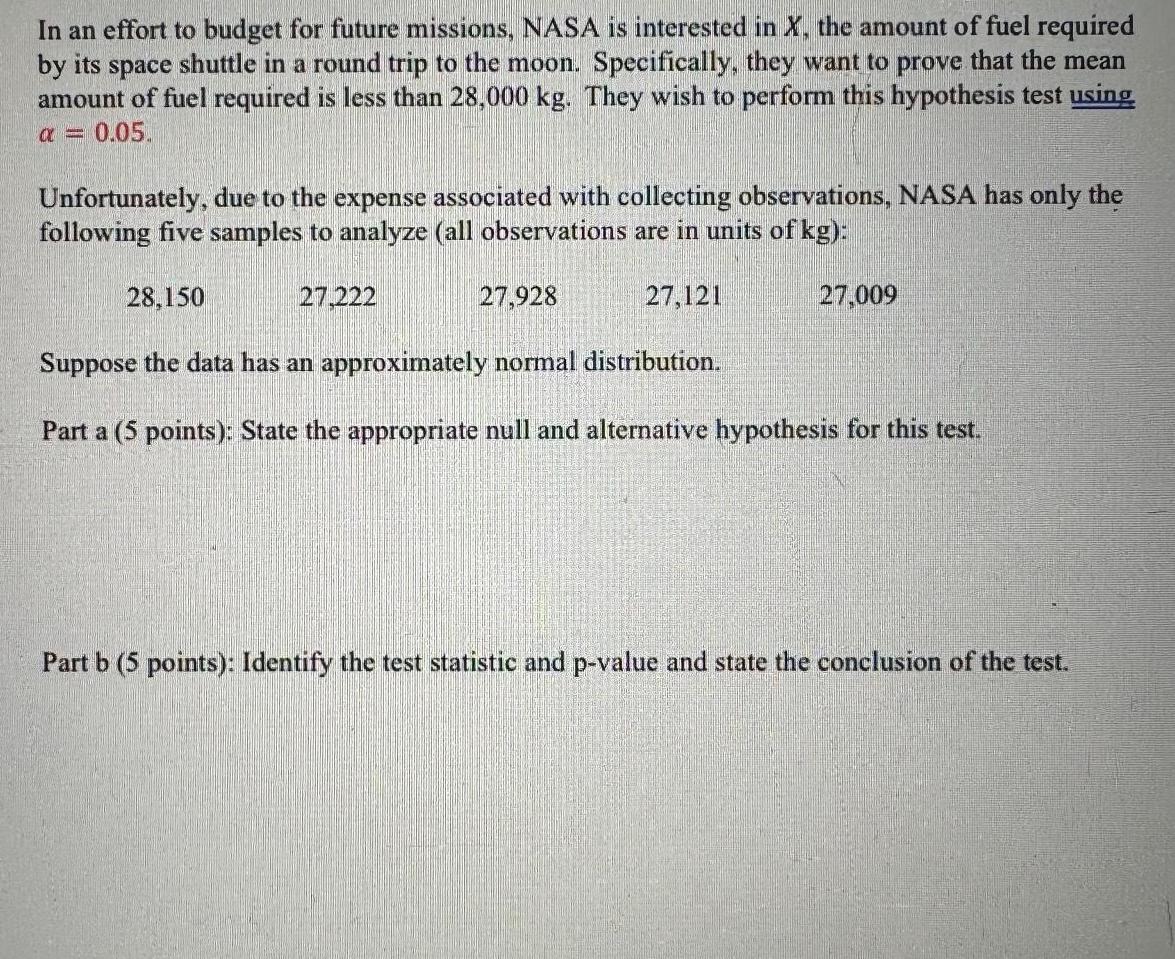
ProbabilityIn an effort to budget for future missions NASA is interested in X the amount of fuel required by its space shuttle in a round trip to the moon Specifically they want to prove that the mean amount of fuel required is less than 28 000 kg They wish to perform this hypothesis test using 0 05 Unfortunately due to the expense associated with collecting observations NASA has only the following five samples to analyze all observations are in units of kg 28 150 Suppose the data has an approximately normal distribution Part a 5 points State the appropriate null and alternative hypothesis for this test 27 222 27 928 27 121 27 009 Part b 5 points Identify the test statistic and p value and state the conclusion of the test
Statistics
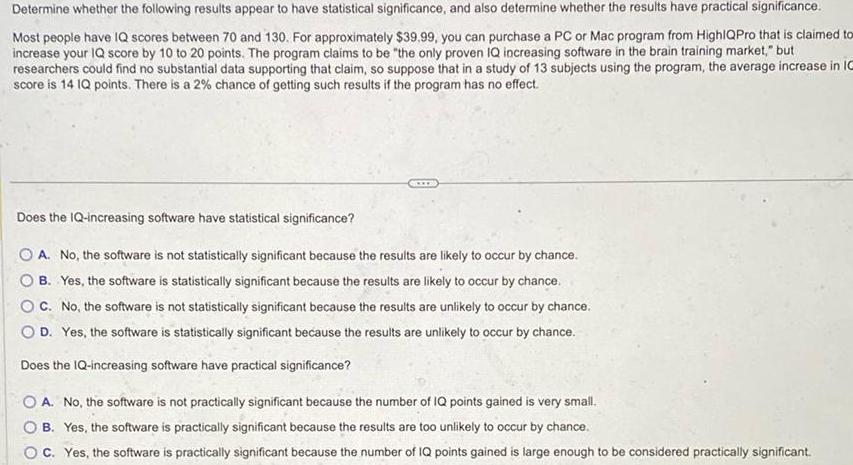
ProbabilityDetermine whether the following results appear to have statistical significance and also determine whether the results have practical significance Most people have IQ scores between 70 and 130 For approximately 39 99 you can purchase a PC or Mac program from HighlQPro that is claimed tox increase your IQ score by 10 to 20 points The program claims to be the only proven IQ increasing software in the brain training market but researchers could find no substantial data supporting that claim so suppose that in a study of 13 subjects using the program the average increase in 10 score is 14 IQ points There is a 2 chance of getting such results if the program has no effect Does the IQ increasing software have statistical significance A No the software is not statistically significant because the results are likely to occur by chance B Yes the software is statistically significant because the results are likely to occur by chance C No the software is not statistically significant because the results are unlikely to occur by chance O D Yes the software is statistically significant because the results are unlikely to occur by chance Does the IQ increasing software have practical significance A No the software is not practically significant because the number of IQ points gained is very small OB Yes the software is practically significant because the results are too unlikely to occur by chance C Yes the software is practically significant because the number of IQ points gained is large enough to be considered practically significant
Statistics
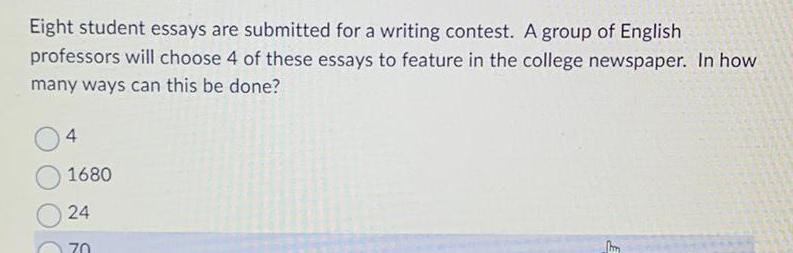
ProbabilityEight student essays are submitted for a writing contest A group of English professors will choose 4 of these essays to feature in the college newspaper In how many ways can this be done 4 1680 24 hm
Statistics
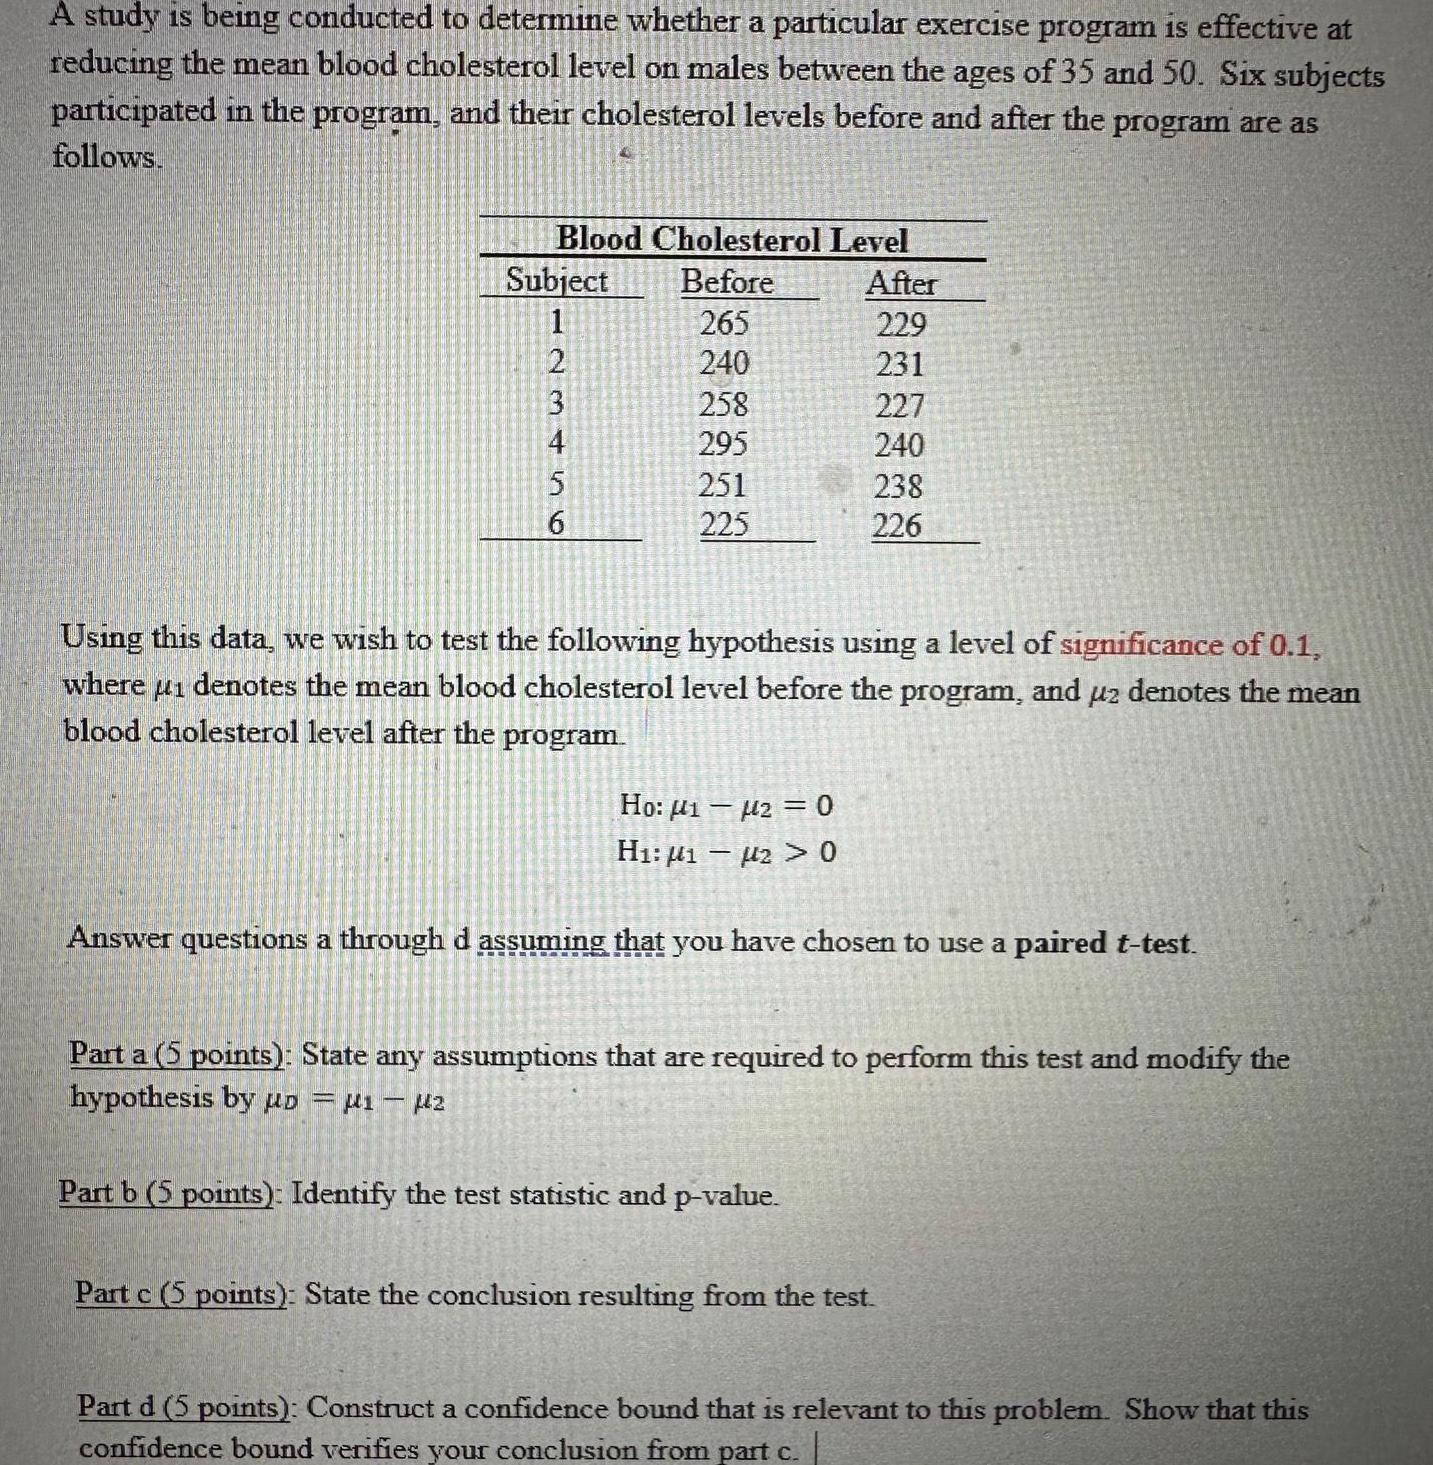
ProbabilityA study is being conducted to determine whether a particular exercise program is effective at reducing the mean blood cholesterol level on males between the ages of 35 and 50 Six subjects participated in the program and their cholesterol levels before and after the program are as follows Blood Cholesterol Level Before 265 240 Subject 1 23456 2 4 258 295 251 225 Using this data we wish to test the following hypothesis using a level of significance of 0 1 where 1 denotes the mean blood cholesterol level before the program and uz denotes the mean blood cholesterol level after the program Ho 120 H 12 0 After 229 231 227 240 238 226 Answer questions a through d assuming that you have chosen to use a paired t test Part a 5 points State any assumptions that are required to perform this test and modify the hypothesis by D 1 2 Part b 5 points Identify the test statistic and p value Part c 5 points State the conclusion resulting from the test Part d 5 points Construct a confidence bound that is relevant to this problem Show that this confidence bound verifies your conclusion from part c
Statistics
ProbabilityWhy is Depreciation and amoritization expenses treated different from other expenses

Statistics
ProbabilityHow do you interpret the NPV Profitability Index e g PI 1 20 or NPV 2 million on an investment of 10 million what does it mean Chapter 11
Statistics
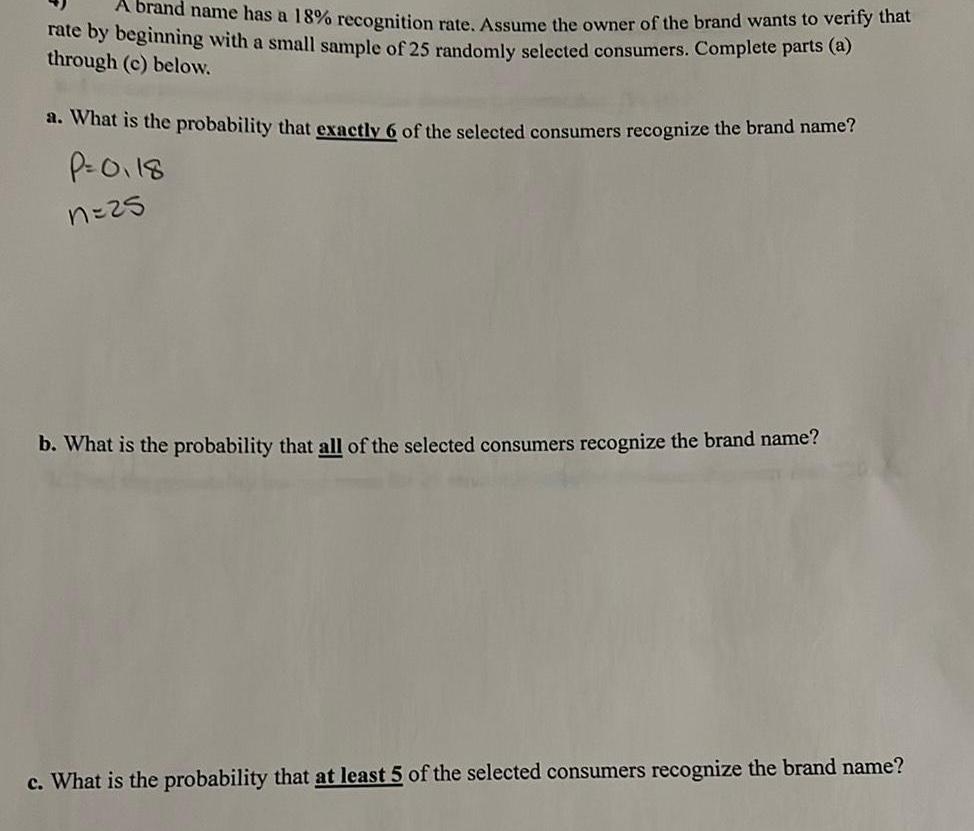
ProbabilityA brand name has a 18 recognition rate Assume the owner of the brand wants to verify that rate by beginning with a small sample of 25 randomly selected consumers Complete parts a through c below a What is the probability that exactly 6 of the selected consumers recognize the brand name P 0118 n 25 b What is the probability that all of the selected consumers recognize the brand name c What is the probability that at least 5 of the selected consumers recognize the brand name