Probability Questions and Answers

Statistics
ProbabilityA news service conducted a survey of 1040 adults ages 18 years or older in a certain country August 31 September 2 2015 The respondents were asked Of every tax dollar that goes to the federal government how many cents of each dollar would you say are wasted The four possible responses are that the federal government wastes less than 10 cents between 11 cents and 25 cents between 26 cents and 50 cents or 51 cents more Of the 1040 individuals surveyed 35 indicated that 51 cents or more is wasted The news service reported that 35 of all adults in the country 18 years or older believe the federal government wastes at least 51 cents of each dollar spent with a margin of error of 6 and a 99 leve of confidence Complete parts a through e below a What is the research objective OA To determine the percent of adults in the country who believe the federal government wastes 51 cents or more of every dollar B To determine the number of adults in the country who believe the federal government wastes tax dollars C To determine the number of adults in the country OD To determine the number of adults in the country paying their taxes to the federal government

Statistics
ProbabilitySuppose that a random sample of size 64 is to be selected from a population with mean 50 and standard deviation 7 USE SALT a What are the mean and standard deviation of the sampling distribution of x Hx ox Describe the shape of the sampling distribution of x The shape of the sampling distribution of x is Select b What is the approximate probability that x will be within 0 5 of the population mean u Round your answer to four decimal places c What is the approximate probability that x will differ from by more than 0 8 Round your answer to four decimal places

Statistics
ProbabilityFind the indicated probability 100 employees of a company are asked how they get to work and whether they work full time or part time the results are shown below If one of the 100 employees is randomly selected find the probability that the person drives alone or cycles to work 1 Public transportation 7 full time 8 part time 2 Bicycle 5 full time 4 part time 3 Drive alone 32 full 26 part time 4 Carpool 8 full time 10 part time O 0 43 O 0 67 O 0 58

Statistics
ProbabilityFind the indicated probability The table below describes the smoking habits of a group of asthma sufferers Smoking Habits of Asthma Sufferers Occasional Smoker 37 34 71 Men Women Total Nonsmoker Doesn t Smoke 366 318 684 Regular Smoker 72 72 144 the answer is none of these choices O 0 591 O 0 462 Heavy Smoker 30 35 65 Total 505 459 964 If one of the 964 people is randomly selected find the probability that the person is a man or a heavy smoker

Statistics
ProbabilityFind the indicated probability A bag contains 6 red marbles 3 blue marbles and 7 green marbles If a marble is randomly selected from the bag what is the probability that it is blue O 0 0625 O 0 231 O 0 188 O 0 333

Statistics
ProbabilityA fair coin is tossed two times in succession The set of equally likely outcomes is HH HT TH TT Find the probability of getting the same outcome on each toss 1123 03 0 4 1 14

Statistics
ProbabilityA recent study examined the effects of carbon monoxide exposure on a group of construction workers The following table presents the numbers of workers who reported various symptoms along with the shift morning evening or night that they worked Influenza Headache Weakness Shortness of Breath Send data to Excel Part 0 4 Morning Shift 17 32 11 4 Part 1 of 4 Evening Shift 10 27 18 7 Test the hypothesis of independence Use the a 0 05 level of significance and the P value method with the TI 84 Plus calculator What do you conclude Night Shift 18 6 9 10 State the null and alternate hypotheses Ho The shift and reported symptoms Choose one H The shift and reported symptoms Choose one independent independent

Statistics
ProbabilityMatch the terms to the correct symbols n gives the Population Mean Sample Mean Population Size Sample Size Population Standard Deviation Sample Standard Deviation gives the Population Mean Sample Mean Population Size Sample Size Population Standard Deviation Sample Standard Deviation gives the Population Mean Sample Mean Population Size Sample Size Population Standard Deviation Sample Standard Deviation

Statistics
ProbabilityAt an unconventional casino you bet on the roll of an 18 sided die If you roll a 7 you win 2 If you roll a 1 or 18 you win 1 If you roll a 13 you lose 3 If you roll any other number you lose 1 to the casino Let X denote the amount of money you win from playing this game once a Fill in the table to create a probability distribution for X Use fractions or decimals rounded to three decimal places when necessary Please enter values into the table as they were introduced in the paragraph above P x 2 1 3 1 X 18 710 b Find the expected profit Round to the nearest cent two decimal places c Is this game profitable for you How does the expected value tell you whether it is profitable or not
Statistics
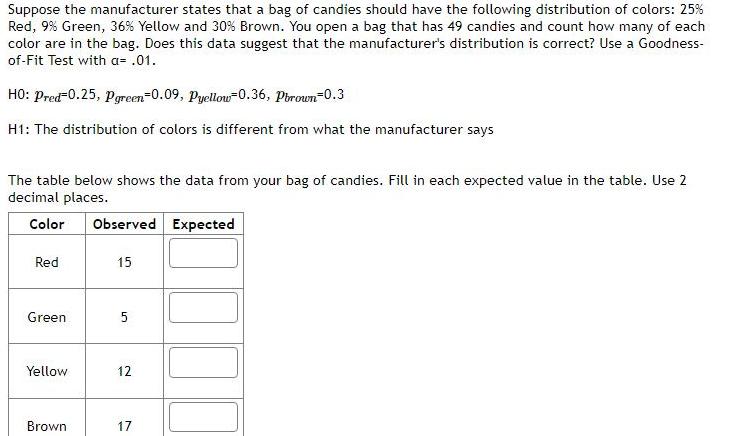
ProbabilitySuppose the manufacturer states that a bag of candies should have the following distribution of colors 25 Red 9 Green 36 Yellow and 30 Brown You open a bag that has 49 candies and count how many of each color are in the bag Does this data suggest that the manufacturer s distribution is correct Use a Goodness of Fit Test with a 01 HO Pred 0 25 Pgreen 0 09 Pyellow 0 36 Pbrown 0 3 H1 The distribution of colors is different from what the manufacturer says The table below shows the data from your bag of candies Fill in each expected value in the table Use 2 decimal places Color Observed Expected 15 Red Green Yellow Brown 5 12 17

Statistics
ProbabilityA total of 330 children and adults attended a school play There were 21 times as many children in attendance as there were adults How many children and adults attended Write the Equations Find the number of adults Find the number of children

Statistics
ProbabilityWhat two numbers have a sum of 217 and a difference of 85 Note Write you answer in order from highest to lowest Ex 10 and 8 and

Statistics
ProbabilityWhich graph represents the system of inequalities y 2x 1 y 3x 5 2 2 3 3 5 2 4 S N 2 3 4

Statistics
ProbabilitySolve by substitution or elimination by subtraction or addition 4x 15y 17 4x 20y 52


Statistics
Probabilitystem of inequalities linear inequalities 8 6 B C 4 A 7z 14y 0 8 6 0 61 8 2 is graphed Which region below represents the solution to the system of 4 D 6 M 8

Statistics
Probability1 A drawer contains 3 black socks 6 white socks 1 green sock and 10 blue socks Determine the probability of randomly selecting a sock that is not green

Statistics
ProbabilityA B D 9 Amounts of Trall Mix 15 2 XXXXX 1 4 How much total trail mix in cups did Elijah eat 15 4 Xx Cup xx 3 4

Statistics
ProbabilityThere is a spinner with 18 equal areas number 1 18 If the spinner is spun one time what is the probability that the result is a multiple of 2 or a multiple of 5 P multiple of 2 or multiple of 5

Statistics
ProbabilityA bag contains flavored lollipops A lollipop will be randomly selected from the bag 17 lollipops are grape flavored 8 lollipops are cherry flavored 14 lollipops are watermelon flavored 16 lollipops are strawberry flavored What is the probability in decimal form that the selected lollipop will be either cherry flavored or watermelon flavored

Statistics
ProbabilityThe national average SAT score is roughly 1500 We would like to see if the high school seniors who apply to Duke have higher than average SAT scores We randomly sample 100 applicants files and record their SAT scores Which of the following is the correct set of hypotheses for this research question Hint think about how many samples we have data from O Ho x 1500 HA 1500 O Ho H 1500 HA H 1500 O Ho P 1500 HA P 1500 O Ho H 1500 HA H 1500 Ho H Duke H National HA H Duke National

Statistics
ProbabilityMore than 18 of people support legalizing gay marriage Express the null and alternative hypotheses in symbolic form for this claim enter as a percentage Ho P H p Use the following codes to enter the following symbols enter

Statistics
ProbabilityThe mean weight of male nurses working at a local hospital is more than 174 lbs Express the null and alternative hypotheses in symbolic form for this claim Ho p H p Use the following codes to enter the following symbols enter


Statistics
ProbabilityUse the quadratic formula to solve the equation Be sure to simplify your answers Enter both answers separated by a comma 4x 64 0


Statistics
ProbabilitySolve the equation 6x 10 3 algebraically If your answer is a fraction write it in reduced fraction form Do NOT convert the answer to a decimal X


Statistics
Probability6 A box contains 4 red and 3 green ornaments TWO ornaments are randomly selected without replacement Find the indicated probabilities A What is the probability both ornaments are red B What is the probability that the 1st one is red and the 2nd one is green C What is the probability both ornaments are the same color

Statistics
ProbabilityE 5 A store offers a special Christmas purchase in which for a fixed cost you can choose from 1 of two pants 1 of four shirts and 1 of five ties How many different outfits are available

Statistics
ProbabilityIn the class we have discussed about how to derive the probability of type ll for the lower tailed test Please follow the similar procedure and derive the probability of type Il error B u for the upper tailed test and two tailed test Alternative Hypothesis 09 Hai 0 Hai Ho Ha H0 Type II Error Probability for a Level a Test 20 10 za 10 1 20 2 140 1 9 30 2 160 1 2a

Statistics
ProbabilityA company has a policy of retiring company cars this policy looks at number of miles driven purpose of trips style of car and other features The distribution of the number of months in service for the fleet of cars is bell shaped and has a mean of 47 months and a standard deviation of 11 months Using the empirical rule as presented in the book what is the approximate percentage of cars that remain in service between 25 and 36 months Do not enter the percent symbol ans

Statistics
ProbabilityChapter 3 3 4 The probability of an event and the probability of its complement always sum to a 1 d between 0 and 1 b o c 1 The area under the curve to the right of z 0 is a 0 6816 b 1 0000 c 0 5000 d o

Statistics
ProbabilityConstruct a Binomial probability distrubtion table using n 5 and p 0 23 Next record the mean an standard deviation of the distribution below Where necessary round all numbers to four decimal places O 2 3 ST 5 1 15 x 0 2648 0 3794 0 2424 0 0886 0 0208 0 0021 P x X X X X X X

Statistics
ProbabilityCan the following table be a probability distribution P x 1 0 3256 0 1755 0 1402 4 0 234 0 1247 8 23WN 5

Statistics
ProbabilityA fair coin is flipped 14 times Find the probability that more than 6 of the flips turn up tails 0 604736 0 453879 0 633746 0 545104 0 662034

Statistics
ProbabilityIn a recent survey 35 indicated chocolate was their favorite flavor of ice cream Suppose we select a sample of nine people and ask them to name their favorite flavor of ice cream a How many of those in the sample would you expect to name chocolate Round answer to 2 decimal places Expected number of people b What is the probability exactly six of those in the sample name chocolate Round answer to 4 decimal places Probability c What is the probability that six or more name chocolate Round answer to 4 decimal places Probability

Statistics
ProbabilityAn internal study by the Technology Services department at Lahey Electronics revealed company employees receive an average of 4 emails per hour Assume the arrival of these emails is approximated by the Poisson distribution a What is the probability Linda Lahey company president received exactly 1 email between 4 P M and 5 P M yesterday Round answer to 4 decimal places Probability b What is the probability she received 5 or more emails during the same period Round answer to 4 decimal places Probability c What is the probability she did not receive any emails during the period Round answer to 4 decimal places Probability

Statistics
ProbabilitySuppose you wish to find out the answer to the age old question Do people prefer Cola 1 or Cola 2 You conduct a blind taste test in which individuals are randomly asked to drink one of the colas first followed by the other cola and then asked to disclose which drink they prefer Results of your taste test indicate that 47 of 100 individuals prefer Cola 2 Complete parts a through c a Conduct a hypothesis test preferably using technology Ho p Po versus H p po for po 0 36 0 37 0 38 0 56 0 57 0 58 at the x 0 05 level of significance For which values of po do you not reject the null hypothesis What do each of the values of po represent Do not reject the null hypothesis for the values of po between and inclusively Type integers or decimals Do not round

Statistics
ProbabilityFor every football game there is a team that is expected to win by a certain number of points In betting parlance thi is called the spread If point spreads are accurate we would expect about half of all games played to result in the favored team winning beating the spread and about half of all games to result in the team favored to not beat the spread The accompanying data represent the results of 45 randomly selected games where a 0 indicates the favor team did not beat the spread and a 1 indicates the favored team beat the spread Do the data suggest that sport books establish accurate spreads Click the icon to view the spread results Because npo 1 Po Round to one decimal place as needed Spread Results 110 00 1 1 000 0 0 0 10 the sample size is 1 0 0 0 1 0 1 1 0 1 1 5 of the population size and the sample the requirements for testing the hypothesis satisfied 00 1 1 1 0 1 1 10 X

Statistics
ProbabilityComplete parts a through c below of variables were measured for all tornadoes in the United States in 2017 Ho H a Since 1950 the proportion of tornadoes that have been FO is 0 465 Test whether a different proportion of FO tornadoes occur in Texas than nationally Note Treat the tornadoes that struck in Texas as a simple random sampl all tornadoes that struck Texas since 1950 using a 0 05 level of significance The summarized data show that 82 o 168 tornadoes in Texas were FO during 2017 State the null and alternative hypotheses 0 of 1 Type integers or decimals Do not round Save

Statistics
ProbabilityConstruct a Binomial probability distrubtion table using n 5 and p 0 23 Next record the mean and standard deviation of the distribution below Where necessary round all numbers to four decimal places P x l b 11 x


Statistics
ProbabilityThe time required to assemble a part of a machine follows an exponential probability distribution with a mean of 16 minutes Round your answers to four decimal places a What is the probability that the part can be assembled in 9 minutes or less b What is the probability that the part can be assembled between 4 5 and 9 minutes Need Help Read It

Statistics
ProbabilityStep 2 This is a binomial experiment with n 18 trials Let a success be that a student withdraws from the course It is given that 15 of students withdraw Recall the method used to find the probability of an event given a percentage probability Thus the probability p a student withdraws from the course is as follows given percentage probability 100 p 0 15 given percentage 100 0 4797 100 X X For 2 or fewer students to withdraw from the course means that exactly Select students withdraw Therefore x will be 0 and 1 probability that 2 or fewer students withdraw from the course will be Select Submit Skip you cannot come back X The probability of each x value is f x so the

Statistics
ProbabilityYou may need to use the appropriate appendix table or technology to answer this question Consider a binomial experiment with n 10 and p 0 10 a Compute f 0 Round your answer to four decimal places f 0 0 3487 b Compute f 2 Round your answer to four decimal places f 2 0 9995 X c Compute P x 2 Round your answer to four decimal places P x 2 0 1937 d Compute P x 1 Round your answer to four decimal places P x 1 e Compute E x E x f Compute Var x and o Round your answer for o to two decimal places Var x

Statistics
Probabilitya Compute the probability that none of the appeals will be successful Since there are only two outcomes this can be thought of as a binomial experiment Recall the binomial probability function below where x is the number of success p is the probability of a success on one trial and there are n trials probability A sample of 10 first round appeals have been received so we have n Let p be the probability that a first round appeal was successful It is given that 35 of first round appeals were successful This percentage must be converted to a probability as follows P Submit f x p 1 p x n x n x percentage 100 35 100 p n x where Of interest is the probability that none of the appeals will be successful Letting x be the number of successful appeals the probability that x Skip you cannot come back is to be found

Statistics
ProbabilitySuppose you model a game of chance with a discrete probability distribution Let X be the net amount o money won or lost by the player Let P X be the probability of the corresponding outcome The three events are as follows There is a 23 chance the player wins 3 dollars There is a 47 chance the player breaks even There is a 30 chance the player loses 6 dollars Complete the table below to model the scenario X P X