Probability Questions and Answers
Statistics
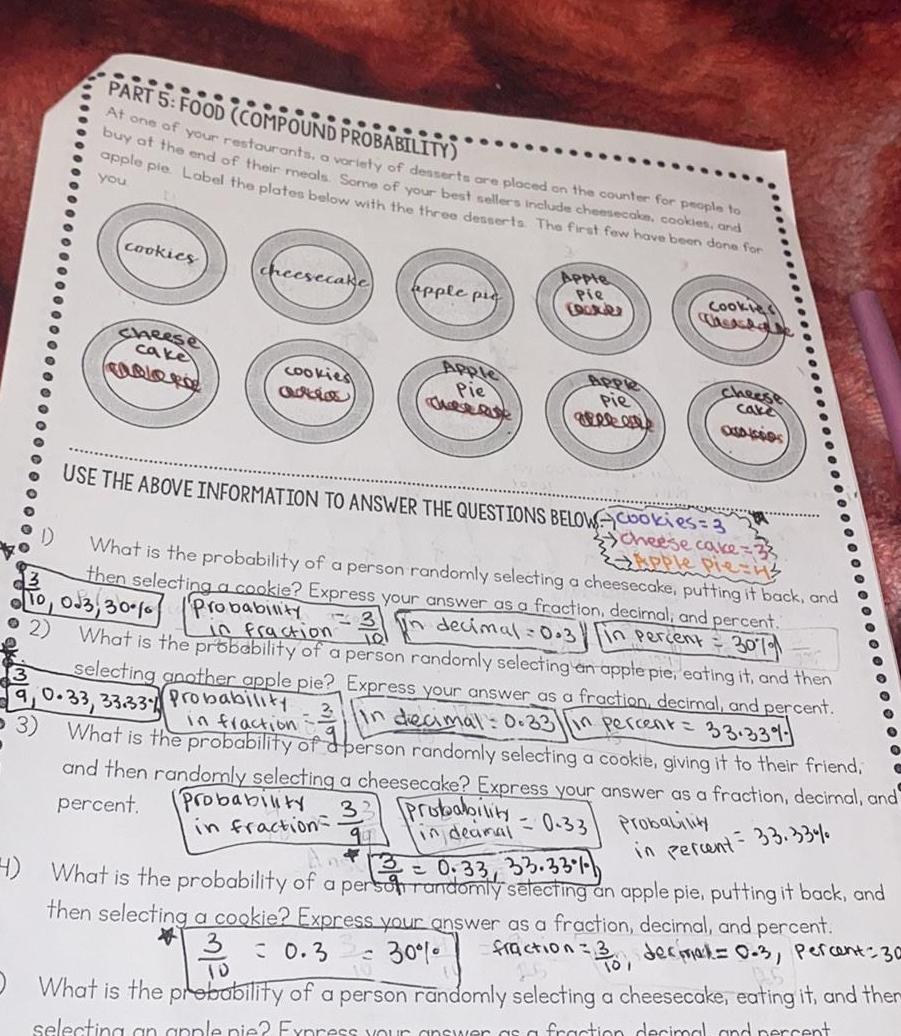
Probability1 PART 5 FOOD COMPOUND PROBABILITY At one of your restaurants a variety of desserts are placed on the counter for people to buy at the end of their meals Some of your best sellers include cheesecake cookies and apple pie Label the plates below with the three desserts The first few have been done for you cookies Cheese cake COLORO cheesecake G apple pic Apple Pie Apple Pie lates Apple Pie greke Probability in deamal Cookies cheese cake OSAICODS USE THE ABOVE INFORMATION TO ANSWER THE QUESTIONS BELOW Cookies 3 cheese cake What is the probability of a person randomly selecting a cheesecake putting it back and then selecting a cookie Express your answer as a fraction decimal and percent In decimal 0 3 in percent 30 9 10 023 30 0 Probability G 2 in fraction 3 in What is the probability of a person randomly selecting an apple pie eating it and then selecting another apple pie Express your answer as a fraction decimal and percent 9 0 33 33 33 Probability In decimal 0 33 in percent 33 33 What is the probability of a person randomly selecting a cookie giving it to their friend and then randomly selecting a cheesecake Express your answer as a fraction decimal and percent Probability in fraction 0 33 Probability in fraction O O in percent 33 33 0 33 33 33 4 What is the probability of a person randomly selecting an apple pie putting it back and then selecting a cookie Express your answer as a fraction decimal and percent 3 30 fraction 3 decimal 0 3 percent 30 What is the probability of a person randomly selecting a cheesecake eating it and ther 3 0 3 TO selecting an apple pie Express your answer as a fraction decimal and percent
Statistics
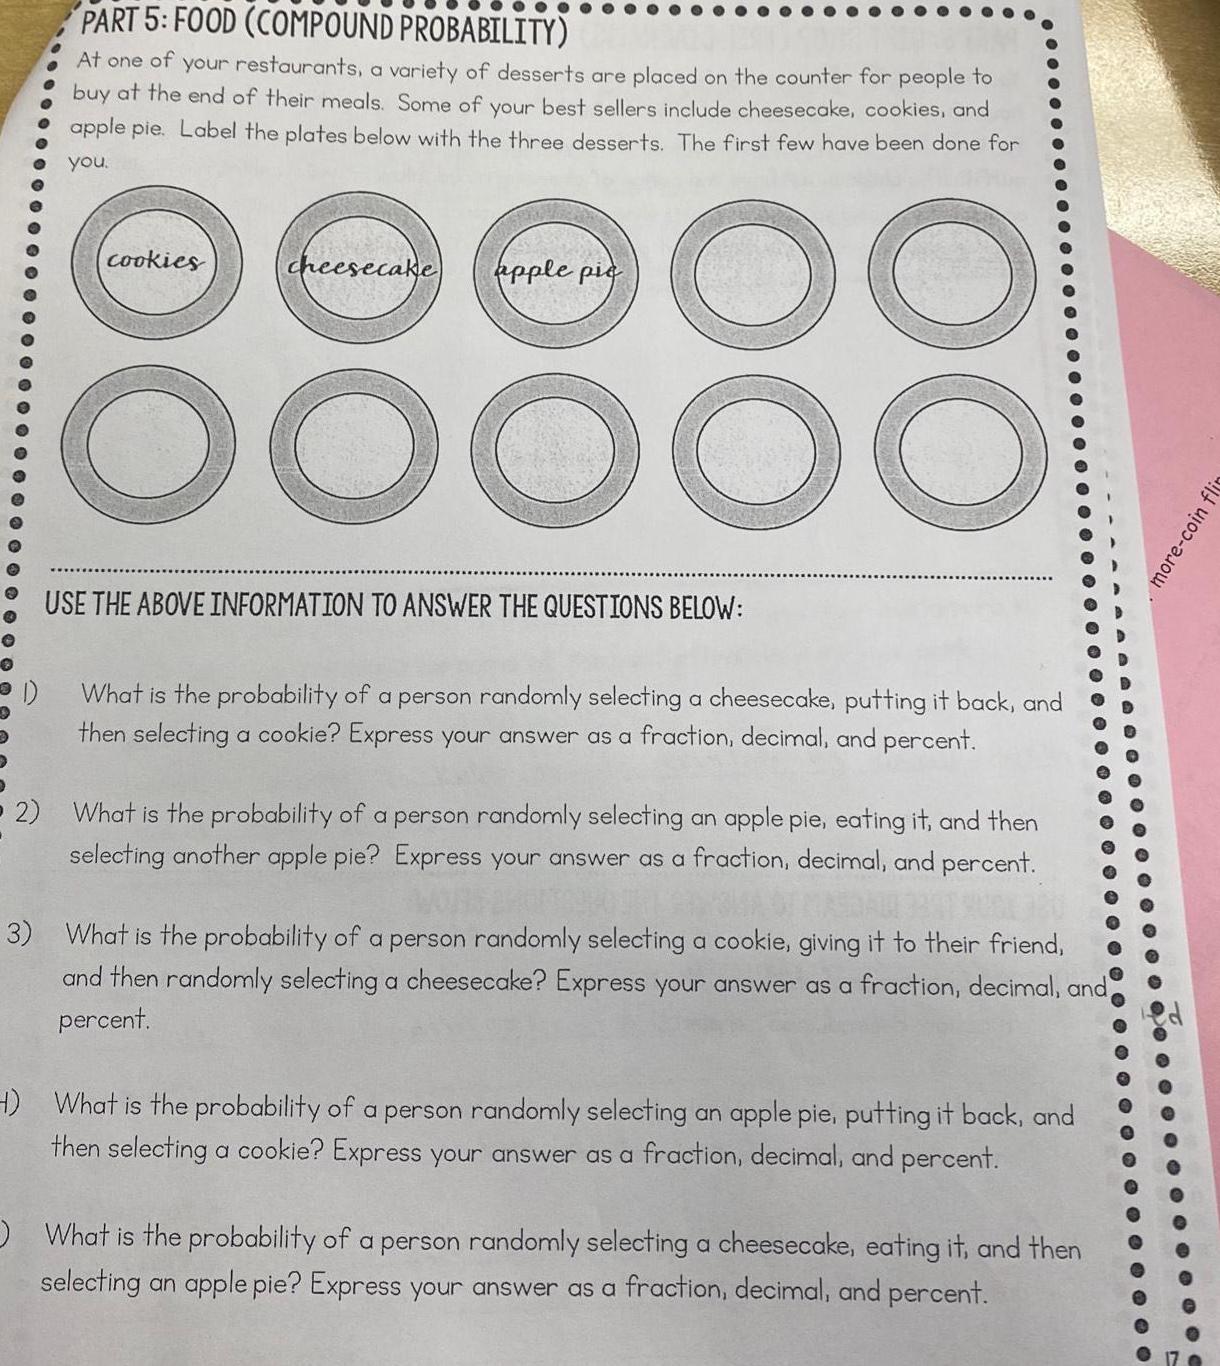
ProbabilityPART 5 FOOD COMPOUND PROBABILITY At one of your restaurants a variety of desserts are placed on the counter for people to buy at the end of their meals Some of your best sellers include cheesecake cookies and apple pie Label the plates below with the three desserts The first few have been done for you 00 cookies cheesecake apple pic OOOO0 USE THE ABOVE INFORMATION TO ANSWER THE QUESTIONS BELOW What is the probability of a person randomly selecting a cheesecake putting it back and then selecting a cookie Express your answer as a fraction decimal and percent 2 What is the probability of a person randomly selecting an apple pie eating it and then selecting another apple pie Express your answer as a fraction decimal and percent 3 What is the probability of a person randomly selecting a cookie giving it to their friend and then randomly selecting a cheesecake Express your answer as a fraction decimal and percent H What is the probability of a person randomly selecting an apple pie putting it back and then selecting a cookie Express your answer as a fraction decimal and percent What is the probability of a person randomly selecting a cheesecake eating it and then selecting an apple pie Express your answer as a fraction decimal and percent 3 more coin flin
Statistics
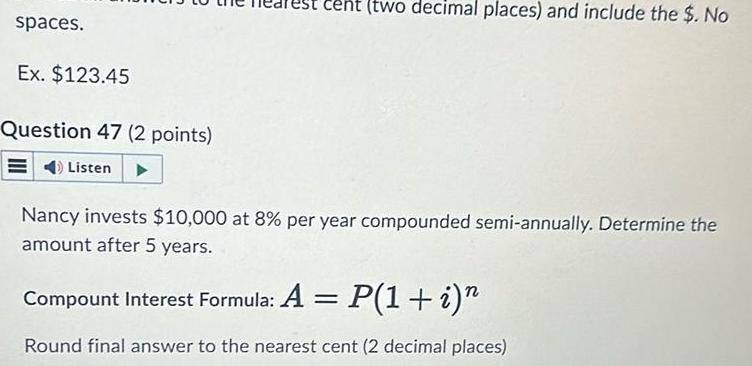
Probabilityspaces Ex 123 45 Question 47 2 points Listen two decimal places and include the No Nancy invests 10 000 at 8 per year compounded semi annually Determine the amount after 5 years Compount Interest Formula A P 1 i Round final answer to the nearest cent 2 decimal places
Statistics
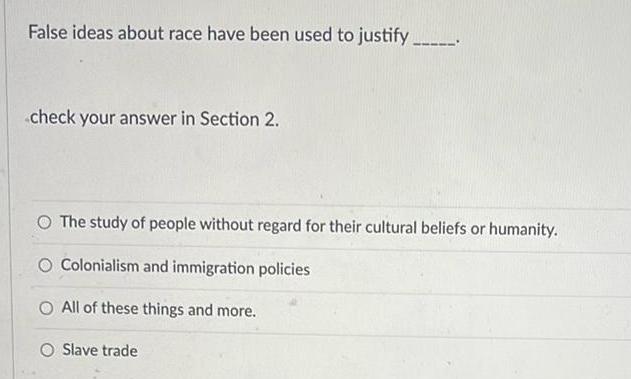
ProbabilityFalse ideas about race have been used to justify check your answer in Section 2 O The study of people without regard for their cultural beliefs or humanity O Colonialism and immigration policies O All of these things and more O Slave trade
Statistics
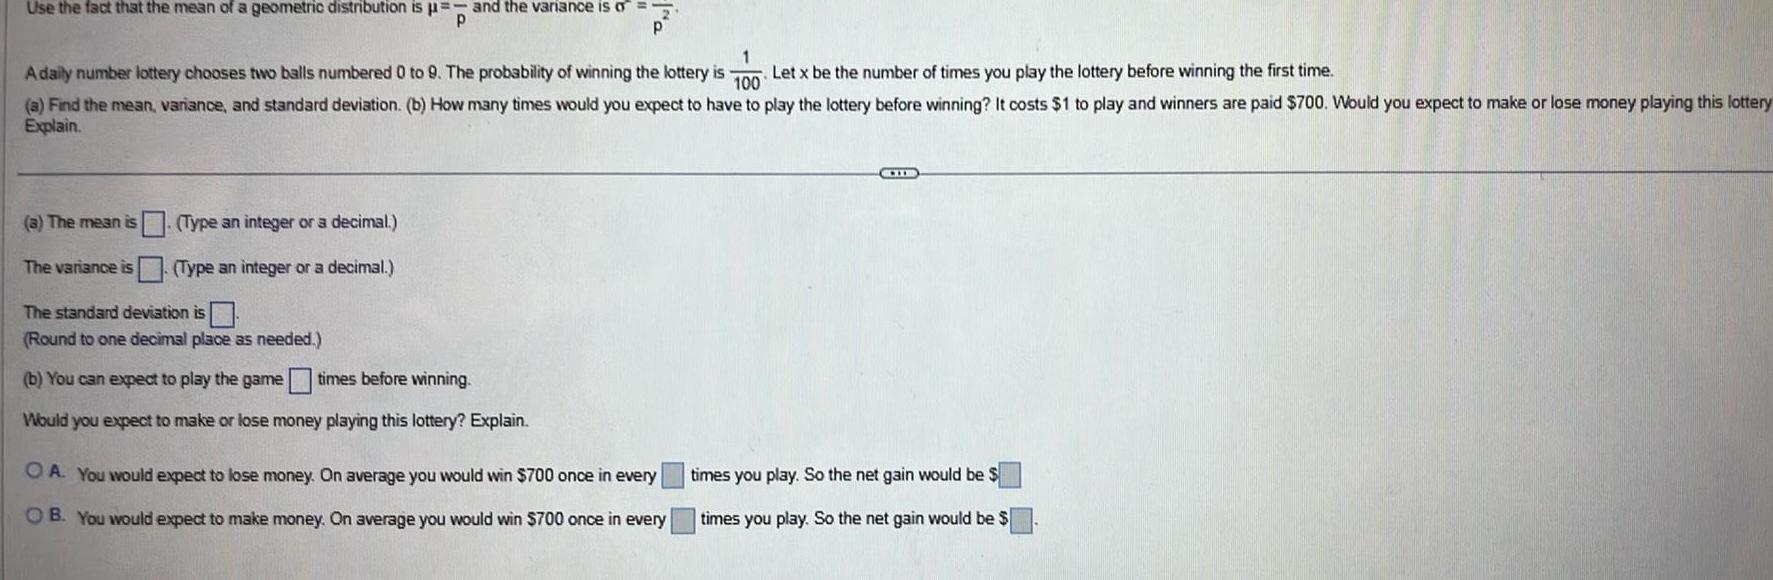
ProbabilityUse the fact that the mean of a geometric distribution is and the variance is o P P 1 A daily number lottery chooses two balls numbered 0 to 9 The probability of winning the lottery is Let x be the number of times you play the lottery before winning the first time 100 a Find the mean variance and standard deviation b How many times would you expect to have to play the lottery before winning It costs 1 to play and winners are paid 700 Would you expect to make or lose money playing this lottery Explain a The mean is Type an integer or a decimal The variance is Type an integer or a decimal The standard deviation is Round to one decimal place as needed b You can expect to play the game times before winning Would you expect to make or lose money playing this lottery Explain OA You would expect to lose money On average you would win 700 once in every OB You would expect to make money On average you would win 700 once in every CHI times you play So the net gain would be times you play So the net gain would be
Statistics
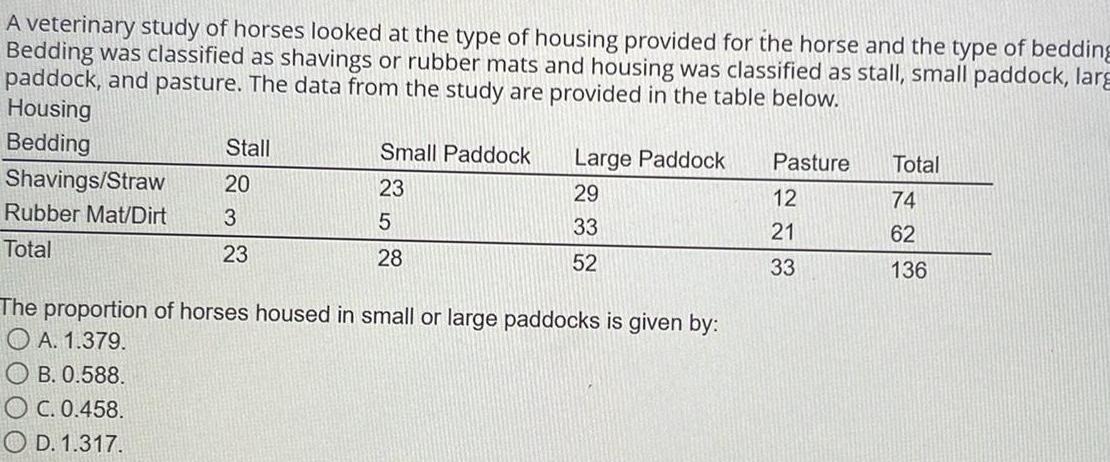
ProbabilityA veterinary study of horses looked at the type of housing provided for the horse and the type of bedding Bedding was classified as shavings or rubber mats and housing was classified as stall small paddock larg paddock and pasture The data from the study are provided in the table below Housing Bedding Shavings Straw Rubber Mat Dirt Total Stall 20 3 23 B 0 588 OC 0 458 OD 1 317 Small Paddock 23 5 28 Large Paddock 29 33 52 The proportion of horses housed in small or large paddocks is given by A 1 379 Pasture 12 21 33 Total 74 62 136
Statistics
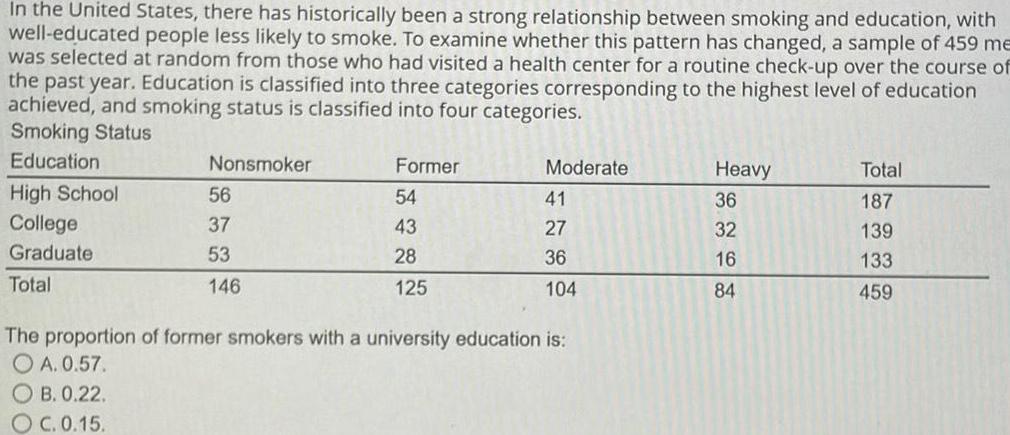
ProbabilityIn the United States there has historically been a strong relationship between smoking and education with well educated people less likely to smoke To examine whether this pattern has changed a sample of 459 me was selected at random from those who had visited a health center for a routine check up over the course of the past year Education is classified into three categories corresponding to the highest level of education achieved and smoking status is classified into four categories Smoking Status Education High School College Graduate Total Nonsmoker OB 0 22 OC 0 15 56 37 53 146 Former 54 43 28 125 Moderate 41 27 36 104 The proportion of former smokers with a university education is OA 0 57 Heavy 36 32 16 84 Total 187 139 133 459
Statistics
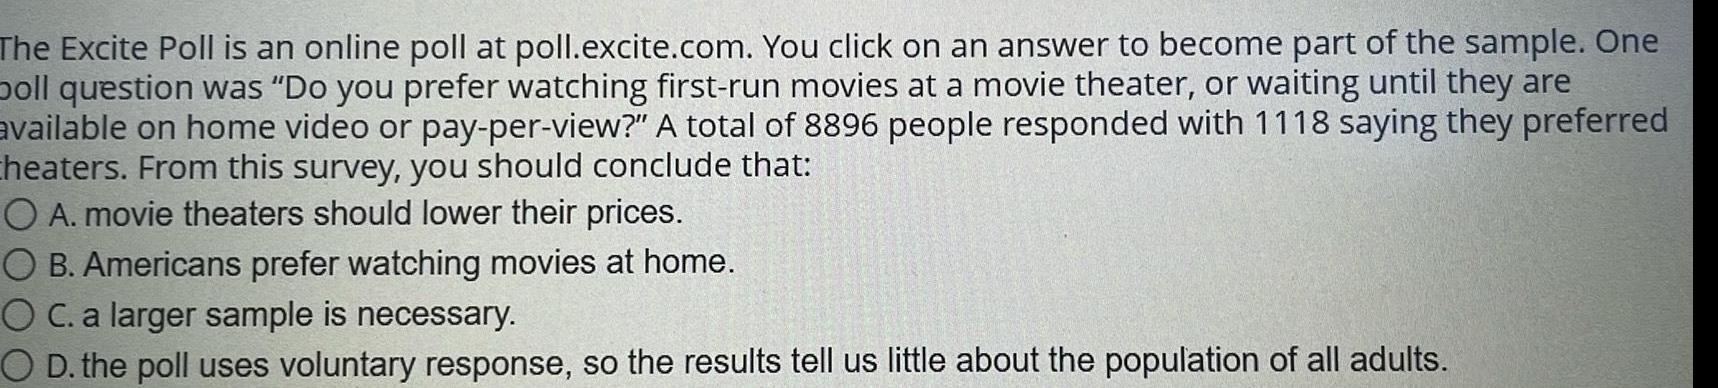
ProbabilityThe Excite Poll is an online poll at poll excite com You click on an answer to become part of the sample One poll question was Do you prefer watching first run movies at a movie theater or waiting until they are available on home video or pay per view A total of 8896 people responded with 1118 saying they preferred Cheaters From this survey you should conclude that O A movie theaters should lower their prices O B Americans prefer watching movies at home O C a larger sample is necessary O D the poll uses voluntary response so the results tell us little about the population of all adults
Statistics
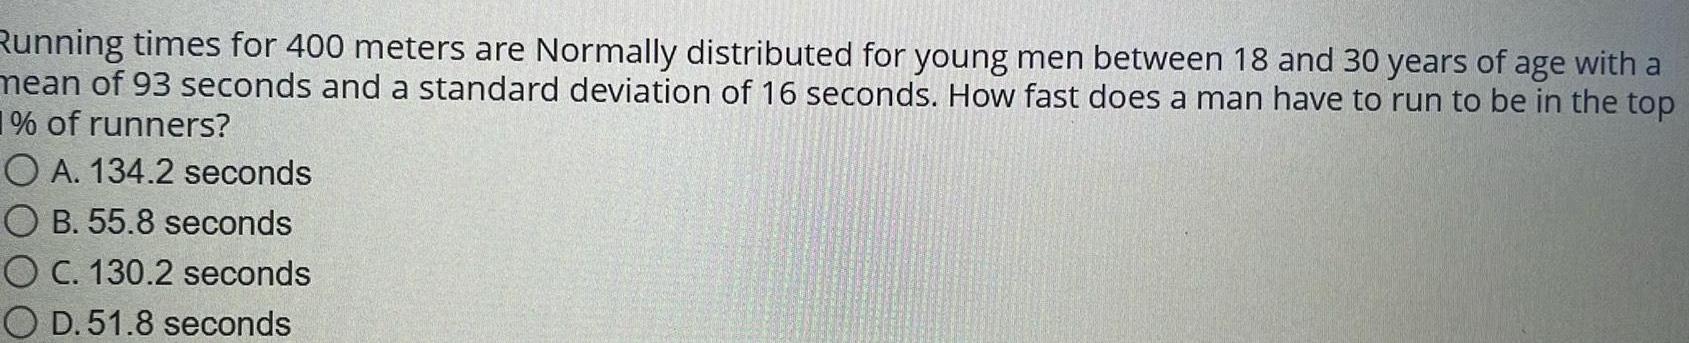
ProbabilityRunning times for 400 meters are Normally distributed for young men between 18 and 30 years of age with a mean of 93 seconds and a standard deviation of 16 seconds How fast does a man have to run to be in the top 1 of runners OA 134 2 seconds OB 55 8 seconds O C 130 2 seconds O D 51 8 seconds
Statistics
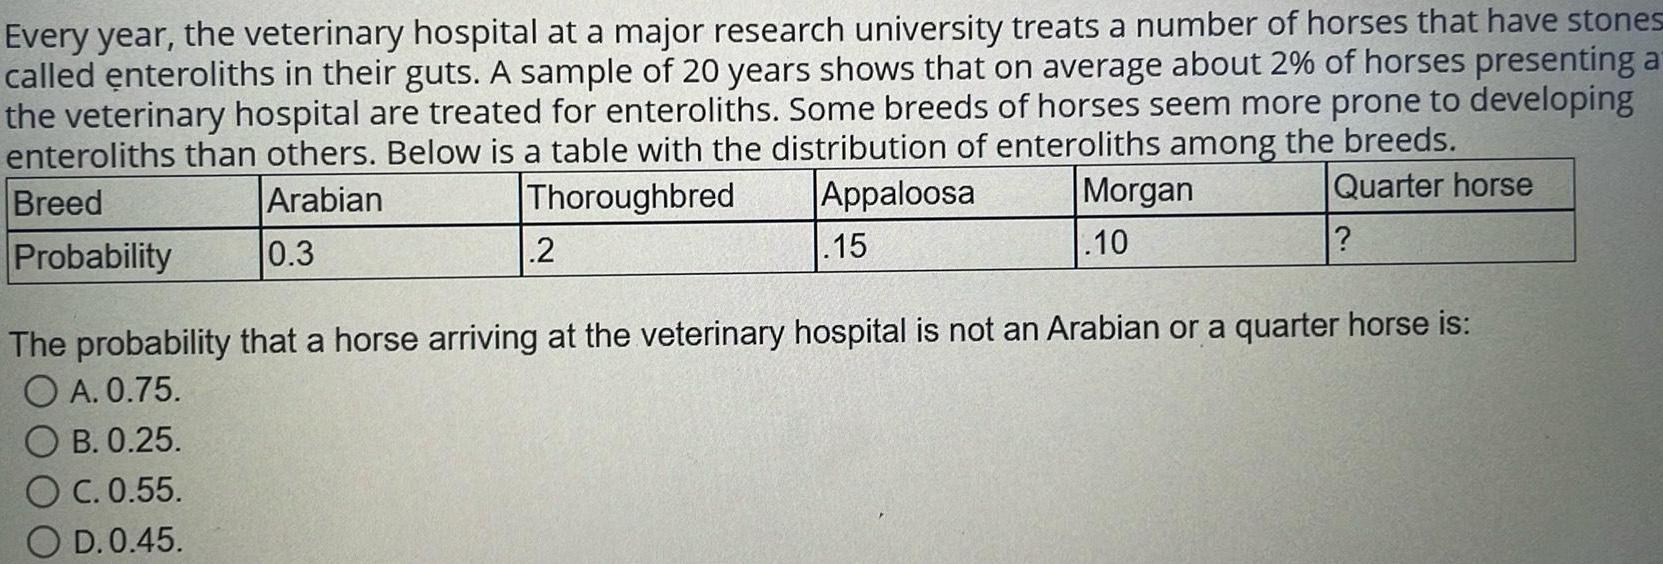
ProbabilityEvery year the veterinary hospital at a major research university treats a number of horses that have stones called enteroliths in their guts A sample of 20 years shows that on average about 2 of horses presenting a the veterinary hospital are treated for enteroliths Some breeds of horses seem more prone to developing enteroliths than others Below is a table with the distribution of enteroliths among the breeds Breed Arabian Thoroughbred Appaloosa 15 Quarter horse Probability 0 3 2 Morgan 10 The probability that a horse arriving at the veterinary hospital is not an Arabian or a quarter horse is O A 0 75 B 0 25 C 0 55 D 0 45
Statistics
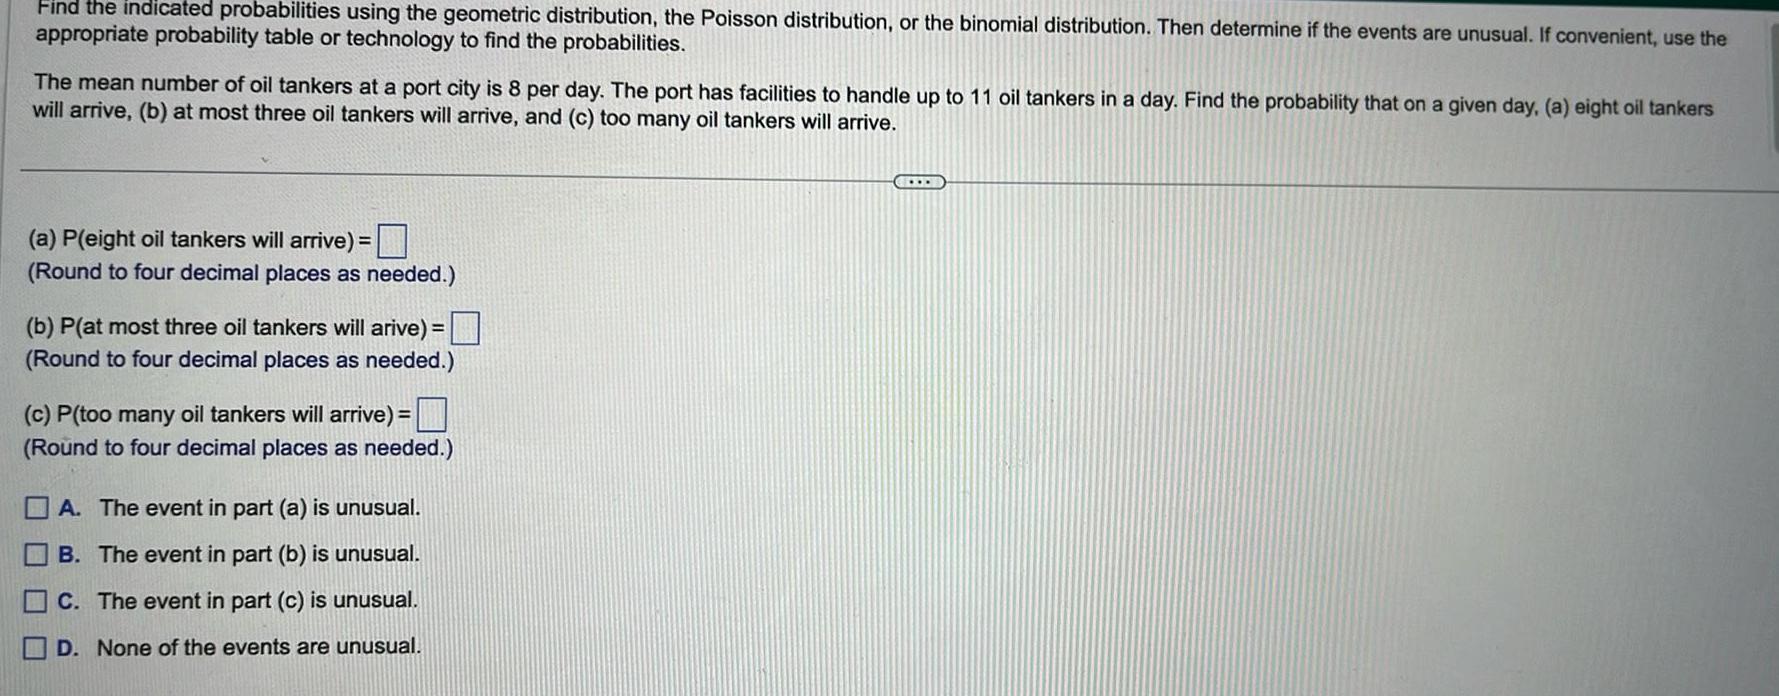
ProbabilityFind the indicated probabilities using the geometric distribution the Poisson distribution or the binomial distribution Then determine if the events are unusual If convenient use the appropriate probability table or technology to find the probabilities The mean number of oil tankers at a port city is 8 per day The port has facilities to handle up to 11 oil tankers in a day Find the probability that on a given day a eight oil tankers will arrive b at most three oil tankers will arrive and c too many oil tankers will arrive a P eight oil tankers will arrive Round to four decimal places as needed b P at most three oil tankers will arive Round to four decimal places as needed c P too many oil tankers will arrive Round to four decimal places as needed A The event in part a is unusual B The event in part b is unusual C The event in part c is unusual D None of the events are unusual
Statistics
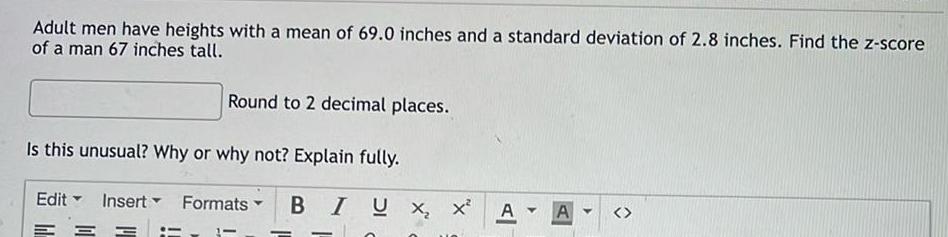
ProbabilityAdult men have heights with a mean of 69 0 inches and a standard deviation of 2 8 inches Find the z score of a man 67 inches tall Round to 2 decimal places Is this unusual Why or why not Explain fully Insert Formats Edit BIUX X A Y A
Statistics
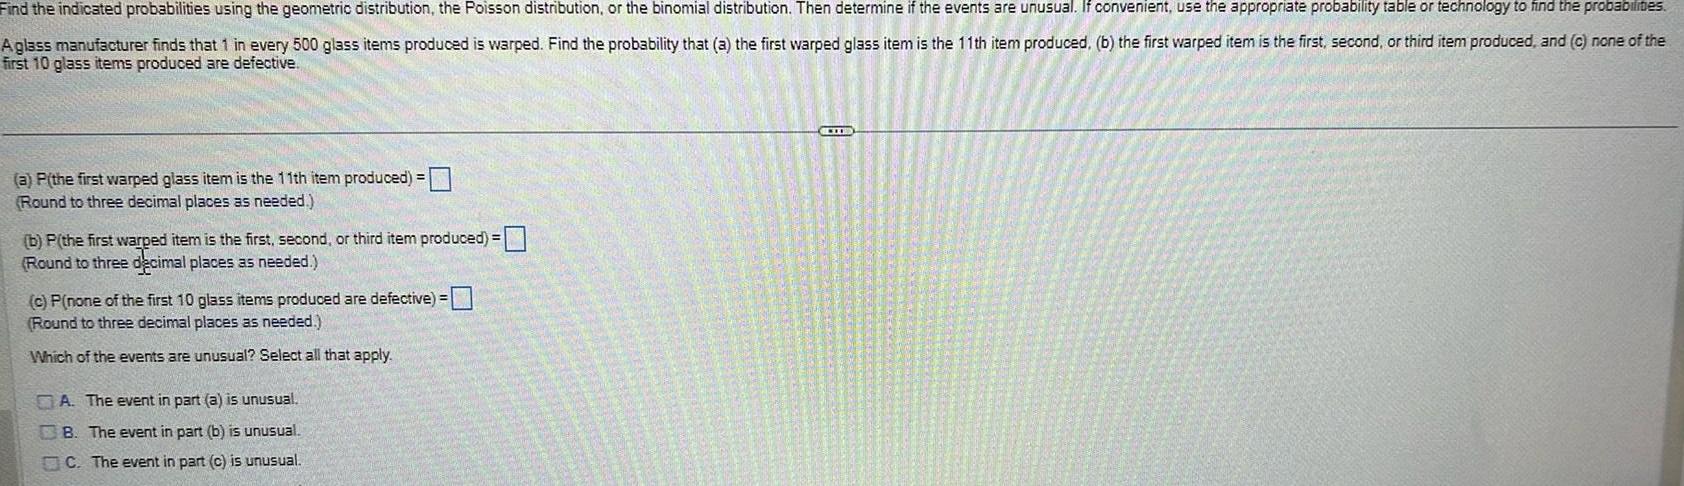
ProbabilityFind the indicated probabilities using the geometric distribution the Poisson distribution or the binomial distribution Then determine if the events are unusual If convenient use the appropriate probability table or technology to find the probabilites Aglass manufacturer finds that 1 in every 500 glass items produced is warped Find the probability that a the first warped glass item is the 11th item produced b the first warped item is the first second or third item produced and c none of the first 10 glass items produced are defective a P the first warped glass item is the 11th item produced Round to three decimal places as needed b P the first warped item is the first second or third item produced Round to three decimal places as needed c P none of the first 10 glass items produced are defective Round to three decimal places as needed Which of the events are unusual Select all that apply A The event in part a is unusual B The event in part b is unusual C The event in part c is unusual LID
Statistics
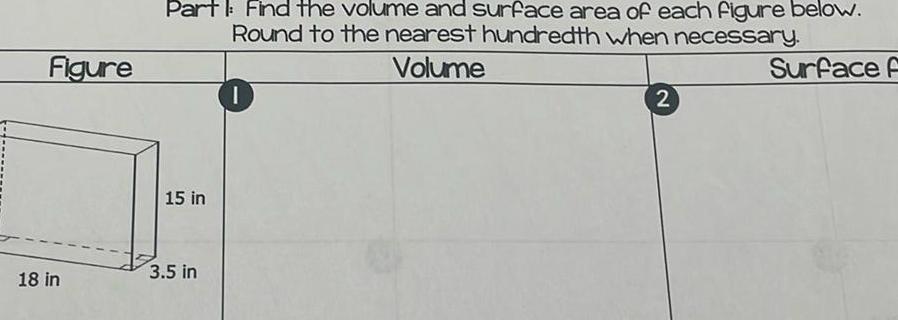
ProbabilityFigure 18 in Part Find the volume and surface area of each figure below Round to the nearest hundredth when necessary Volume Surface F 15 in 3 5 in 2
Statistics
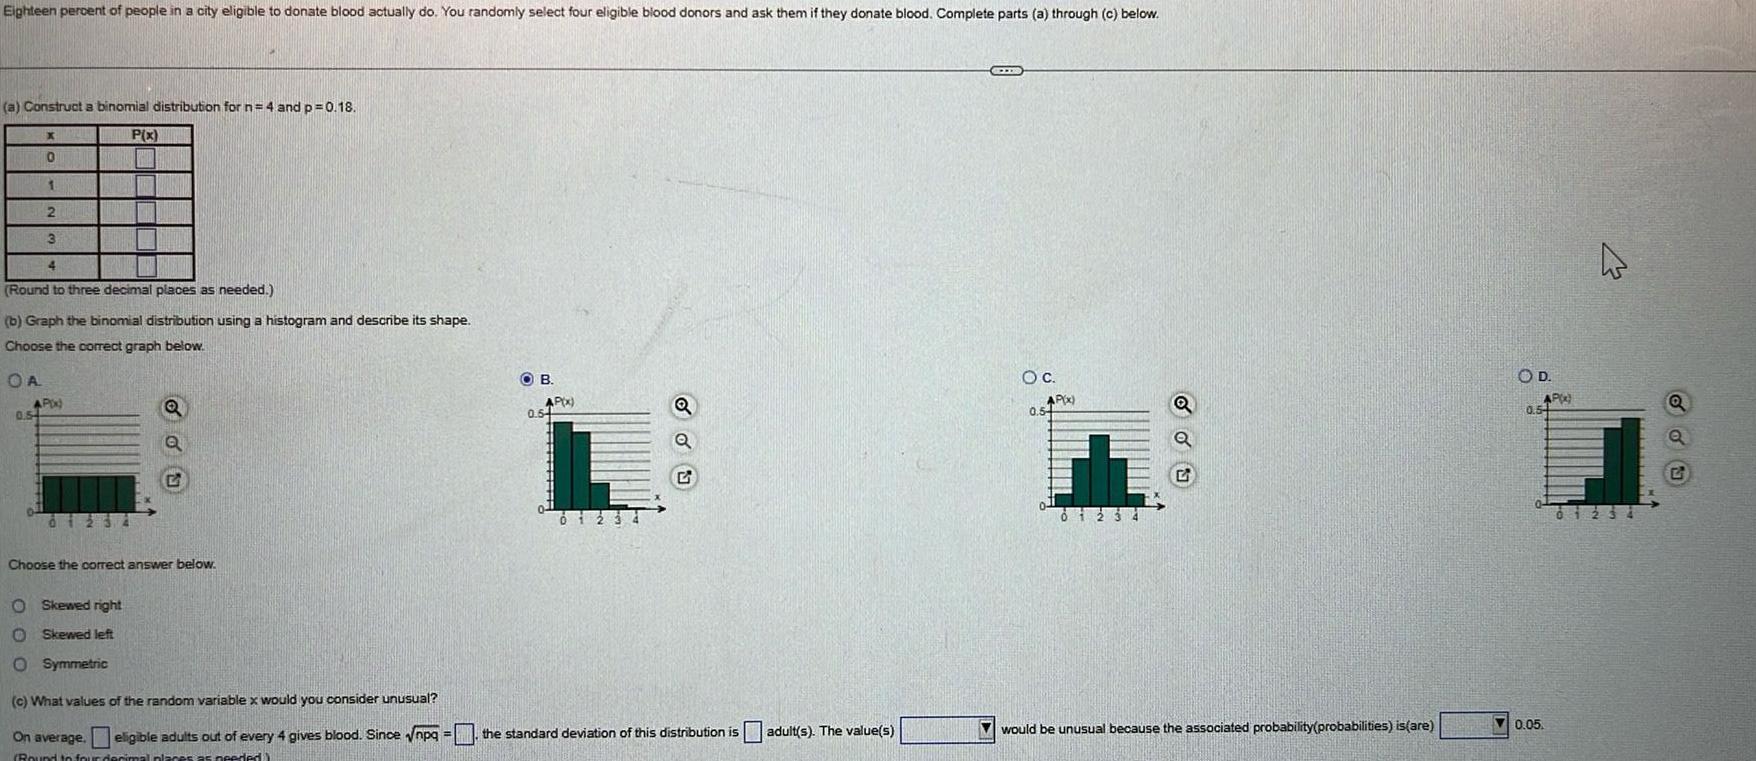
ProbabilityEighteen percent of people in a city eligible to donate blood actually do You randomly select four eligible blood donors and ask them if they donate blood Complete parts a through c below a Construct a binomial distribution for n 4 and p 0 18 P x X 0 1 2 3 4 Round to three decimal places as needed b Graph the binomial distribution using a histogram and describe its shape Choose the correct graph below OA AP x 0 54 i Q O Skewed right Skewed left O Symmetric 2 Choose the correct answer below OB AP x 0 54 du c What values of the random variable x would you consider unusual On average eligible adults out of every 4 gives blood Since npq the standard deviation of this distribution is adult s The value s Round to four decimal pla es as needed CITE O C AP x 0 54 Th 0123 Q would be unusual because the associated probability probabilities is are OD AP 0 5 0 05 4 01234 Q ddu
Statistics
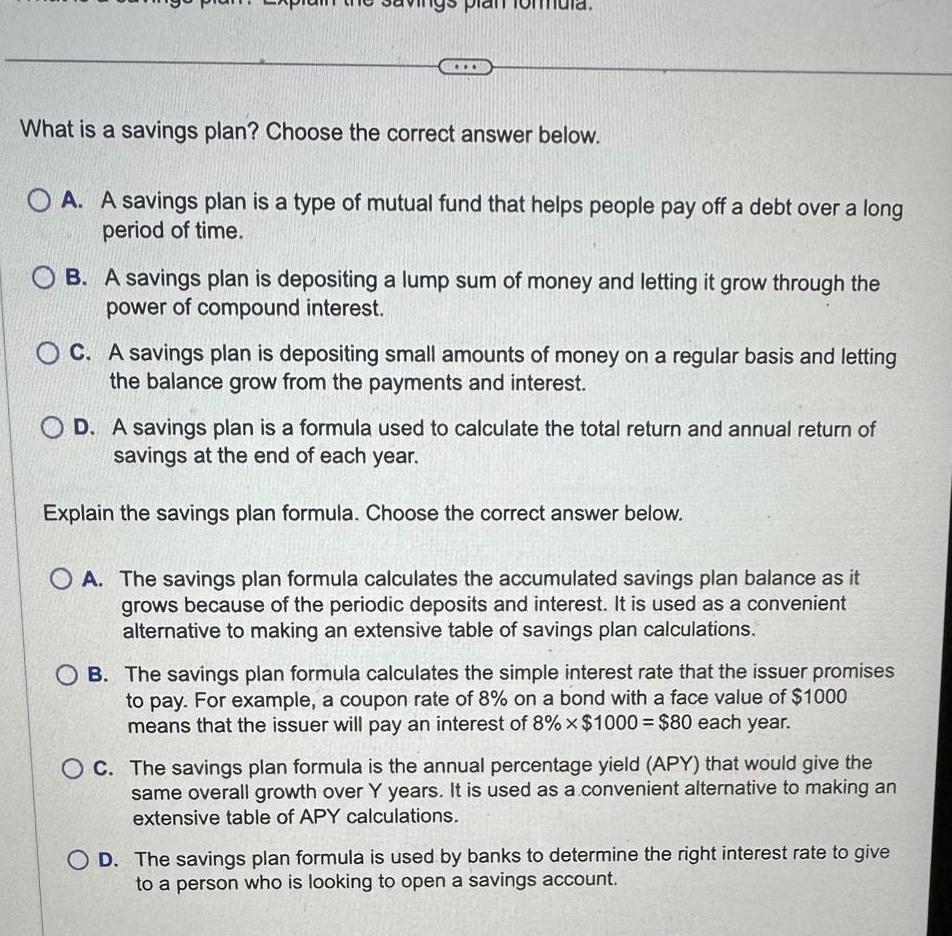
ProbabilityWhat is a savings plan Choose the correct answer below A A savings plan is a type of mutual fund that helps people pay off a debt over a long period of time B A savings plan is depositing a lump sum of money and letting it grow through the power of compound interest C A savings plan is depositing small amounts of money on a regular basis and letting the balance grow from the payments and interest OD A savings plan is a formula used to calculate the total return and annual return of savings at the end of each year Explain the savings plan formula Choose the correct answer below O A The savings plan formula calculates the accumulated savings plan balance as it grows because of the periodic deposits and interest It is used as a convenient alternative to making an extensive table of savings plan calculations OB The savings plan formula calculates the simple interest rate that the issuer promises to pay For example a coupon rate of 8 on a bond with a face value of 1000 means that the issuer will pay an interest of 8 x 1000 80 each year OC The savings plan formula is the annual percentage yield APY that would give the same overall growth over Y years It is used as a convenient alternative to making an extensive table of APY calculations OD The savings plan formula is used by banks to determine the right interest rate to give to a person who is looking to open a savings account
Statistics
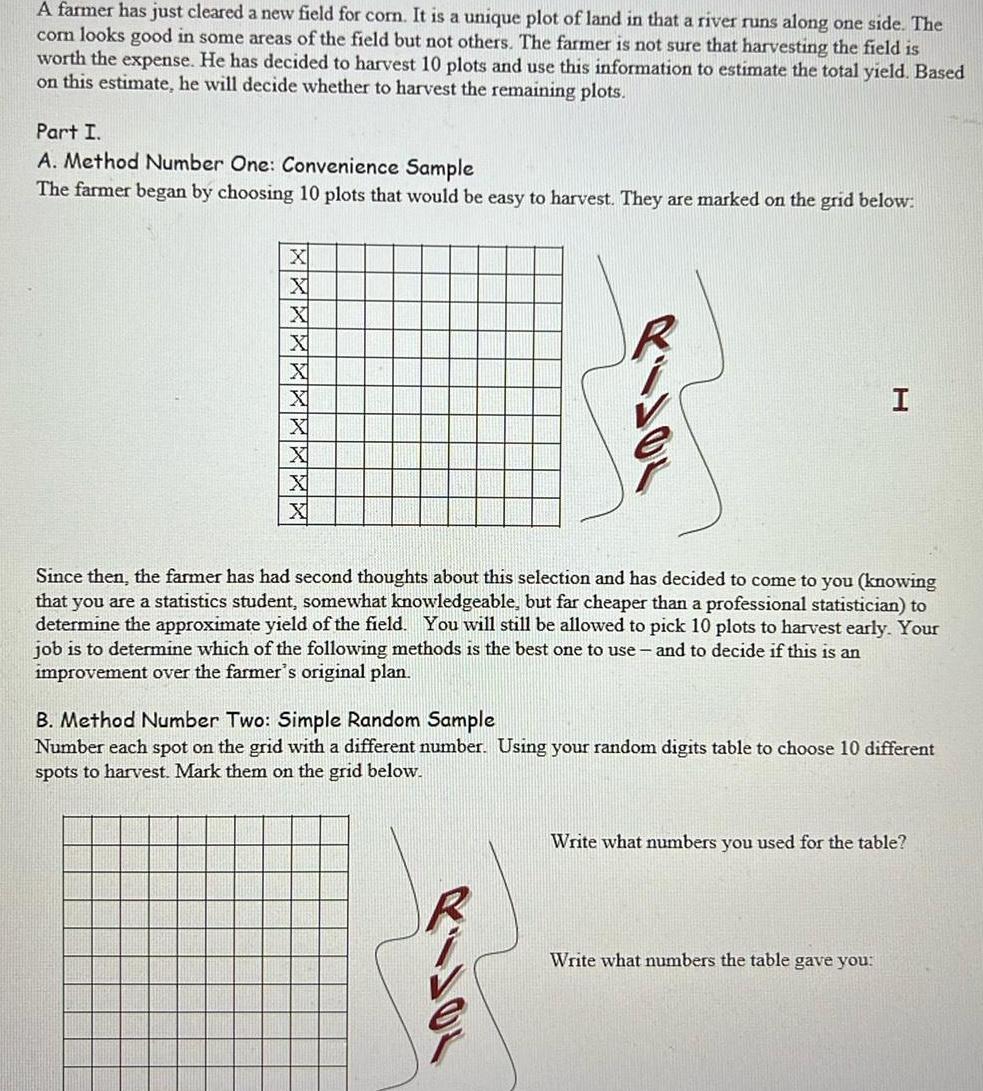
ProbabilityA farmer has just cleared a new field for corn It is a unique plot of land in that a river runs along one side The com looks good in some areas of the field but not others The farmer is not sure that harvesting the field is worth the expense He has decided to harvest 10 plots and use this information to estimate the total yield Based on this estimate he will decide whether to harvest the remaining plots Part I A Method Number One Convenience Sample The farmer began by choosing 10 plots that would be easy to harvest They are marked on the grid below X X X X X X X I Since then the farmer has had second thoughts about this selection and has decided to come to you knowing that you are a statistics student somewhat knowledgeable but far cheaper than a professional statistician to determine the approximate yield of the field You will still be allowed to pick 10 plots to harvest early Your job is to determine which of the following methods is the best one to use and to decide if this is an improvement over the farmer s original plan B Method Number Two Simple Random Sample Number each spot on the grid with a different number Using your random digits table to choose 10 different spots to harvest Mark them on the grid below Write what numbers you used for the table Write what numbers the table gave you
Statistics
ProbabilityWhich of the following hypotheses has the appropriate form for a null hypothesis Choose the correct answer below Op 0 30 O p 0 30 Op 0 30 O p 0 30
Statistics
ProbabilityA medical researcher measures the increase in heart rate of patients who are taking a stress test What kind of variable is the researcher studying Choose the correct answer below O O O O 8 point s possit Ordinal variable Categorical variable Quantitative variable Identifier variable
Statistics
ProbabilityGPAS at CCSU are normally distributed with a mean of 2 42 and a standard deviation of 0 53 Find the z score for a GPA of 3 39 0 5660 1 811 0 8679 0 5849 0 5283
Statistics
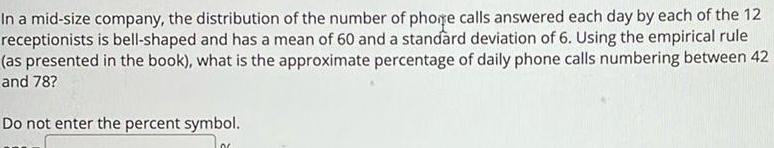
ProbabilityIn a mid size company the distribution of the number of phone calls answered each day by each of the 12 receptionists is bell shaped and has a mean of 60 and a standard deviation of 6 Using the empirical rule as presented in the book what is the approximate percentage of daily phone calls numbering between 42 and 78 Do not enter the percent symbol
Statistics
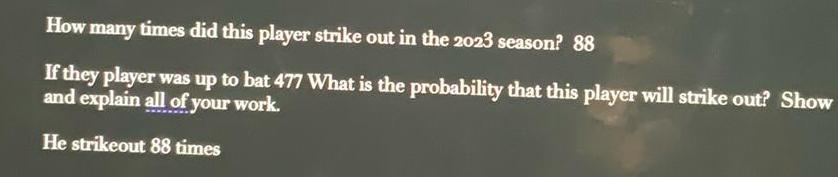
ProbabilityHow many times did this player strike out in the 2023 season 88 If they player was up to bat 477 What is the probability that this player will strike out Show and explain all of your work He strikeout 88 times
Statistics
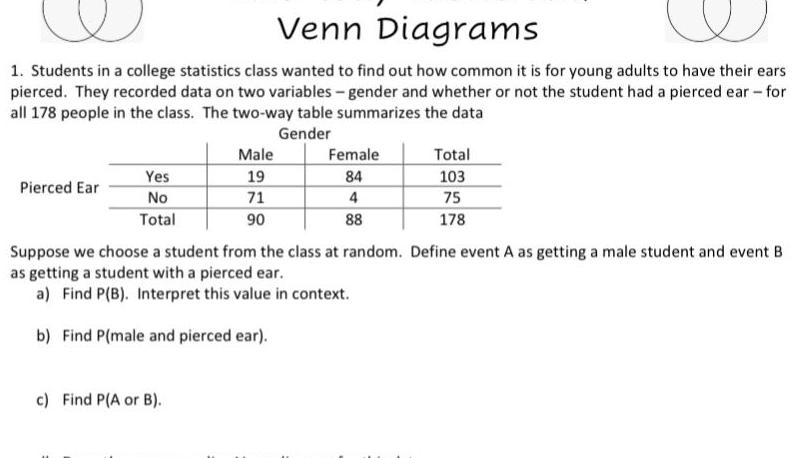
ProbabilityVenn Diagrams 1 Students in a college statistics class wanted to find out how common it is for young adults to have their ears pierced They recorded data on two variables gender and whether or not the student had a pierced ear for all 178 people in the class The two way table summarizes the data Gender Pierced Ear Yes No Total Male 19 71 90 c Find P A or B Female 84 4 88 Total 103 75 178 Suppose we choose a student from the class at random Define event A as getting a male student and event B as getting a student with a pierced ear a Find P B Interpret this value in context b Find P male and pierced ear
Statistics
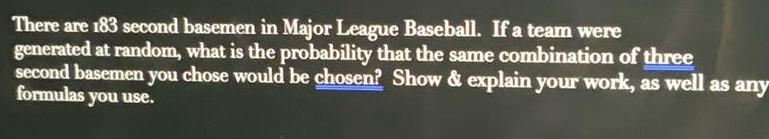
ProbabilityThere are 183 second basemen in Major League Baseball If a team were generated at random what is the probability that the same combination of three second basemen you chose would be chosen Show explain your work as well as any formulas you use
Statistics
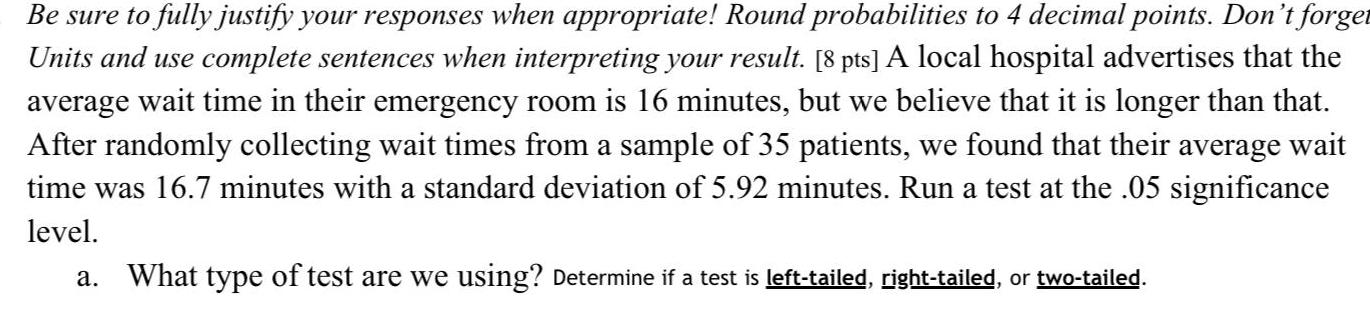
ProbabilityBe sure to fully justify your responses when appropriate Round probabilities to 4 decimal points Don t forget Units and use complete sentences when interpreting your result 8 pts A local hospital advertises that the average wait time in their emergency room is 16 minutes but we believe that it is longer than that After randomly collecting wait times from a sample of 35 patients we found that their average wait time was 16 7 minutes with a standard deviation of 5 92 minutes Run a test at the 05 significance level a What type of test are we using Determine if a test is left tailed right tailed or two tailed
Statistics
ProbabilityCalculate the 95 confidence interval for mean total intake of sodium over the 14 days Round final answers to nearest whole number Hint Section 20 3 Include any formulas including numerical inputs or calculator command used including inputs This work is worth partial credit If you give just the final answer and it is wrong then you don t get any credit for the problem Give confidence interval as
Statistics
ProbabilityCalculate the sample proportion of weekdays that this person was below the recommended daily 2000 calorie intake Show how you calculated the proportion Round the proportion to two decimal places Edit View Insert Format Tools Table
Statistics
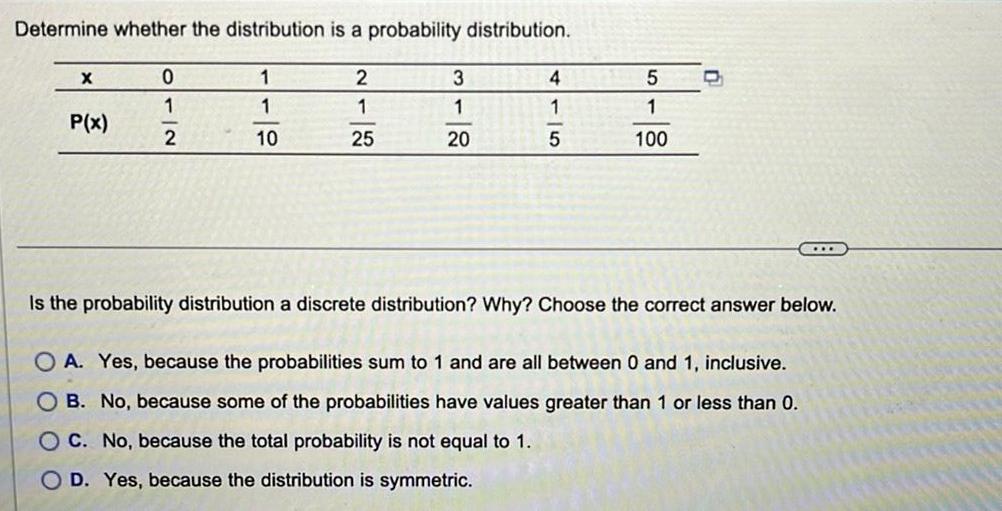
ProbabilityDetermine whether the distribution is a probability distribution X P x 0 1 2 1 1 10 2 1 25 3 1 20 4 1 5 5 1 100 Is the probability distribution a discrete distribution Why Choose the correct answer below OA Yes because the probabilities sum to 1 and are all between 0 and 1 inclusive OB No because some of the probabilities have values greater than 1 or less than 0 OC No because the total probability is not equal to 1 OD Yes because the distribution is symmetric
Statistics
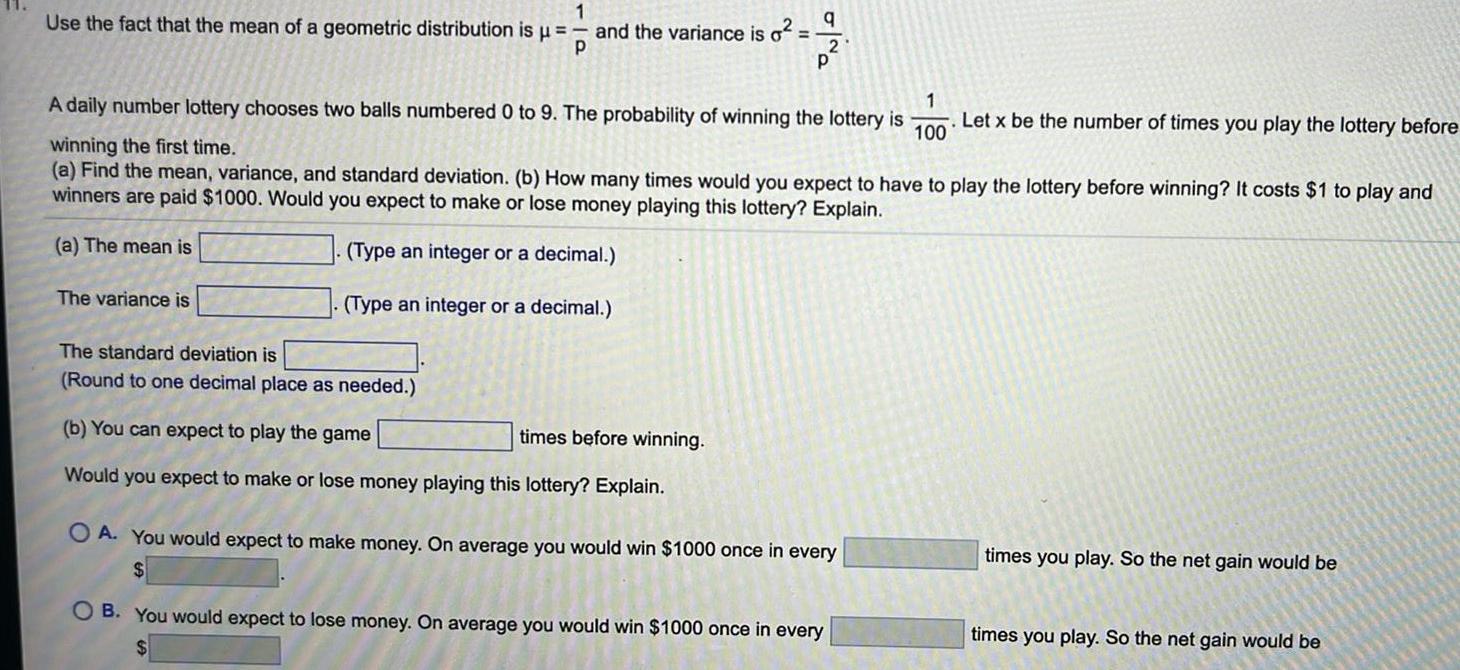
ProbabilityUse the fact that the mean of a geometric distribution is 1 P and the variance is o The variance is The standard deviation is Round to one decimal place as needed q 1 100 A daily number lottery chooses two balls numbered 0 to 9 The probability of winning the lottery is winning the first time a Find the mean variance and standard deviation b How many times would you expect to have to play the lottery before winning It costs 1 to play and winners are paid 1000 Would you expect to make or lose money playing this lottery Explain a The mean is Type an integer or a decimal Type an integer or a decimal b You can expect to play the game times before winning Would you expect to make or lose money playing this lottery Explain 2 P OA You would expect to make money On average you would win 1000 once in every OB You would expect to lose money On average you would win 1000 once in every Let x be the number of times you play the lottery before times you play So the net gain would be times you play So the net gain would be
Statistics
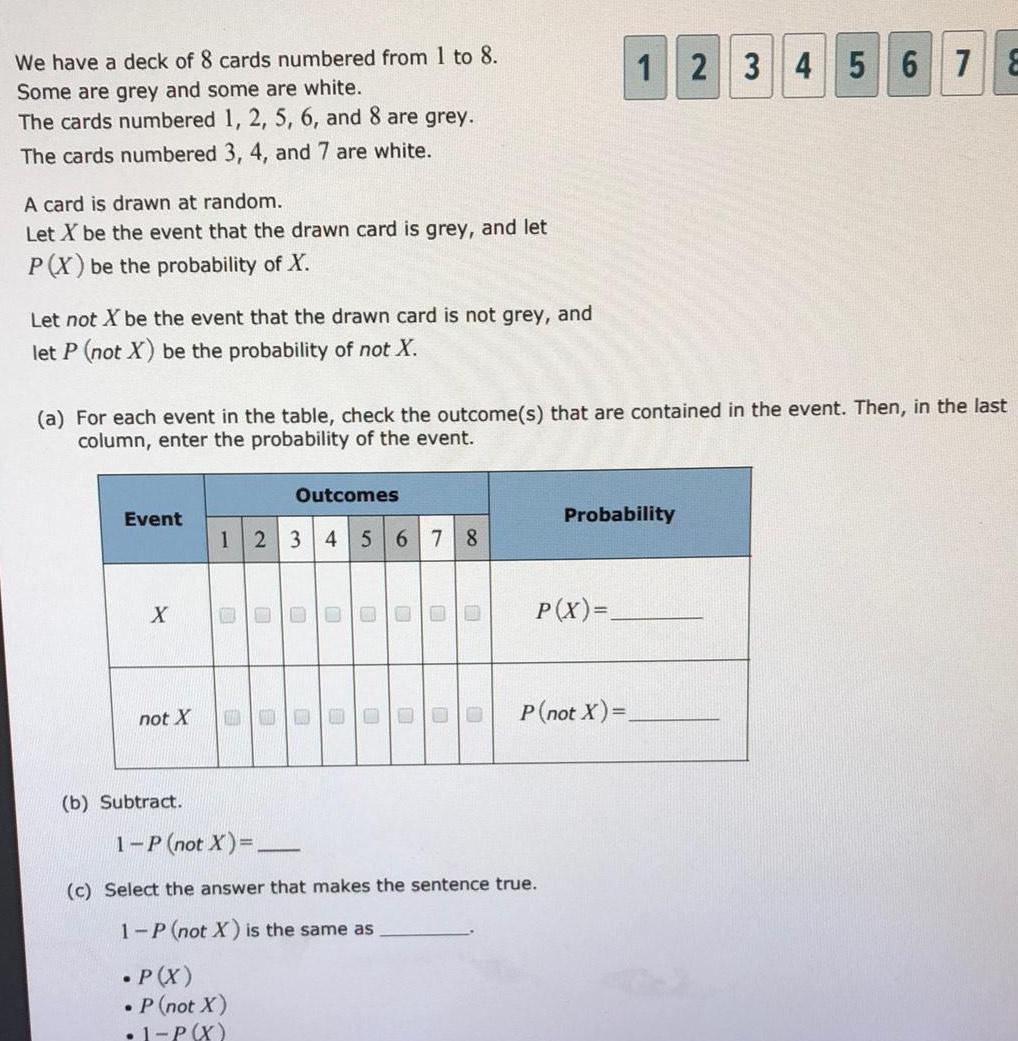
ProbabilityWe have a deck of 8 cards numbered from 1 to 8 Some are grey and some are white The cards numbered 1 2 5 6 and 8 are grey The cards numbered 3 4 and 7 are white A card is drawn at random Let X be the event that the drawn card is grey and let P X be the probability of X Let not X be the event that the drawn card is not grey and let P not X be the probability of not X a For each event in the table check the outcome s that are contained in the event Then in the last column enter the probability of the event Event X not X b Subtract Outcomes 1 2 3 4 5 6 7 8 B P X 1 P not X 0 P not X 1 P X E 0 0 O 0 U U 0 00 c Select the answer that makes the sentence true 1 P not X is the same as P X 12 3 4 5 6 7 8 Probability P not X
Statistics
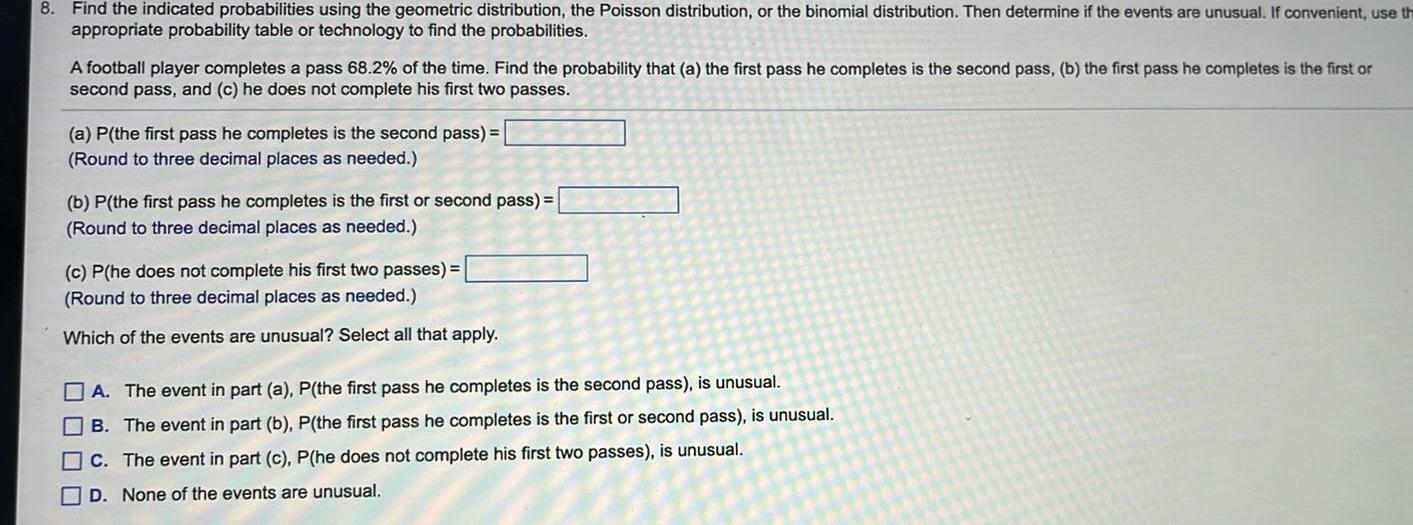
Probability8 Find the indicated probabilities using the geometric distribution the Poisson distribution or the binomial distribution Then determine if the events are unusual If convenient use th appropriate probability table or technology to find the probabilities A football player completes a pass 68 2 of the time Find the probability that a the first pass he completes is the second pass b the first pass he completes is the first or second pass and c he does not complete his first two passes a P the first pass he completes is the second pass Round to three decimal places as needed b P the first pass he completes is the first or second pass Round to three decimal places as needed c P he does not complete his first two passes Round to three decimal places as needed Which of the events are unusual Select all that apply A The event in part a P the first pass he completes is the second pass is unusual B The event in part b P the first pass he completes is the first or second pass is unusual C The event in part c P he does not complete his first two passes is unusual D None of the events are unusual
Statistics
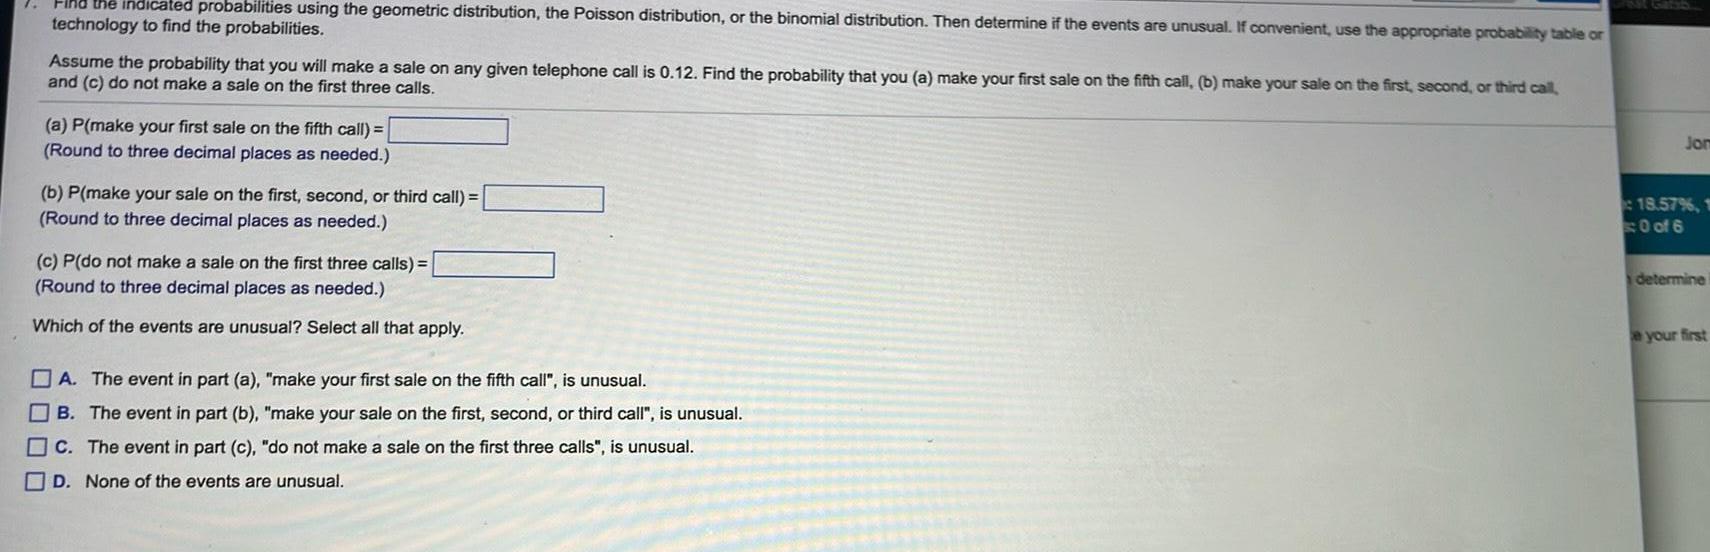
ProbabilityFind the indicated probabilities using the geometric distribution the Poisson distribution or the binomial distribution Then determine if the events are unusual If convenient use the appropriate probability table or technology to find the probabilities Assume the probability that you will make a sale on any given telephone call is 0 12 Find the probability that you a make your first sale on the fifth call b make your sale on the first second or third call and c do not make a sale on the first three calls a P make your first sale on the fifth call Round to three decimal places as needed b P make your sale on the first second or third call Round to three decimal places as needed c P do not make a sale on the first three calls Round to three decimal places as needed Which of the events are unusual Select all that apply A The event in part a make your first sale on the fifth call is unusual B The event in part b make your sale on the first second or third call is unusual c The event in part c do not make a sale on the first three calls is unusual D None of the events are unusual Jom 18 57 1 0 of 6 determine e your first
Statistics
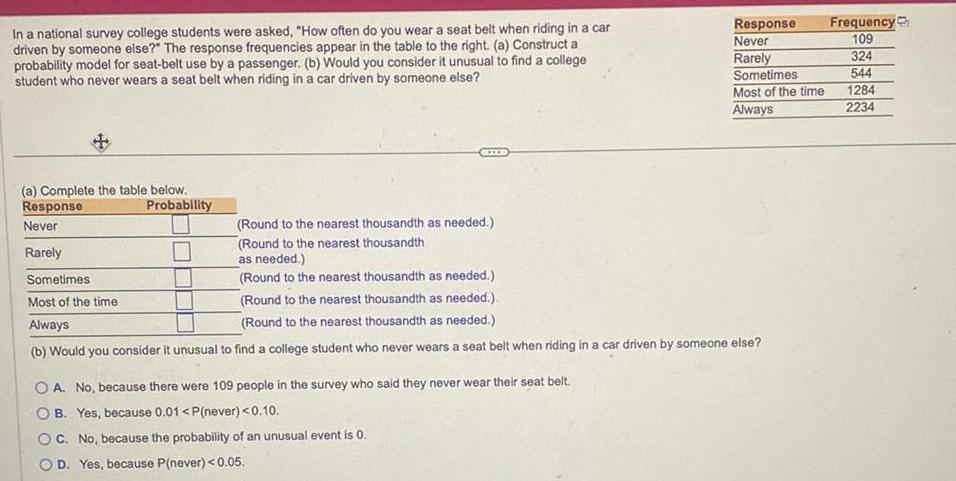
ProbabilityIn a national survey college students were asked How often do you wear a seat belt when riding in a car driven by someone else The response frequencies appear in the table to the right a Construct a probability model for seat belt use by a passenger b Would you consider it unusual to find a college student who never wears a seat belt when riding in a car driven by someone else a Complete the table below Response Never Rarely Probability Sometimes Most of the time Always Response Never Rarely Round to the nearest thousandth as needed Round to the nearest thousandth as needed Round to the nearest thousandth as needed Round to the nearest thousandth as needed Round to the nearest thousandth as needed b Would you consider it unusual to find a college student who never wears a seat belt when riding in a car driven by someone else OA No because there were 109 people in the survey who said they never wear their seat belt OB Yes because 0 01 P never 0 10 OC No because the probability of an unusual event is 0 OD Yes because P never 0 05 Sometimes Most of the time Always Frequency 109 324 544 1284 2234
Statistics
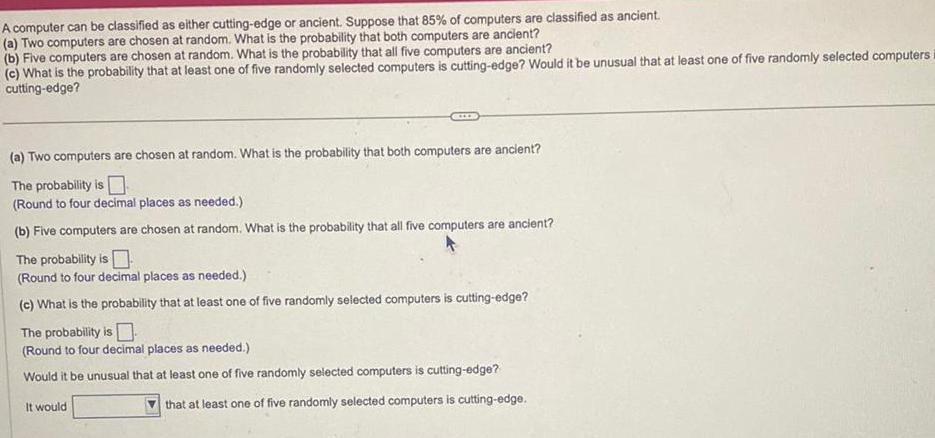
ProbabilityA computer can be classified as either cutting edge or ancient Suppose that 85 of computers are classified as ancient a Two computers are chosen at random What is the probability that both computers are ancient b Five computers are chosen at random What is the probability that all five computers are ancient c What is the probability that at least one of five randomly selected computers is cutting edge Would it be unusual that at least one of five randomly selected computers i cutting edge a Two computers are chosen at random What is the probability that both computers are ancient The probability is Round to four decimal places as needed b Five computers are chosen at random What is the probability that all five computers are ancient The probability is Round to four decimal places as needed c What is the probability that at least one of five randomly selected computers is cutting edge The probability is Round to four decimal places as needed Would it be unusual that at least one of five randomly selected computers is cutting edge It would that at least one of five randomly selected computers is cutting edge
Statistics
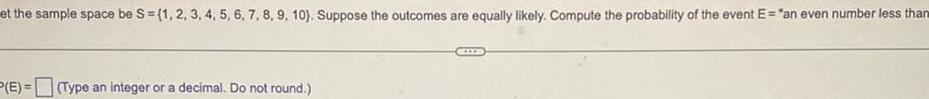
Probabilityet the sample space be S 1 2 3 4 5 6 7 8 9 10 Suppose the outcomes are equally likely Compute the probability of the event E an even number less than P E Type an integer or a decimal Do not round
Statistics
ProbabilityTrue or False In a probability model the sum of the probabilities of all outcomes must equal 1 Choose the correct answer below O False O True
Statistics
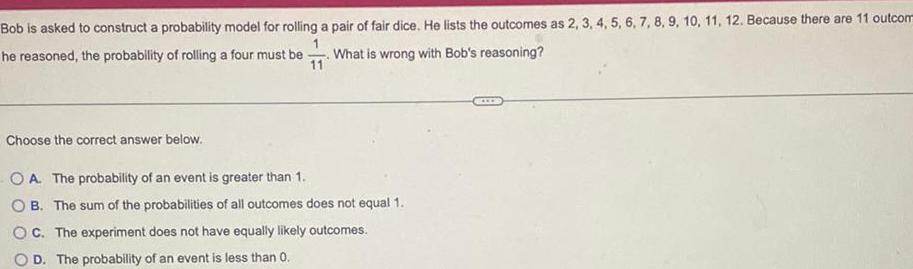
ProbabilityBob is asked to construct a probability model for rolling a pair of fair dice He lists the outcomes as 2 3 4 5 6 7 8 9 10 11 12 Because there are 11 outcom 1 he reasoned the probability of rolling a four must be What is wrong with Bob s reasoning 11 Choose the correct answer below OA The probability of an event is greater than 1 OB The sum of the probabilities of all outcomes does not equal 1 OC The experiment bes not have equally likely outcomes OD The probability of an event is less than 0
Statistics
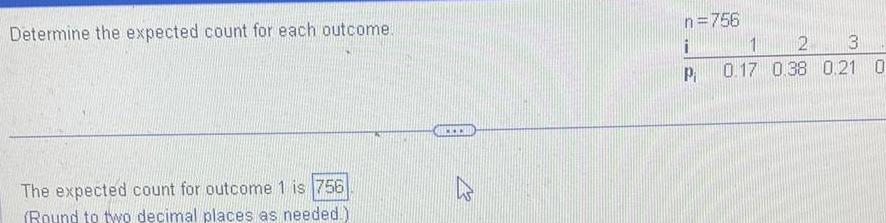
ProbabilityDetermine the expected count for each outcome The expected count for outcome 1 is 756 Round to two decimal places as needed www n 756 i P 2 3 1 0 17 0 38 0 21 0
Statistics
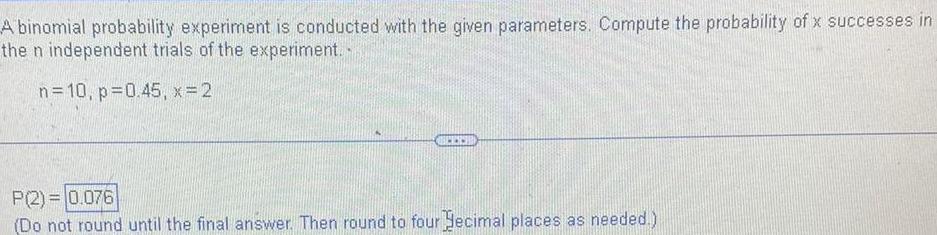
ProbabilityA binomial probability experiment is conducted with the given parameters Compute the probability of x successes in the n independent trials of the experiment n 10 p 0 45 x 2 P 2 0 076 Do not round until the final answer Then round to four ecimal places as needed
Statistics
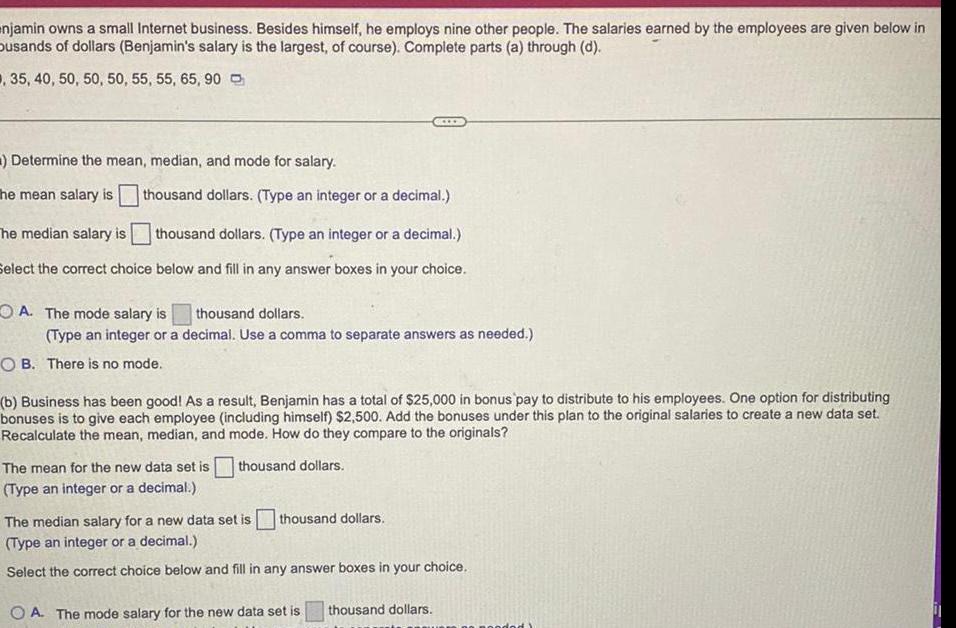
Probabilitynjamin owns a small Internet business Besides himself he employs nine other people The salaries earned by the employees are given below in busands of dollars Benjamin s salary is the largest of course Complete parts a through d 35 40 50 50 50 55 55 65 90 Determine the mean median and mode for salary The mean salary is thousand dollars Type an integer or a decimal The median salary is thousand dollars Type an integer or a decimal Select the correct choice below and fill in any answer boxes in your choice A The mode salary is thousand dollars Type an integer or a decimal Use a comma to separate answers as needed OB There is no mode b Business has been good As a result Benjamin has a total of 25 000 in bonus pay to distribute to his employees One option for distributing bonuses is to give each employee including himself 2 500 Add the bonuses under this plan to the original salaries to create a new data set Recalculate the mean median and mode How do they compare to the originals The mean for the new data set is thousand dollars Type an integer or a decimal thousand dollars The median salary for a new data set is Type an integer or a decimal Select the correct choice below and fill in any answer boxes in your choice OA The mode salary for the new data set is thousand dollars
Statistics
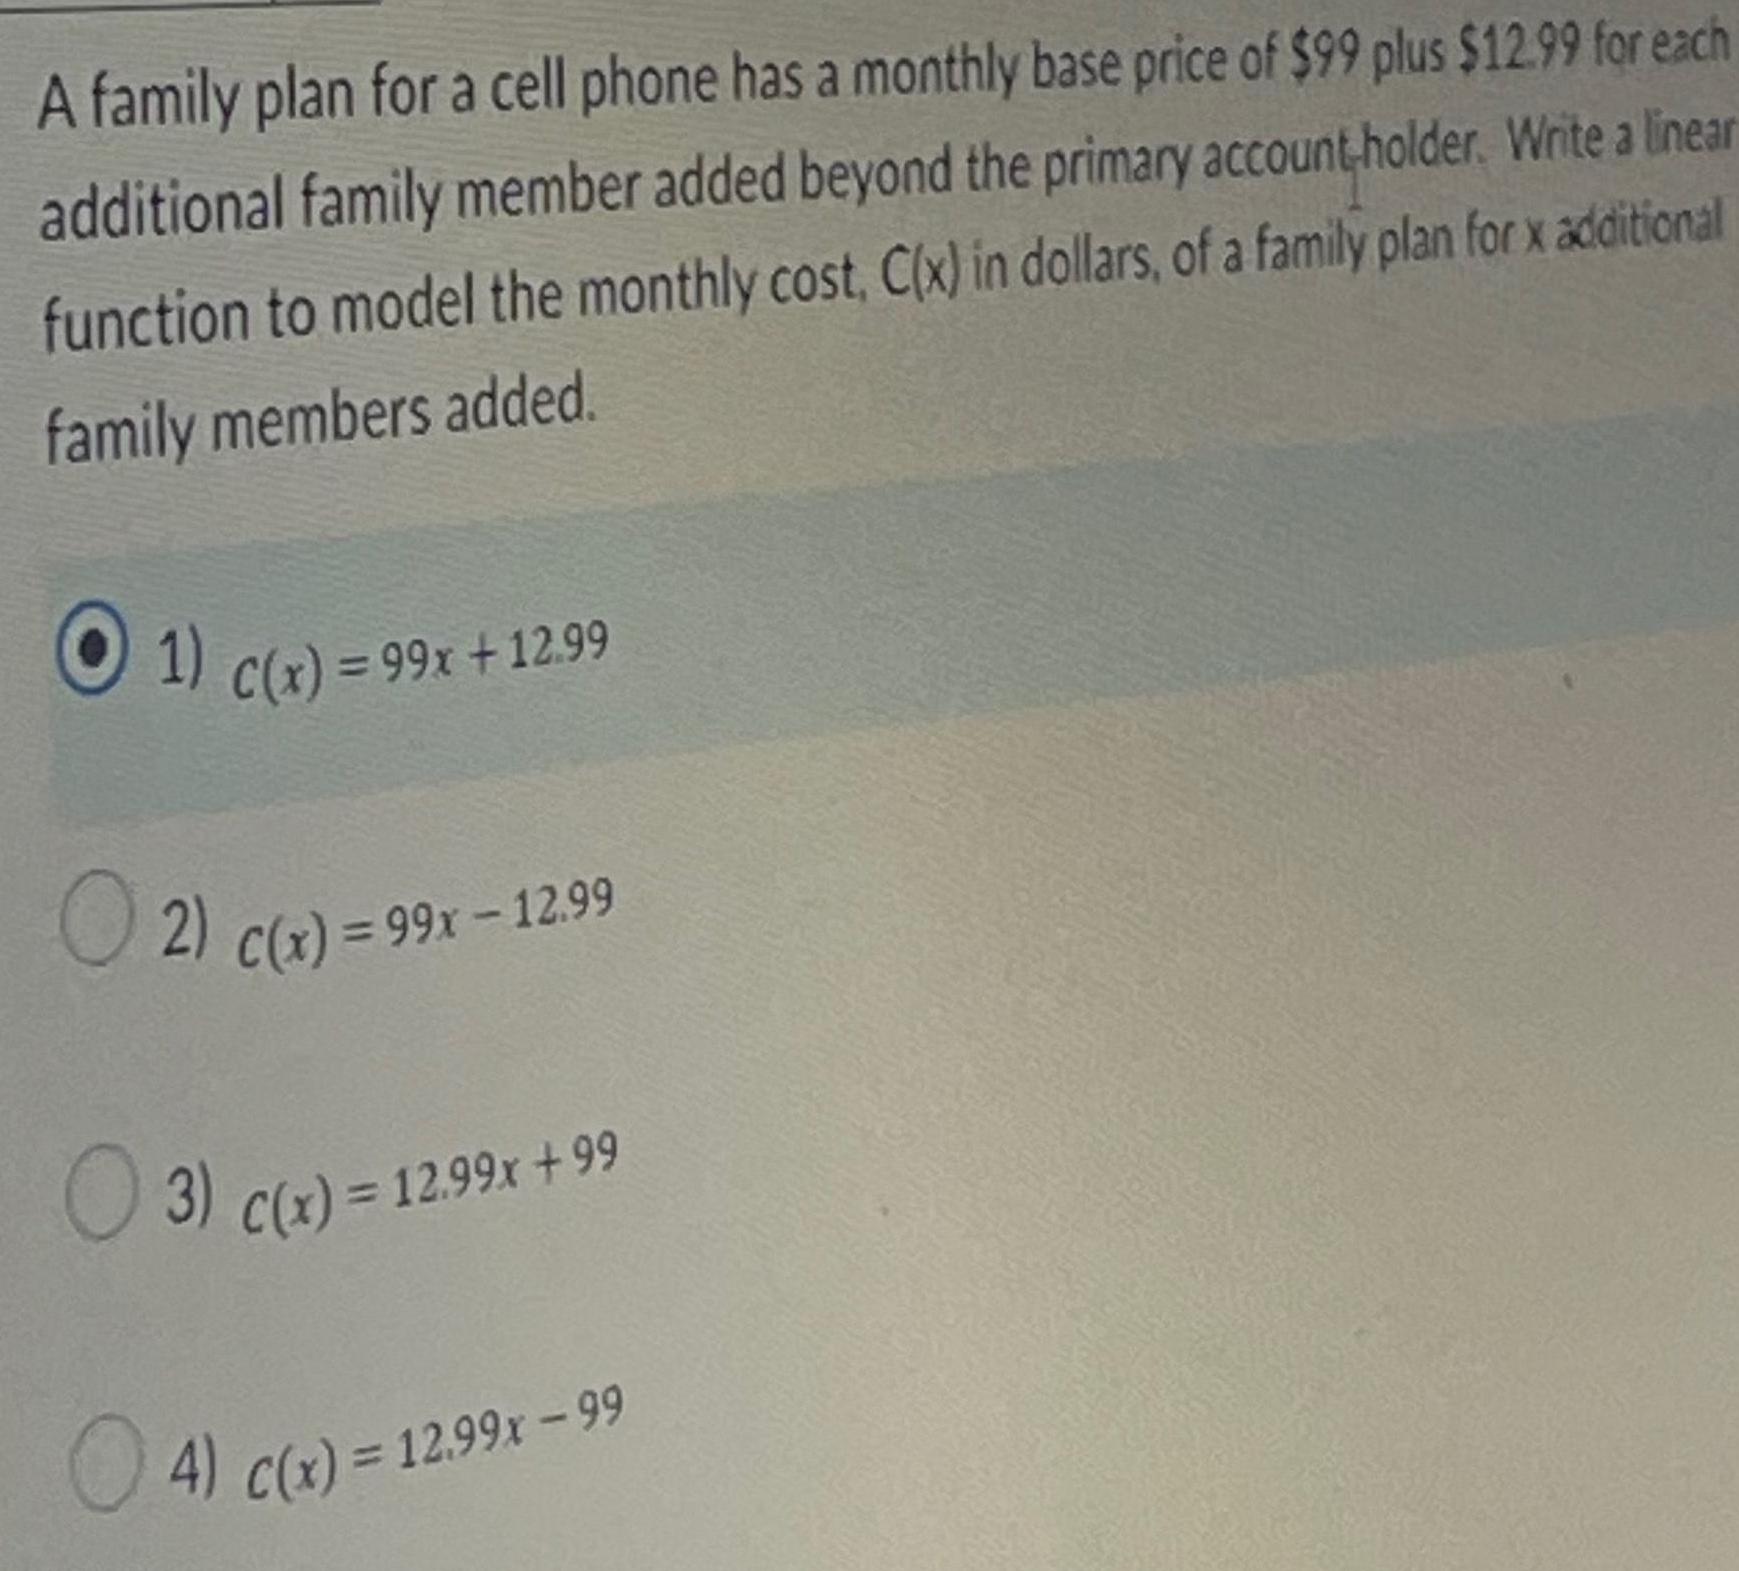
ProbabilityA family plan for a cell phone has a monthly base price of 99 plus 12 99 for each additional family member added beyond the primary account holder Write a linear function to model the monthly cost C x in dollars of a family plan for x additional family members added 1 C x 99x 12 99 2 C x 99x 12 99 3 c x 12 99x 99 4 c x 12 99x 99
Statistics
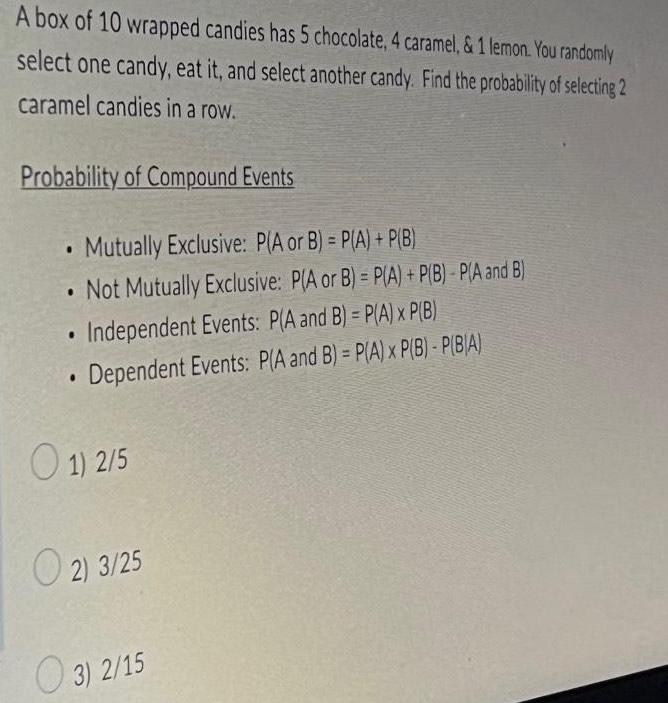
ProbabilityA box of 10 wrapped candies has 5 chocolate 4 caramel 1 lemon You randomly select one candy eat it and select another candy Find the probability of selecting 2 caramel candies in a row Probability of Compound Events Mutually Exclusive P A or B P A P B Not Mutually Exclusive P A or B P A P B P A and B Independent Events P A and B P A x P B Dependent Events P A and B P A x P B P BIA 1 2 5 2 3 25 3 2 15
Statistics
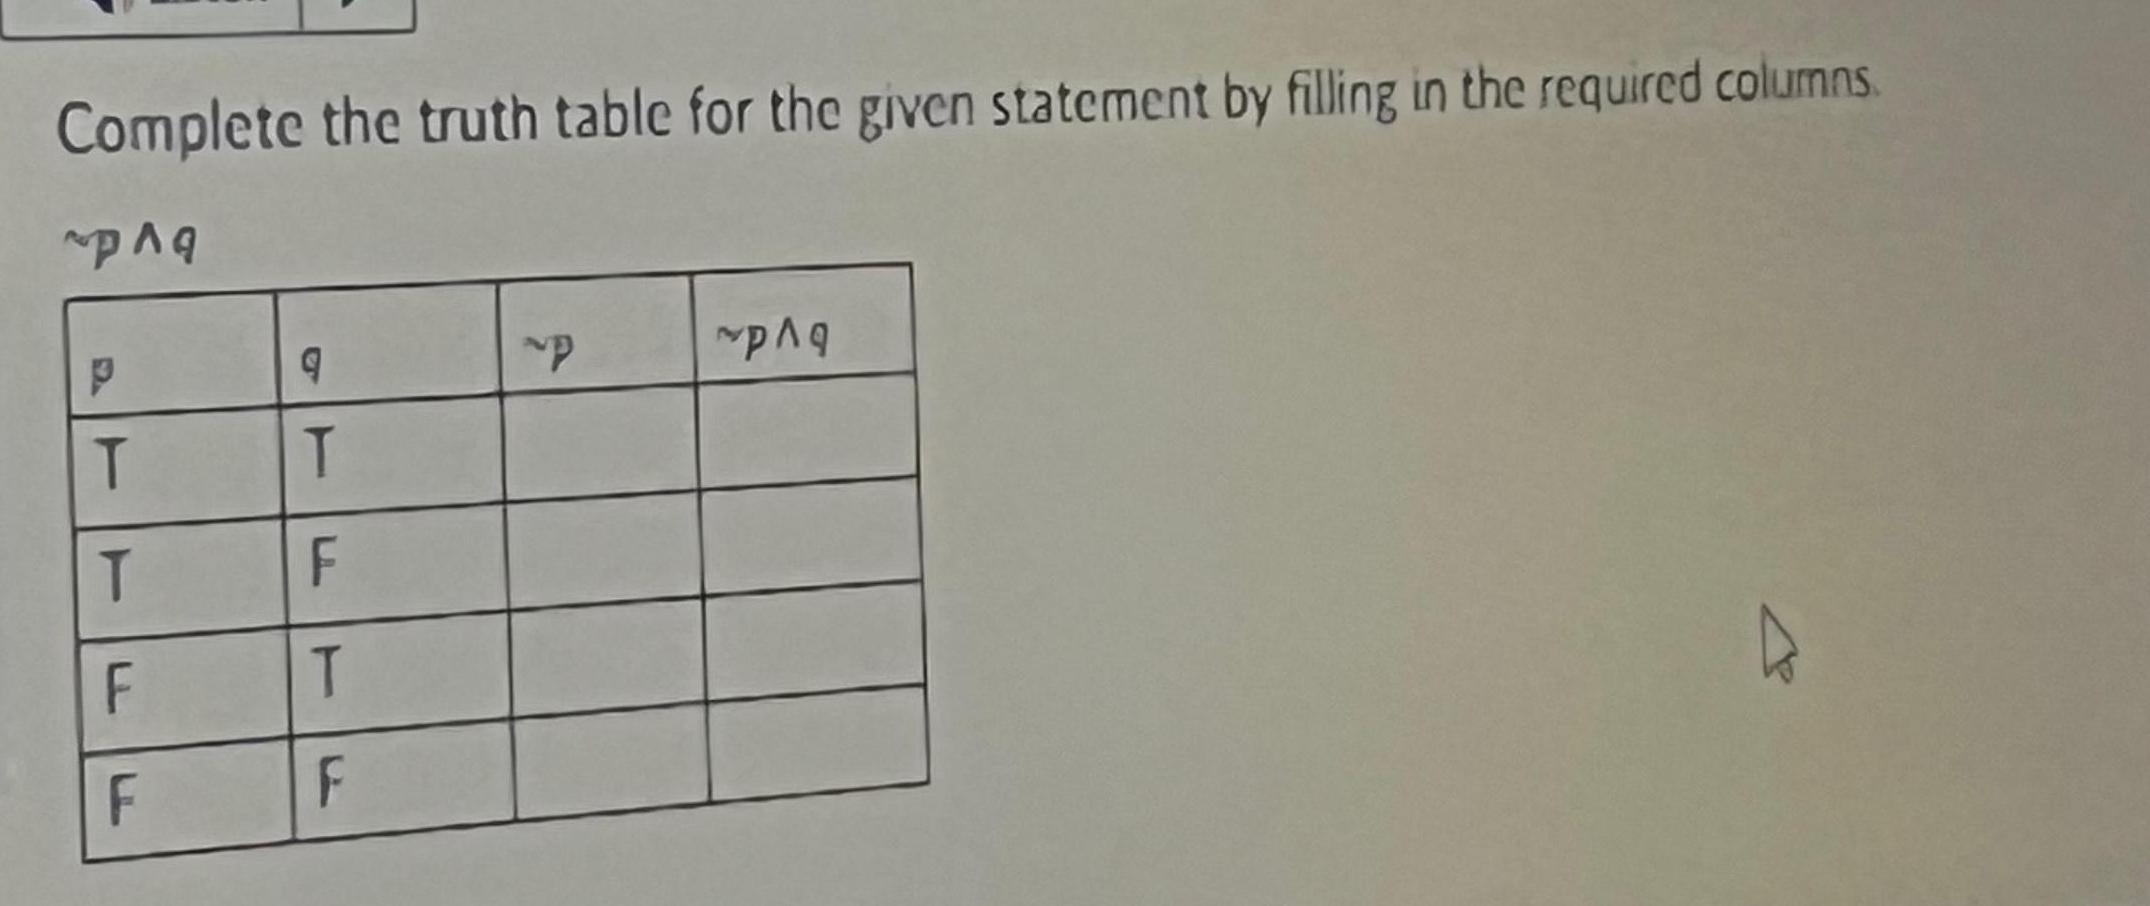
ProbabilityComplete the truth table for the given statement by filling in the required columns paq T T F F 9 T F T F P pag
Statistics
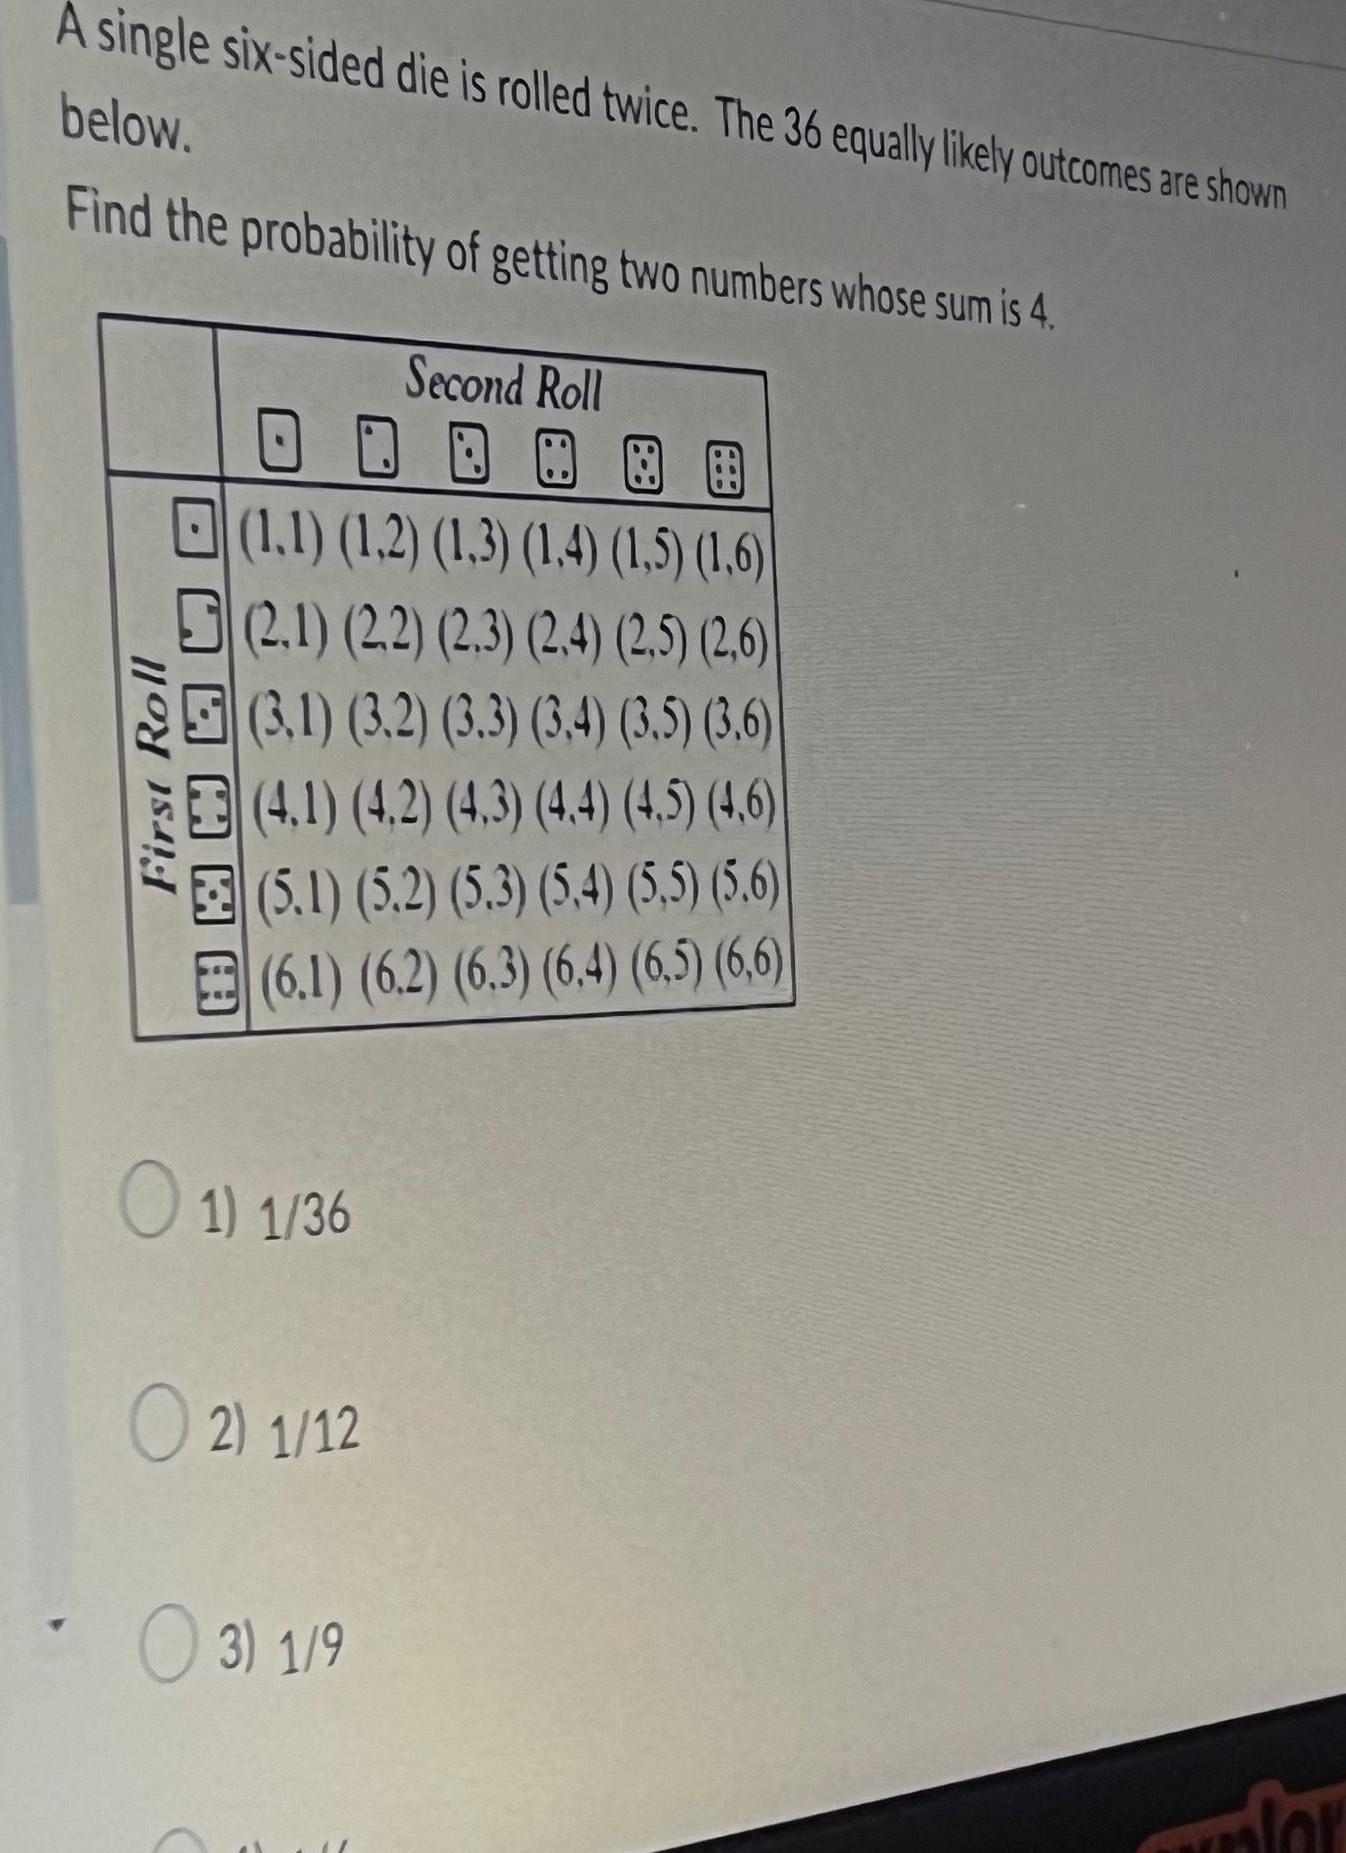
ProbabilityA single six sided die is rolled twice The 36 equally likely outcomes are shown below Find the probability of getting two numbers whose sum is 4 First Roll A 1 1 1 2 1 3 1 4 1 5 1 6 2 1 2 2 2 3 2 4 2 5 2 6 3 1 3 2 3 3 3 4 3 5 3 6 4 1 4 2 4 3 4 4 4 5 4 6 5 1 5 2 5 3 5 4 5 5 5 6 6 1 6 2 6 3 6 4 6 5 6 6 O 1 1 36 O2 1 12 Second Roll 3 1 9 for
Statistics
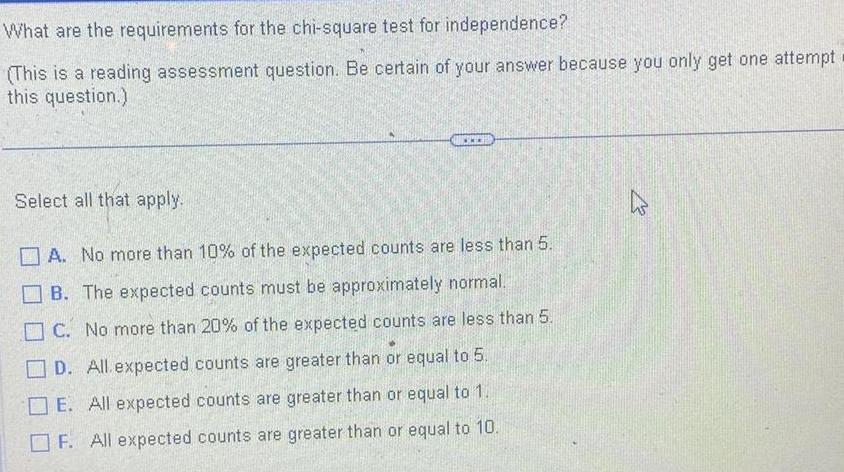
ProbabilityWhat are the requirements for the chi square test for independence This is a reading assessment question Be certain of your answer because you only get one attempt this question Select all that apply A No more than 10 of the expected counts are less than 5 B The expected counts must be approximately normal C No more than 20 of the expected counts are less than 5 D All expected counts are greater than or equal to 5 E All expected counts are greater than or equal to 1 F All expected counts are greater than or equal to 10
Statistics
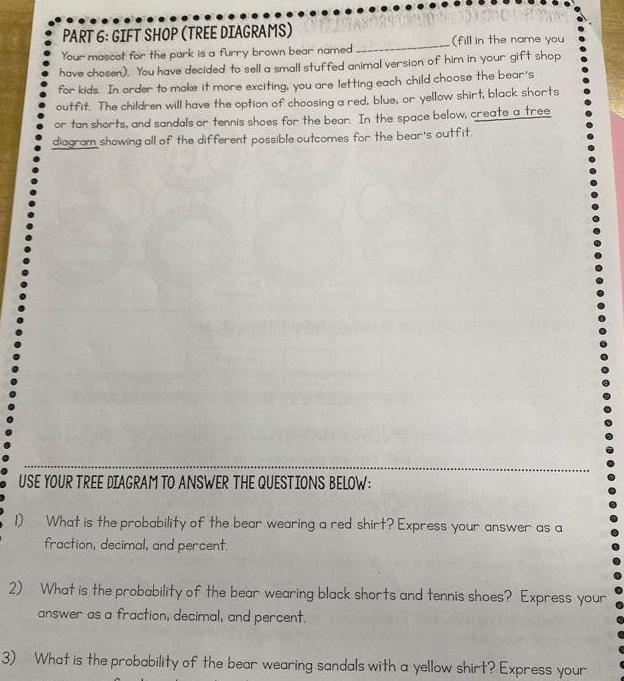
ProbabilityPART 6 GIFT SHOP TREE DIAGRAMS fill in the name you Your mascot for the park is a furry brown bear named have chosen You have decided to sell a small stuffed animal version of him in your gift shop for kids In order to make it more exciting you are letting each child choose the bear s outfit The children will have the option of choosing a red blue or yellow shirt black shorts or tan shorts and sandals or tennis shoes for the bear In the space below create a tree diagram showing all of the different possible outcomes for the bear s outfit USE YOUR TREE DIAGRAM TO ANSWER THE QUESTIONS BELOW D What is the probability of the bear wearing a red shirt Express your answer as a fraction decimal and percent 2 What is the probability of the bear wearing black shorts and tennis shoes Express your answer as a fraction decimal and percent 3 What is the probability of the bear wearing sandals with a yellow shirt Express your
Statistics
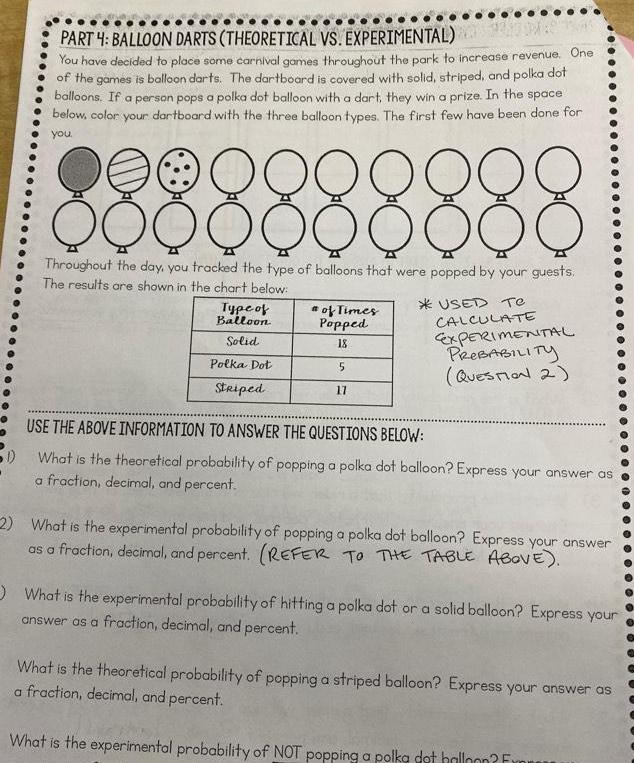
ProbabilityPART 4 BALLOON DARTS THEORETICAL VS EXPERIMENTAL You have decided to place some carnival games throughout the park to increase revenue One of the games is balloon darts The dartboard is covered with solid striped and polka dot balloons If a person pops a polka dot balloon with a dart they win a prize In the space below color your dartboard with the three balloon types The first few have been done for you 2 9 9 9 9 9 D O Q Q Q Q Q QQQ Throughout the day you tracked the type of balloons that were popped by your guests The results are shown in the chart below USED Te Type of Balloon Solid Polka Dot Striped of Times Popped 18 5 17 CALCULATE EXPERIMENTAL PROBABILITY QUESTION 2 USE THE ABOVE INFORMATION TO ANSWER THE QUESTIONS BELOW 1 What is the theoretical probability of popping a polka dot balloon Express your answer as a fraction decimal and percent 2 What is the experimental probability of popping a polka dot balloon Express your answer as a fraction decimal and percent REFER TO THE TABLE ABOVE What is the experimental probability of hitting a polka dot or a solid balloon Express your answer as a fraction decimal and percent What is the theoretical probability of popping a striped balloon Express your answer as a fraction decimal and percent What is the experimental probability of NOT popping a polka dot halloon Fr
Statistics
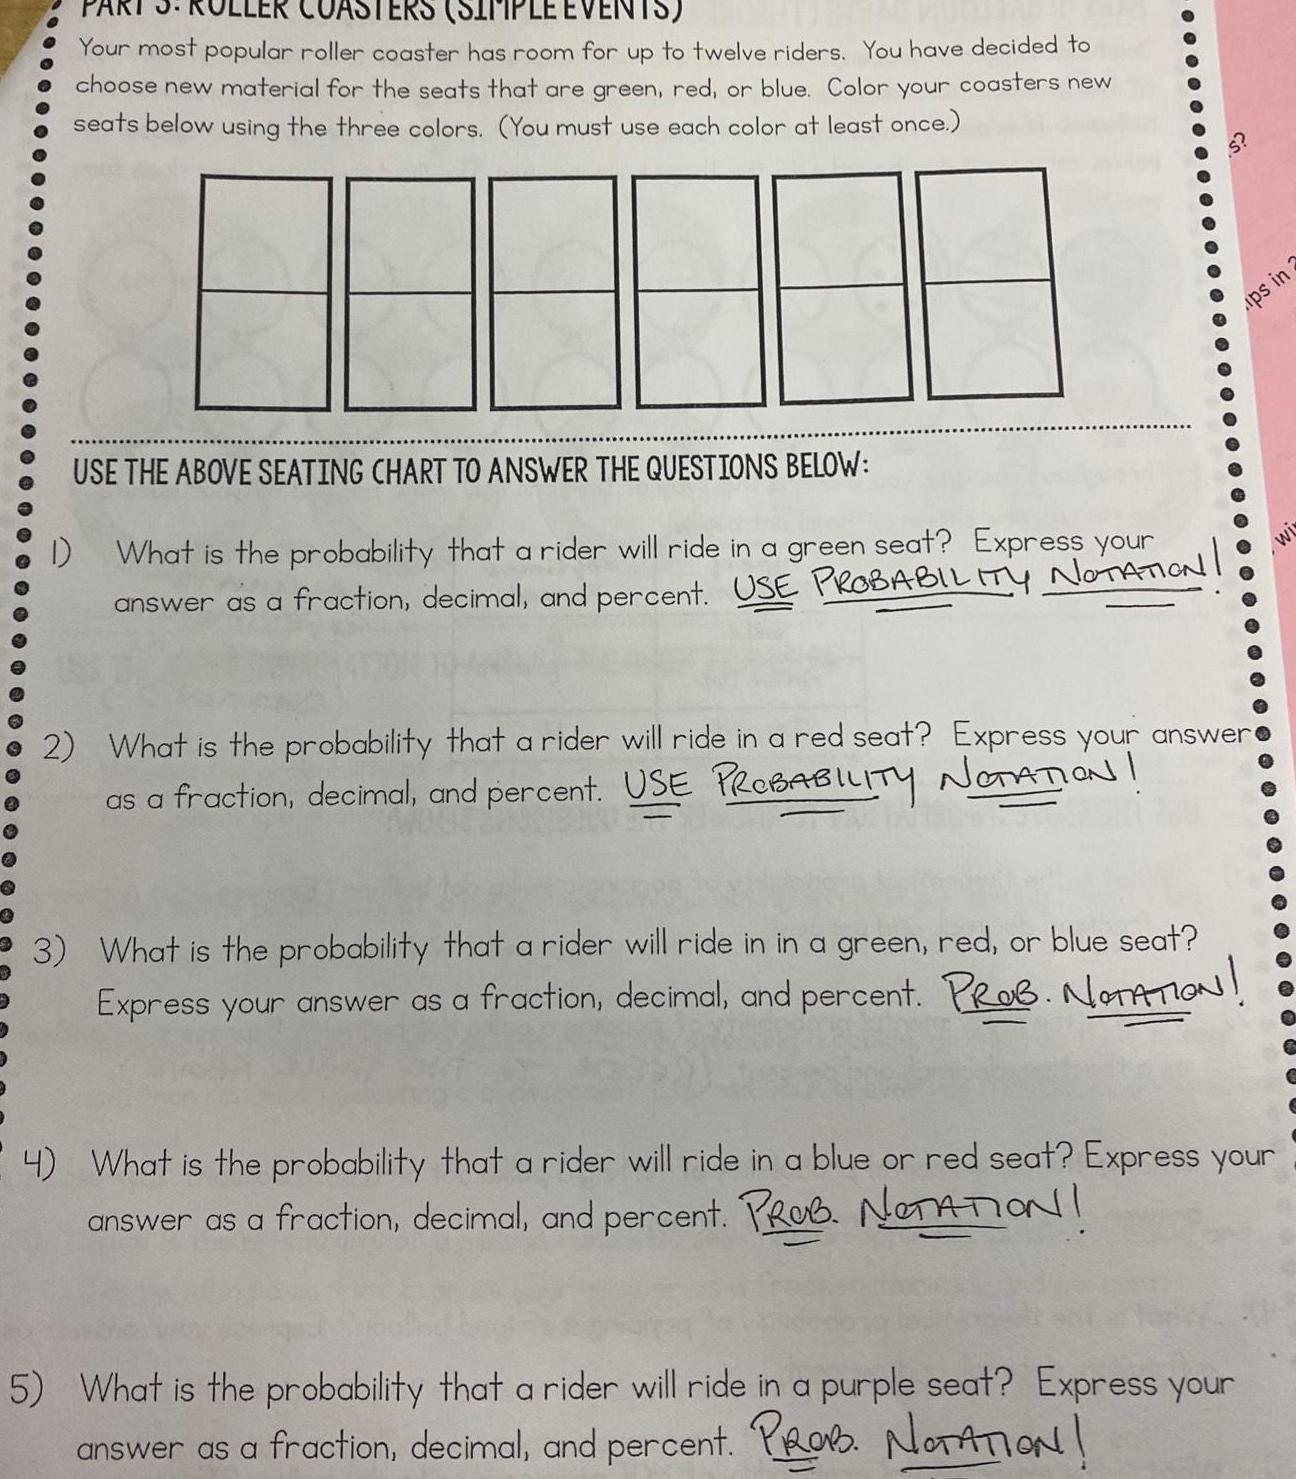
ProbabilityPART 3 ER COASTERS SIMPLE EVENTS Your most popular roller coaster has room for up to twelve riders You have decided to choose new material for the seats that are green red or blue Color your coasters new seats below using the three colors You must use each color at least once USE THE ABOVE SEATING CHART TO ANSWER THE QUESTIONS BELOW What is the probability that a rider will ride in a green seat Express your answer as a fraction decimal and percent USE PROBABILITY NOTATION 1 S 2 What is the probability that a rider will ride in a red seat Express your answer as a fraction decimal and percent USE PROBABILITY NOTATION ups in 3 What is the probability that a rider will ride in in a green red or blue seat Express your answer as a fraction decimal and percent PROB NOTATION 4 What is the probability that a rider will ride in a blue or red seat Express your answer as a fraction decimal and percent PROB NOTATION 5 What is the probability that a rider will ride in a purple seat Express your answer as a fraction decimal and percent PROB NOTATION 2 wi
Statistics
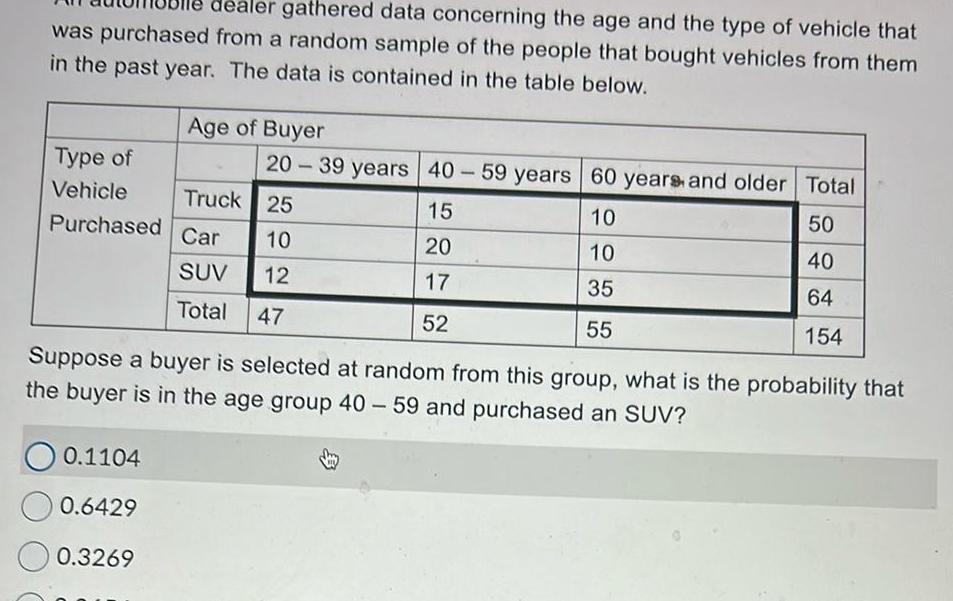
Probabilitydealer gathered data concerning the age and the type of vehicle that was purchased from a random sample of the people that bought vehicles from them in the past year The data is contained in the table below Age of Buyer Type of Vehicle Truck Purchased Car 0 1104 0 6429 0 3269 20 39 years 40 59 years 60 years and older Total 50 40 64 154 25 10 SUV 12 Total 47 15 20 17 52 10 10 35 55 Suppose a buyer is selected at random from this group what is the probability that the buyer is in the age group 40 59 and purchased an SUV

Statistics
ProbabilityWhat is an observational study What is a designed experiment Which allows the researcher to claim causation between an explanatory variable and a response variable What is an observational study OA An observational study is when a researcher assigns individuals to a certain group intentionally changing the value of an explanatory variable and then recording the value of the response variable for each group B An observational study measures the value of the response variable without attempting to influence the value of either the response or explanatory variables OC An observational study is a list of all individuals in a population along with certain characteristics of each individual