Probability Questions and Answers

Statistics
ProbabilityThis question 1 point s possible Sixty five percent of men consider themselves knowledgeable football fans If 14 men are randomly selected find the probability that exactly six of them will consider themselves knowledgeable fans OA 0 051 OB 0 176 OC 0 650 OD 0 429

Statistics
ProbabilityK Identify the sample space of the probability experiment and determine the number of outcomes in the sample space Draw a tree diagram Determining a person s letter grade A B C D F and gender male M female F Identify the sample space OA AM AF BM BF CM CF OB AM AF BM BF CM CF DM DF FM FF OC AM AF AB BM BF BB CM CF CB OD AM AF AB BM BF BB CM CF CB DM DF DB There are outcomes in the sample space Choose the correct tree diagram below OA O C A B MFBMFBMFBMFB B C C D D F MF M F M F M F M F OB O D tion 1 point s possible A B MFBM FBM A B C r MFMF M

Statistics
ProbabilityTale and female students in a particular country who received bachelor s degrees in business in a recent year Complete parts a and b below Click the icon to view the data on business degrees CITE a Find the probability that a randomly selected student is male given that the student received a business degree The probability that a randomly selected student is male given that the student received a business degree is Round to three decimal places as needed b Find the probability that a randomly selected student received a business degree given that the student is female The probability that a randomly selected student received a business degree given that the student is female is Round to three decimal places as needed Business Graduates Male Female Total Business degrees Nonbusiness degrees 185 138 612 098 161 362 860 323 346 500 1 472 421 Total 797 236 1 021 685 1 818 921 X O
Statistics
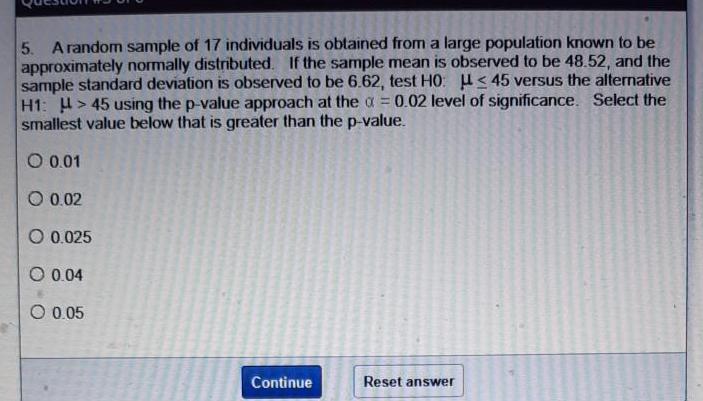
Probability5 A random sample of 17 individuals is obtained from a large population known to be approximately normally distributed If the sample mean is observed to be 48 52 and the sample standard deviation is observed to be 6 62 test HO 45 versus the alternative H1 45 using the p value approach at the 0 02 level of significance Select the smallest value below that is greater than the p value O 0 01 O 0 02 O 0 025 O 0 04 O 0 05 Continue Reset answer

Statistics
Probability4 A random sample of 32 individuals is obtained from a large population If the sample mean is observed to be 8 92 and the sample standard deviation is observed to be 3 46 test H0 10 versus the alternative H1 10 using the classical approach at the a 0 02 level of significance What is the critical value of the test Round your answer to the nearest thousandths Answer Continue Reset answer

Statistics
ProbabilityQuestion 1 of 6 1 A random sample of 28 individuals is obtained from a large population known to be approximately normally distributed If the sample mean is observed to be 16 9 and the sample variance is observed to be 8 2 test H0 18 versus the alternative H1 18 using the confidence interval approach at the 0 05 level of significance What is the left endpoint of this interval Round your answer to the nearest hundredths Answer

Statistics
ProbabilityCollege students are randomly selected and arranged in groups of three The random variable x is the number in the group who say that they take one or more online courses Determine whether a probability distribution is given If a probability distribution is given find its mean and standard deviation If a probability distribution is not given identify the requirements that are not satisfied Does the table show a probability distribution Select all that apply A Yes the table shows a probability distribution B No not every probability is between 0 and 1 inclusive C No the sum of all the probabilities is not equal to 1 D No the random variable x is categorical instead of numerical E No the numerical values of the random variable x are not associated with probabilities Find the mean of the random variable x Select the correct choice below and if necessary fill in the answer box to complete your choice OA SCCOR students Round to one decimal place as needed OB The table does not show a probability distribution Find the standard deviation of the random variable x Select the correct choice below and if necessary fill in the answer box to complete your choice A G students Round to one decimal place as needed OB The table does not show a probability distribution X 0 1 2 3 P x 0 102 0 352 0 404 0 142 S


Statistics
ProbabilityK Find the indicated z score The graph depicts the standard normal distribution with mean 0 and standard deviation 1 Click to view page 1 of the table Click to view page 2 of the table SEEEE

Statistics
ProbabilityAmanda paid 15 54 for a 2 12 pound bag of shrimp at one store The following week she paid 33 89 for a 4 54 pound bag at another store Find the unit price for each bag Then state which bag is the better buy based on the unit price Round your answers to the nearest cent Unit price for the 2 12 pound bag Unit price for the 4 54 pound bag The better buy 0 34 per pound 0 47 per pound The 2 12 pound bag The 4 54 pound bag Neither They have the same unit price


Statistics
ProbabilityD In May 2012 President Obama made history by revealing his support of gay marriage Around that time the Gallup Organization polled 1 024 U S adults about their opinions on gay lesbian relations and gay marriage They found that 54 of those sampled viewed gay lesbian relations as morally acceptable and that 50 felt that gay marriage should be legal A 90 confidence interval for the proportion of American adults who support gay marriage is 0 475 0 524 Does this confidence interval provide evidence that the percentage of American adults who support gay marriage differs from 50 State the significance level you are using No significance level of 5 O No significance level of 10 O Yes significance level of 5 Yes significance level of 10

Statistics
ProbabilityThe sampling distribution shows sample proportions from samples of size n 35 0 42 0 49 0 56 0 63 0 70 0 77 0 84 0 91 If samples of size n 65 had been used instead of n 35 which of the following would be true O The sample statistics would be centered at roughly the same proportion O The sample statistics would be centered at a smaller proportion O The sample statistics would be centered at a larger proportion

Statistics
ProbabilityA sample of size 46 with a mean of 13 6 is to be used to construct a confidence interval for A bootstrap distribution based on 1 000 samples is created Where will the bootstrap distribution be centered O 46 13 6 0 0 1 000

Statistics
ProbabilityIt is of interest to test the hypotheses Ho P 0 8 versus H P 0 8 The sample outcome based on n 10 observations is P 0 7 and the randomization statistic to be calculated is p The p value for this test was found to be 0 322 If the test was performed correctly where should the randomization distribution be centered 0 322 O 0 7 0 8 O 10
Statistics
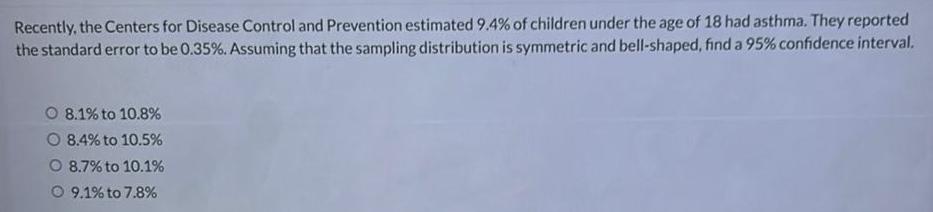
ProbabilityRecently the Centers for Disease Control and Prevention estimated 9 4 of children under the age of 18 had asthma They reported the standard error to be 0 35 Assuming that the sampling distribution is symmetric and bell shaped find a 95 confidence interval O 8 1 to 10 8 O 8 4 to 10 5 O 8 7 to 10 1 9 1 to 7 8

Statistics
ProbabilityIn a recent Gallup survey of 1 012 randomly selected U S adults age 18 and over 53 said that they were dissatisfied with the quality of education students receive in kindergarten through grade 12 They also report that the margin of sampling error is plus or minus 4 What is the sample being used O U S adults age 18 and over O 1 012 randomly selected U S adults O U S adults satisfied with K 12 education O U S adults dissatisfied with K 12 education 4

Statistics
ProbabilityAccording to ESPN com the average number of yards per game for all NFL running backs with at least 50 attempts in the 2011 season was 49 yards game A sample of 20 running backs from the 2011 season averaged 46 54 yards game Is 49 yards game a parameter or statistic O Parameter O Statistic


Statistics
ProbabilityA certain forum reported that in a survey of 2008 American adults 21 said they believed in astrology a Calculate a confidence interval at the 99 confidence level for the proportion of all adult Americans who believe in astrology Round your answers to three decimal places 0 233 0 187 Interpret the resulting interval We are 99 confident that the true population mean lies above this interval We are 99 confident that this interval contains the true population mean We are 99 confident that the true population mean lies below this interval We are 99 confident that this interval does not contain the true population mean b What sample size would be required for the width of a 99 CI to be at most 0 05 irrespective of the value of p Round your answer up to the nearest integer 441 X

Statistics
ProbabilityA sample of 11 joint specimens of a particular type gave a sample mean proportional limit stress of 8 42 MPa and a sample standard deviation of 0 77 MPa a Calculate and interpret a 95 lower confidence bound for the true average proportional limit stress of all such joints Round your answer to two decimal places X MPa 1 429 Interpret this bound O With 95 confidence we can say that the value of the true mean proportional limit stress of all such joints is greater than this value With 95 confidence we can say that the value of the true mean proportional limit stress of all such joints is less than this value O With 95 confidence we can say that the value of the true mean proportional limit stress of all such joints is centered around this value What if any assumptions did you make about the distribution of proportional limit stress We must assume that the sample observations were taken from a normally distributed population We must assume that the sample observations were taken from a uniformly distributed population We do not need to make any assumptions We must assume that the sample observations were taken from a chi square distributed population b Calculate and interpret a 95 lower prediction bound for proportional limit stress of a single joint of this type Round your answer to two decimal places X MPa 4 832 Interpret this bound If this bound is calculated for sample after sample in the long run 95 of these bounds will provide a lower bound for the corresponding future values of the proportional limit stress of single joint of this type If this bound is calculated for sample after sample in the long run 95 of these bounds will provide a higher bound for the corresponding future values of the proportional limit stress of single joint of this type If this bound is calculated for sample after sample in the long run 95 of these bounds will be centered around this value for the corresponding future values of the proportional limit stress of a single joint of this type

Statistics
Probability1288002 quizzes 3605 A hospital has a patient population of 1000 of which 400 are male and 600 are female Of the male patients 60 have heart disease while only 30 of the female patients have heart disease Answer the following Express your answer as a decimal Round your answers to the nearest hundredth if applicable Hint You may want to consider organizing your information in a table look at your notes where probability has the word given so that you get the idea of how to set this up a If a patient is selected at random from the hospital what is the probability that the patient has heart disease b Calculate the probability that a patient has heart disease given they are male c Calculate the probability that a patient is male given they have heart disease d If a patient is selected at random what is the probability that

Statistics
ProbabilityA hospital has a patient population of 1000 of which 400 are male and 600 are female Of the male patients 60 have heart disease while only 30 of the female patients have heart disease Answer the following Express your answer as a decimal Round your answers to the nearest hundredth if applicable Hint You may want to consider organizing your information in a table look at your notes where probability has the word given so that you get the idea of how to set this up a If a patient is selected at random from the hospital what is the probability that the patient has heart disease b Calculate the probability that a patient has heart

Statistics
Probability11 Consider a large population in which 34 17 of individuals have a characteristic of interest If a random sample of size 70 is selected from this population what approximately is the standard deviation of the sample proportion Round your answer to the nearest thousandths Answer Continue Reset answer

Statistics
Probability7 A random sample of size 22 is selected from a large population with unknown mean and unknown standard deviation Find the left endpoint of a 95 confidence interval for the population mean given that the sample mean is 12 6 and the sample standard deviation is 3 8 Assume the use of the t distribution is appropriate Round your answer to the nearest hundredths Answer Continue Reset answer

Statistics
Probability4 Suppose a large population has an unknown mean and a known standard deviation 0 4 4 How many individuals should be randomly sampled from this population so that the sample mean is within 0 75 unit of with 95 confidence Answer Continue Reset answer

Statistics
Probability6 Use the t chart to find t when 0 08 13 0 2 Note If you do not use the t chart you will need to round your answer to the nearest thousandths Answer Continue Reset answer

Statistics
ProbabilityExclude leap years from the following calculations a Compute the probability that a randomly selected person does not have a birthday on October 12 b Compute the probability that a randomly selected person does not have a birthday on the 1st day of a month c Compute the probability that a randomly selected person does not have a birthday on the 30th day of a month d Compute the probability that a randomly selected person was not born in February a The probability that a randomly selected person does not have a birthday on October 12 is 0 997 Type an integer or a decimal rounded to three decimal places as needed b The probability that a randomly selected person does not have a birthday on the 1st day of a month is 0 967 Type an integer or a decimal rounded to three decimal places as needed c The probability that a randomly selected person does not have a birthday on the 30th day of a month is Type an integer or a decimal rounded to three decimal places as needed

Statistics
Probabilityrobability experiment is conducted in which the sample space of the experiment is 12 13 14 15 16 17 18 19 20 21 22 23 Let event E 13 14 15 16 17 18 and event F 17 18 19 20 List the comes in E and F Are E and F mutually exclusive the outcomes in E and F Select the correct choice below and if necessary fill in the answer box to complete your pice A B Use a comma to separate answers as needed

Statistics
ProbabilityFind the probability P E if P E 0 29 The probability P E is Simplify your answer

Statistics
ProbabilityList all the permutations of five objects x y z s and t taken two at a time without repetition What is 5P2 List all the permutations of five objects x y z s and t taken two at a time without repetition Choose the correct answe below OA x y z s t OB xx xy xz xs xt yy yz ys yt zz zs zt ss st tt OC xy xz xs xt yz ys yt zs zt st D xy xz xs xt yx yz ys yt zx zy zs zt sx sy sz st tx ty tz ts What is 5P Simplify your answer

Statistics
Probabilityfy the H e integ tify the und to t Test Null hypothesis Alternative hypothesis T Value P Value 1 63 0 056 Heft 15 H 15 recent year Usin X given claim by using the displa

Statistics
ProbabilityList all the combinations of three objects x y and z taken two at a time What is 3C List all the combinations of three objects x y and z taken two at a time Choose the correct answer below OA xy xz yz OB xx xy xz yy yz zz OC x y z D xy xz yx yz zx zy

Statistics
ProbabilityUse a 0 01 significance level of all such times is less than 15 minutes the accompanying Minitab display is obtained Test the given claim by using the display provided from Minim of taxi cab rides in New York City yellow cabs during a Friday morning of the same day in a recent year Using 34 of the times to tem Click the icon to view the Minitab display Identify the null and alternative hypotheses Ho H Type integers or decimals Do not round ore 90 76 9 08 of 10 points Points 0 91 of 1 Sa


Statistics
ProbabilityTwenty one different video games showing drug use were observed The duration times of drug use in seconds were recorded When using this sample for a t test of the claim that the population mean is greater than 81 sec what does df denote and what is its value What does df denote A The number of degrees of freedom OB The sample size OC The sample standard deviation OD The test statistic The value of df is Type an integer or a decimal Do not round GELEE

Statistics
ProbabilityWhich of the following is an example of a sample A Average revenue of a selection of large businesses in the Phoenix area B All large businesses in the country C Average revenue of all large businesses in the country D A selection of large businesses in the Phoenix area

Statistics
Probability6 Suppose a large population has an unknown population proportion p How many individuals should be randomly sampled from this population so that the sample proportion is within 0 06 of p with 95 confidence Assume there is no prior information about regarding the population proportion p Answer Continue Reset answer

Statistics
ProbabilityWhat is the probability of an event that is impossible Suppose that a probability is approximated to be zero based on empirical results Does this mean that the event is impossible What is the probability of an event that is impossible 0 Type an integer or a decimal Suppose that a probability is approximated to be zero based on empirical results Does this mean that the event is impossible O No OYes
Statistics
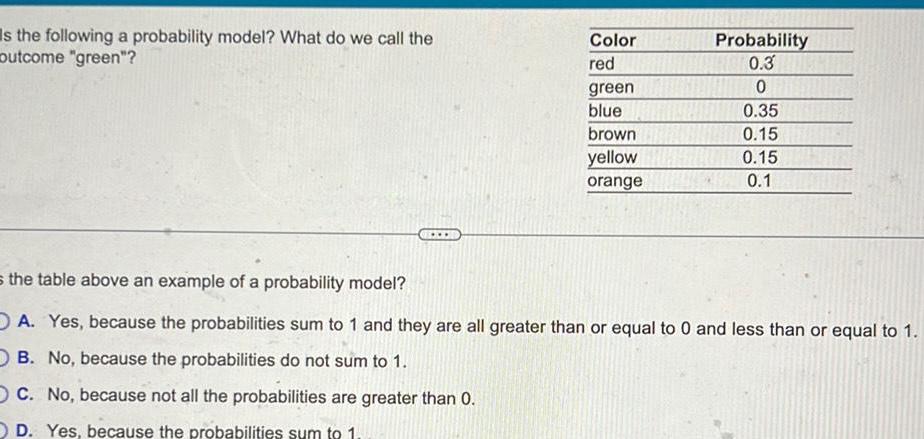
ProbabilityIs the following a probability model What do we call the outcome green Color red green blue brown yellow orange Probability 0 3 0 0 35 0 15 0 15 0 1 s the table above an example of a probability model OA Yes because the probabilities sum to 1 and they are all greater than or equal to 0 and less than or equal to 1 OB No because the probabilities do not sum to 1 OC No because not all the probabilities are greater than 0 D Yes because the probabilities sum to 1

Statistics
ProbabilitySuppose that events E and F are independent P E 0 4 and P F 0 8 What is the P E and F The probability P E and F is Type an integer or a decimal

Statistics
Probabilitybout 15 of the population of a large country is nervous around strangers If two people are randomly selected what is he probability both are nervous around strangers What is the probability at least one is nervous around strangers assume the events are independent a The probability that both will be nervous around strangers is Round to four decimal places as needed

Statistics
ProbabilityFor the fiscal year 2007 a tax authority audited 1 61 of individual tax returns with income of 100 000 or more Suppose this percentage stays the same for the current tax year What is the probability that two randomly selected returns with income of 100 000 or more will be audited The probability is Round to six decimal places as needed

Statistics
ProbabilitySuppose the lengths of human pregnancies are normally distributed with u 266 days and o 16 days Complete parts a and b below OB The probability that a randomly selected human pregnancy lasts less than 240 days is 0 9479 b The figure to the right represents the normal curve with 266 days and o 16 days The area between x 290 and x 305 is 0 0594 Provide two interpretations of this area Provide one interpretation of the area using the given values Select the correct choice below and fill in the answer boxes to complete your choice Type integers or decimals Use ascending order A The proportion of human pregnancies that last less than 290 or more than 350 days is 0 1406 OB The proportion of human pregnancies that last between and days is Provide a second interpretation of the area using the given values Select the correct choice below and fill in the answer boxes to complete your choice Type integers or decimals Use ascending order OA The probability that a randomly selected human pregnancy lasts less than OB The probability that a randomly selected human pregnancy lasts between or more than and C days is days is A 265 290 305

Statistics
ProbabilityDetermine whether the distribution represents a probability distribution 3 1 4 7 0 3 0 4 0 2 X P X 0 1 Send data to Excel The distribution Choose one represents a probability distribution

Statistics
ProbabilityA sample of size n 48 is drawn from a population whose standard deviation is o 23 Part 1 of 2 a Find the margin of error for a 95 confidence interval for u Round the answer to at least three decimal places The margin of error for a 95 confidence interval for u is 50 Part 2 of 2 b If the confidence level were 99 would the margin of error be larger or smaller because the confidence level is higher

Statistics
ProbabilityMatch the following histogram to the appropriate boxplot Match each histogram to the boxplot that represents the same data set a 1 2 3

Statistics
ProbabilityIn 2018 the Boston Red Sox defeated the Los Angeles Dodges to become the champions of Major League Baseball Following are the salaries in millions of dollars of the players on each of these teams Red Sox 31 00 23 75 21 00 20 00 15 00 12 00 8 55 3 58 2 85 2 48 1 60 1 15 0 72 0 62 0 56 0 56 0 56 0 56 0 56 0 56 0 56 Dodgers 31 00 20 00 18 00 18 00 17 90 5 00 4 50 3 00 3 00 2 10 0 71 0 61 0 60 0 58 0 57 0 57 0 56 0 56 0 56 0 56 0 56 Find the five number summary of the Red Sox salaries 5 00 4 30 0 58 0 56 3 73 3 50 0 58 0 57 0 56

Statistics
ProbabilityConsider n independent and identically distributed random variables from a distribution having the probability mass function P X x p 1 p x 1 1 where 0 p 1 i ii Show that C x xn 1X c is a best critical region for testing the null hypothesis Ho p 1 2 against the alternative hypothesis H p 3 4 Suppose n 121 and we require C in part i to have size 0 01 Using R attach R codes plot the power function K p for p 1 2