Probability Questions and Answers

Statistics
ProbabilityA sample of n 9 scores is randomly selected from a normal population with u 80 and o 9 If the sample mean is M 83 then the corresponding z score will indicate that a sample mean of M 83 is above 80 by 3 standard error units True False

Statistics
ProbabilityAt wind speeds above 1000 centimeters per second cm sec significant sand moving events begin to occur Wind speeds below 1000 cm sec deposit sand and wind speeds above 1000 cm sec mow sand to new locations The cyclic nature of wind and moving sand determines the shape and location of large dunes At a test site the prevailing direction of the wind did not change noticeably However the velocity did change Sixty three wind speed readings gave an average velocity of x 1075 cm sec Based on long term experience o can be assumed to be 285 cm sec a Find a 95 confidence interval for the population mean wind speed at this site Round your answers to the nearest whole number lower limit cm sec cm sec upper limit b Does the confidence interval indicate that the population mean wind speed is such that the sand is always moving at this site Explain O No This interval indicates that the population mean wind speed is such that the sand may not always be moving at this site O Yes This interval indicates that the population mean wind speed is such that the sand may not always be moving at this site O Yes This interval indicates that the population mean wind speed is such that the sand is always moving at this site O No This interval indicates that the population mean wind speed is such that the sand is always moving at this site

Statistics
ProbabilityThis table shows values that represent a quadratic function 012345 y 1 2 5 10 17 26 6 37 What is the average rate of change for this quadratic function for the interva from x 1 to x 3

Statistics
ProbabilityA random sample of n 49 scores is obtained from a population with o 14 If this specific sample mean is 4 50 points greater than the population mean what is the z score for this particular sample mean z 2 25 z 2 00 z 1 50 This cannot be determined with the provided information

Statistics
ProbabilitySuppose a simple random sample of size n 75 is obtained from a population whose size is N 25 000 and whose population proportion with a specified characteristic is p 0 2 Complete parts a through c below Determine the mean of the sampling distribution of p HA 0 2 Round to one decimal place as needed p Determine the standard deviation of the sampling distribution of p 0 0 046188 Round to six decimal places as needed p b What is the probability of obtaining x 18 or more individuals with the characteristic That is what is P p 0 24 P p 0 24 0 1922 Round to four decimal places as needed c What is the probability of obtaining x 9 or fewer individuals with the characteristic That is what is P p 0 12 Pp 0 12 Round to four decimal places as needed

Statistics
ProbabilityAccording to a study conducted by a statistical organization the proportion of people who are satisfied with the way things are going in their lives is 0 74 Suppose that a random sample of 100 people is obtained Complete parts a through e below D fact that people may not be responding to the question truthfully The sample proportion p is a random variable because the value of p varies from sample to sample The variability is due to the fact that different people feel differently regarding their satisfaction c Describe the sampling distribution of p the proportion of people who are satisfied with the way things are going in their life Be sure to verify the model requirements Since the sample size is no more than 5 of the population size and np 1 p 19 240 10 the distribution of p is approximately normal with 0 740 and x 0 044 P P Round to three decimal places as needed d In the sample obtained in part a what is the probability that the proportion who are satisfied with the way things are going in their life exceeds 0 77 The probability that the proportion who are satisfied with the way things are going in their life exceeds 0 77 is Round to four decimal places as needed

Statistics
Probability0 13 2 15 30 34 13 13 59 20 10 A score of 315 is 0 34 13 10 13 59 2 15 20 30 Use the figure to help you answer the following questions The National Assessment of Educational Progress NAEP is a nationwide assessment of students proficiency in nine subjects mathematics reading writing science the arts civics economics geography and US history The main NAEP assessments are conducted annually on samples of students from grades 4 8 and 12 0 13 In 2003 the mathematics scores for male students had a mean of 278 with a standard deviation of 37 Assume that these scores are normally distributed with the given mean and standard deviation A score of 167 is below the mean while a score of 389 is means that the percentage of male students with scores between 167 and 389 is You can infer that 97 72 of the male students have scores above above the mean This above the mean As a result the percentage of male students with scores below 315 is

Statistics
ProbabilityOne question from a survey was How many credit cards do you currently have The results of the survey are provided Complete parts a through g below Click the icon to view the survey results a Determine the mean number of credit cards based on the raw data The mean is 3 06 credit cards Type an integer or a decimal Do not round b Determine the standard deviation number of credit cards based on the raw data The standard deviation is 1 836 credit cards Round to three decimal places as needed c Determine a probability distribution for the random variable X the number of credit cards issued to an individual Credit Card Survey Results 3232523 2 P 6222225 10 2382933 3 3 3 2 4 42 2 3822145 337222 1542339 3232372 5132423 3423216 5 W 5 0 CI X x of cards P x x of cards P x 6 2 7 10 8 9 10 Type integers or decimals Do not round 1 345 Clear all UDU
Statistics
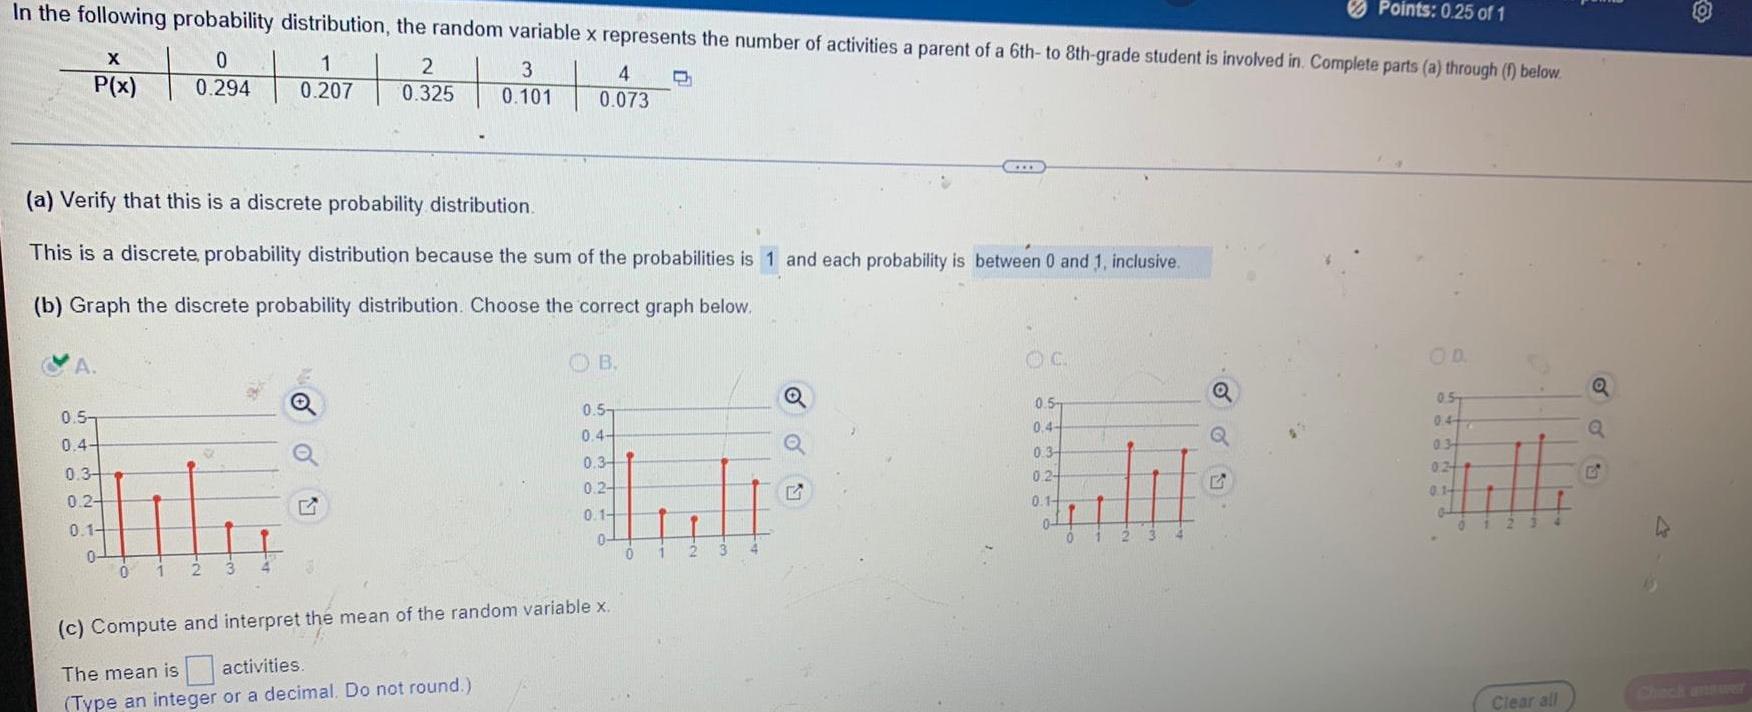
ProbabilityIn the following probability distribution the random variable x represents the number of activities a parent of a 6th to 8th grade student is involved in Complete parts a through 1 below 0 2 3 PX 0 294 0207 0 325 0 101 P x A 0 5 0 4 0 3 0 24 0 1 0 a Verify that this is a discrete probability distribution This is a discrete probability distribution because the sum of the probabilities is 1 and each probability is between 0 and 1 inclusive b Graph the discrete probability distribution Choose the correct graph below 0 1 2 3 4 0 073 13 OB 0 5 0 4 0 34 1 0 2 0 1 0 P c Compute and interpret the mean of the random variable x The mean is activities Type an integer or a decimal Do not round 01 2 3 Q G OC 0 5 0 4 0 3 0 24 0 1 n 2 Points 0 25 of 1 Q Q OD 0 5 047 03 024 0 1 0 Clear all Q Q G

Statistics
Probabilitye Left 0 04 24 Swimming pool drownings 140 drownings 120 drownings 100 drownings 80 drownings Chantel Childress Attempt 1 Number of people who drowned by falling into a pool correlates with Films Nicolas Cage appeared in 1999 1990 2000 2000 2001 2001 2002 2002 2003 2003 2004 2004 2005 Use this data to answer the following questions 2005 2006 2006 Nicholas Cage Swimming pool drownings 2007 2007 2008 2008 2009 2009 6 films 4 films 2 films O films Question 25 3 03 points Use this data to find the correlation between number of deaths from drowning by falling into a pool and number of Nicholas Cage movies THREE DECIMAL PLACES x xxx Nicholas Cage

Statistics
ProbabilityFor a multistate lottery the following probability distribution represents the cash prizes of the lottery with their corresponding probabilities Complete parts a through c below x cash prize Grand prize 200 000 10 000 100 7 4 3 0 P x 0 00000000504 0 00000012 0 000001686 0 000148622 0 004959544 0 006178738 0 01820095 0 97051033496 a If the grand prize is 17 000 000 find and interpret the expected cash prize If a ticket costs 1 what is your expected profit from one ticket The expected cash prize is S Round to the nearest cent as needed

Statistics
ProbabilityBody Mass Index of Young Men A set of examples in our textbook assumed that the body mass index BMI of all American young men follows a Normal distribution with standard deviation o 11 6 kg m2 How large a sample would be needed to estimate the mean BMI u in this population to within 1 1 with 95 confidence 428 427 21 441

Statistics
ProbabilityThe accompanying data represent the ideal number of children for a random sample of 900 adults Complete parts a through d below Click the icon to view the data about ideal numbers of children a Construct a discrete probability distribution for the random variable x x of children P x 0 1 2 3 4 5 6 Round to three decimal places as needed b Draw a graph of the probability distribution Choose the correct graph below GRECSECACHE Ideal Number of Children Data x of children Frequency 9 30 520 254 67 16 4 0 1 2 3 5 Print Done X

Statistics
ProbabilityA police officer randomly selected 585 police records of larceny thefts The accompanying data represent the number of offenses for various types of larceny thefts a Construct a probability model for type of larceny theft b Are purse snatching larcenies unusual c Are motor vehicle accessory larcenies unusual Click the icon to view the table OA Yes because there were 9 cases of purse snatching larcenies in the randomly selected records OB No because the probability of an unusual event is 0 O C Yes because P purse snatching 0 05 O D Yes because P purse snatching 0 5 c Choose the correct answer below OA No because P motor vehicle accessory larcenies 0 05 OB No because the probability of an unusual event is 0 OC No because there were 71 cases of motor vehicle accessory larcenies larcenies in the randomly selected records OD Yes because P motor vehicle accessory larcenies 0 5 Data table Type of Larceny Theft Pocket picking Purse snatching Shoplifting From motor vehicles Motor vehicle accessories Bicycles From buildings From coin operated machines Print Number of Offenses 8 Done 9 106 221 71 46 114 10

Statistics
Probabilitya Mean b Median c Mode 24 32 22 22 2 Which measure above is the best representation of the age of a typical student in our class Why

Statistics
ProbabilityTe Gata in the following table show the association between cigar smoking and death from cancer for 131 530 men Note current cigar smoker means cigar smoker at time of death Click the icon to view the table a If an individual is randomly selected from this study what is the probability that he died from cancer b If an individual is randomly selected from this study what is the probability that he was a current cigar smoker c If an individual is randomly selected from this study what is the probability that he died from cancer and was a current cigar smoker d If an individual is randomly selected from this study what is the probability that he died from cancer or was a current cigar smoker a P died from cancer Round to three decimal places as needed b P current cigar smoker Round to three decimal places as needed c P died from cancer and current cigar smoker Round to three decimal places as needed d P died from cancer or current cigar smoker Round to three decimal places as needed OCEED Data table Never smoked cigars Former cigar smoker Current cigar smoker Died from Cancer 592 85 154 Did Not Die from Cancer O 119 657 5 261 5 781 X

Statistics
ProbabilityWhat are the two requirements for a discrete probability distribution Choose the correct answer below Select all that apply OA P x 1 B P x 0 C 0 P x 1 D 0 P x 1

Statistics
ProbabilityA university conducted a survey of 364 undergraduate students regarding satisfaction with student government Results of the survey are shown in the table by class rank Complete parts a through d below Click the icon to view the table a If a survey participant is selected at random what is the probability that he or she is satisfied with student government P satisfied Round to three decimal places as needed b If a survey participant is selected at random what is the probability that he or she is a junior P junior Round to three decimal places as needed c If a survey participant is selected at random what is the probability that he or she is satisfied and a junior P satisfied and junior Round to three decimal places as needed d If a survey participant is selected at random what is the probability that he or she is satisfied or a junior GELED P satisfied or junior Round to three decimal places as needed Data table Satisfied Neutral Not satisfied Total Freshman 58 23 17 98 Sophomore Junior 64 54 11 14 10 88 Print 20 85 Done Senior 58 10 25 93 Total 234 58 72 364 C X

Statistics
Probabilityuniversity conducted a survey of 401 undergraduate students regarding satisfaction with student government Results of the survey are shown in the table by class rank Complete parts a through d below Click the icon to view the table a If a survey participant is selected at random what is the probability that he or she is satisfied with student government P satisfied Round to three decimal places as needed b If a survey participant is selected at random what is the probability that he or she is a junior P junior Round to three decimal places as needed c If a survey participant is selected at random what is the probability that he or she is satisfied and a junior P satisfied and junior Round to three decimal places as needed d If a survey participant is selected at random what is the probability that he or she is satisfied or a junior P satisfied or junior Round to three decimal places as needed Data table Satisfied Neutral Not satisfied Total Freshman Sophomore 53 Sophomore 51 29 19 101 Print 19 25 95 Junior 62 17 18 97 Done Senior 63 15 30 108 Total 229 80 92 401 X

Statistics
Probability27 Which of the following standard deviation of approximately 5 A B C D 60 65 70 75 E CH Ma 75 75 75 75 80 90 90 85 80 85 105 here

Statistics
Probabilitylice officer randomly selected 575 police records of larceny thefts The accompanying data represent the number of offenses for various types of larceny thefts a Construct a probability model for type of larceny theft b Are purse snatching larcenies unusual c Are motor vehicle accessory larcenies unusual Click the icon to view the table a Complete the table below Type of Larceny Theft Pocket picking Purse snatching Shoplifting From motor vehicles Motor vehicle accessories Probability Bicycles From buildings From coin operated machines Round to three decimal places as needed b Choose the correct answer below Data table Type of Larceny Theft Pocket picking Purse snatching Shoplifting From motor vehicles Motor vehicle accessories Bicycles From buildings From coin operated machines Print Number of Offenses C 9 10 Done 135 211 60 39 100 11 X

Statistics
Probability0 In a statistics class there are 23 juniors and 19 seniors 9 of the seniors are females and 15 of the juniors are males A student is selected at random Find the probability of selecting a junior or a female 0 24 42 30 34 42 28 42 32 42

Statistics
ProbabilityThe histograms below giv basketball leagues B n 70 71 72 73 74 75 76 Heights inches Which one of the following statements is true A The distribution of heights in League A has a lower mean and lower range than the distribution of heights in League B B The distribution of heights in League A has a lower mean and approximately the same range as the distribution of heights in League B C The distribution of heights in League A has a higher mean and lower range than the distribution of heights in League B D The distribution of heights in League A has a higher mean and higher range than the distribution of heights in League B E The distribution of heights in League A has a higher mean and approximately the same range as the distribution of heights in

Statistics
ProbabilityThe data on the right represent the number of traffic fatalities by seat location and gender Determine P male and P male passenger Are the events male and passenger independent Determine P male P male Round to three decimal places as needed Female Male Total Passenger 32 707 11 724 44 431 6 485 6 269 12 754 39 192 17 993 57 185 Driver Total

Statistics
ProbabilitySuppose x has a distribution with 28 and o 27 LAUSE SALT a If a random sample of size n 35 is drawn find o and P 28 x 30 Round o to two decimal places and the probability to four decimal places o x P 28 x 30 b If a random sample of size n 68 is drawn find o and P 28 x 30 Round o to two decimal places and the probability to four decimal places Hx ox P 28 x 30 Select c Why should you expect the probability of part b to be higher than that of part a Hint Consider the standard deviations in parts a and b The standard deviation of part b is Select part a because of the Select sample size Therefore the distribution about u is

Statistics
Probabilityof live multiple delivery births three or more babies in a particular year for women 15 to 54 years old Use the data to complete parts a through d below Age 15 19 20 24 25 29 30 34 35 39 40 44 45 54 Number of Multiple Births Typyr VI b Determine the probability that a randomly selected multiple birth for women 15 54 years old involved a mother who was not 30 to 39 years old P not 30 to 39 0 368 Type an integer or decimal rounded to three decimal places as needed c Determine the probability that a randomly selected multiple birth for women 15 54 years old involved a mother who was less than 45 years old P less than 45 Type an integer or decimal rounded to three decimal places as needed 96 507 1620 2831 1842 382 11 7

Statistics
ProbabilityThe amount of money spent weekly on cleaning maintenance and repairs at a large restaurant was observed over a long period of time to be approximately normally distributed with mean 609 and standard deviation 37 USE SALT a If 646 is budgeted for next week what is the probability that the actual costs will exceed the budgeted amount Round your answer to four decimal places b How much should be budgeted for weekly repairs cleaning and maintenance so that the probability that the budgeted amount will be exceeded in a given week is only 0 11 Round your answer to the nearest dollar

Statistics
ProbabilityThe data on the right represent the number of live multiple delivery births three or more babies in a particular year for women 15 to 54 years old Use the data to complete parts a through d below P less than 45 0 984 Type an integer or decimal rounded to three decimal places as needed Age 15 19 20 24 25 29 30 34 35 39 40 44 45 54 Number of Multiple Births 96 507 1620 2831 1842 382 117 d Determine the probability that a randomly selected multiple birth for women 15 54 years old involved a mother who was at least 40 years old Interpret this result Is it unusual Find the probability that a randomly selected multiple birth for women 15 54 years old involved a mother who was at least 40 years old P at least 40 Tung an integer or decimal rounded to three decimal places as needed

Statistics
ProbabilityA university conducted a survey of 371 undergraduate students regarding satisfaction with student government Results of the survey are shown in the table by class rank Complete parts a through d below Click the icon to view the table a If a survey participant is selected at random what is the probability that he or she is satisfied with student government P satisfied Round to three decimal places as needed Data table Satisfied Neutral Not satisfied Total 2 Freshman Sophomore Junior 53 45 64 22 10 25 18 100 73 P 20 15 99 Senior 59 11 29 99 Total 221 63 87 371 O X

Statistics
ProbabilityG The data on the right represent the number of live multiple delivery births three or more babies in a particular year for women 15 to 54 years old Use the data to complete parts a through d below PRO el Yo LONGE ANG Hours Age 15 19 20 24 25 29 30 34 35 39 40 44 45 54 a Determine the probability that a randomly selected multiple birth for women 15 54 years old involved a mother 30 to 39 years old P 30 to 39 Type an integer or decimal rounded to three decimal places as needed Number of Multiple Births 96 507 1620 2831 1842 382 11 7

Statistics
ProbabilityA vending machine automatically pours soft drinks into cups The amount of soft drink dispensed into a cup is normally distributed with a mean of 7 6 ounces and standard deviation of 0 4 ounce Examine the figure below and answer the following questions Area Under a Normal Curve 2 35 13 5 1757 17 34 H 30 20 H 0 34 13 5 2 35 a Estimate the probability that the machine will overflow an 8 ounce cup Round your answer to two decimal places 84 13 x H 0 20 30 68 95 99 7 b Estimate the probability that the machine will not overflow an 8 ounce cup Round your answer to two decimal places 15 85 X M CURS c The machine has just been loaded with 900 cups How many of these cups do you expect will overflow when served

Statistics
ProbabilityQuestion 5 Mandatory 4 points A 12 sided die can be made from a geometric solid called a dodecahedron Assume that a fair dodecahedron is rolled The sample space is 1 2 3 4 5 6 7 8 9 10 11 12 Find P Greater than 8 1 4 1 3 1 12

Statistics
ProbabilityVang Enterprises estimates that its WACC is 10 20 The company is considering the follwoing 7 capital budgeting projects in millions Project 1 234567 6 70 7 Assume that each of these projects is just as risky as the firm s existing assets Its CFO hired you to assist in deciding whether none some or all of the projects should be accepted If these are the only projects under consideration how large should the capital budget be O 102 80 172 Rate of Return Size millions 13 00 10 90 10 80 10 40 10 10 9 15 7 60 137 28 00 25 00 27 00 22 00 25 00 23 00 22 00

Statistics
ProbabilityIn a national survey college students were asked How often do you wear a seat belt when riding in a car driven by someone else The response frequencies appear in the table to the right a Construct a probability model for seat belt use by a passenger b Would you consider it unusual to find a college student who never wears a seat belt when riding in a car driven by someone else a Complete the table below Response Never Probability Round to the nearest thousandth as needed Response Never Rarely Sometimes Most of the time Always Frequency 121 309 509 1356 2426

Statistics
Probability1 Let T be a random variable that follows the Students t distribution with 11 degrees of freedom Use the t chart to approximate P T 1 363 Note If you do not use the t chart you will need to round your answer to the nearest hundredths Answer Continue Reset answer

Statistics
Probabilityfemale male total 236 148 95 222 82 55 458 230 150 479 359 838 Choose at random one Spring 2011 Math 1530 student What is the probability that the student gave the answer yes to the survey question PERCENT ANSWER TWO DECIMAL PLACES

Statistics
ProbabilityPsychologists often measure how long it takes mice to find their way through a maze The times for one particular maze follow an approximately Normal distribution with mean 18 seconds and standard deviation 3 seconds A researcher thinks that a loud noise will cause mice to complete the maze faster but not change the standard deviation She uses a loud noise to stimulate each of 10 mice right before she measures how long it takes each of them to complete the maze The sample mean is 16 2 seconds The appropriate null and alternative hypotheses for this test are Ho 18 seconds Ha 18 seconds The sample result is a not statistically significant at any level b statistically significant at the 5 level but not at the 2 level c proves that the mean time after a loud noise has changed to 116 2 seconds

Statistics
ProbabilityThe most recent NHANES report gives data for an SRS of 654 women aged 20 to 29 years The mean BMI of these 654 women was 26 8 On the basis of this sample we want to estimate the mean BMI u in the population of all 18 million women in this age group Past research has shown that the standard deviation for this population is 7 5 Based on the one sample used in the report we have O a 95 proof that the next sample mean will be in the same interval b 95 confidence that the population mean BMI is in the answer interval c the fact that the population mean BMI is 26 8 95 of the time d 95 evidence that any random 20 to 29 year old woman must have BMI between 26 21 and 27 39

Statistics
ProbabilityA professor standardizes exam scores so that all exams have 100 and d 15 If the original scores from the exam have 56 and d 5 then a student with an original exam score of X 50 would receive a standardized score of X 82 True False

Statistics
ProbabilityDishonest people try to fake numbers in tax returns invoices or expense account laims It s actually hard to make up numbers that are fully realistic One reason is that the first digits of numbers in legitimate records often follow a model known as Benford s Law Call the first digit of a randomly chosen record X for short Benford s Law gives this probability model for X First digit 1 2 3 4 5 6 7 8 9 X probability 0 301 0 176 0 125 0 097 0 079 0 067 0 058 0 051 0 046 For instance if ABC company has been keeping legitimate records of its accounts the probability that a randomly chosen record starts with the number 7 is 0 058 A company without this probability has been jiggering its records somehow Reference Benford s law If Tembo Safaris keeps legitimate records what percent of those records will start with the digits 5 6 or 7

Statistics
ProbabilityChoose a person aged 19 to 25 years at random and ask In the past seven days how many days did you go to an exercise or fitness center or work out Call the response X for short Based on a large random sample survey here is a probability model for the answer you will get Days probability 0 1 2 3 0 68 0 05 0 08 4 5 6 0 05 0 04 0 01 7 0 02 What is the probability that X 2 THE PROBABILITIES ARE GIVEN IN DECIMAL FORM YOUR ANSWERS SHOULD ALSO BE IN DECIMAL FORM

Statistics
ProbabilityA normal distribution has a mean of 72 and a standard deviation of 16 Q1 What is the percent of folks scoring above 80

Statistics
ProbabilityThe following data represent the number of people aged 25 to 64 years covered by health insurance private or government in 2018 Approximate the mean a standard deviation for age Age Number millions 25 34 23 8 44 7 Type an integer or decimal rounded to two decimal places as needed 6 Type an integer or decimal rounded to two decimal places as needed 35 44 30 6 45 54 30 9 55 64 25 2 C Sa

Statistics
Probabilitytion 1 Find the value of z when 0 015 0 2 Round your answer to the nearest hundredths Answer Previous Answer 2 17

Statistics
ProbabilityQuestion 3 of 6 3 A random sample of size 32 is selected from a large population with unknown mean and known standard deviation 3 What is the left endpoint of a 92 confidence interval for the population mean if the sample mean is 24 8 Round your answer to the nearest hundredths Answer

Statistics
Probabilitya Claim ABO A certain drug is used to treat asthma In a clinical trial of the drug 20 of 292 treated subjects experienced headaches based the manufacturer The accompanying calculator display shows results from a test of the claim that less than 10 of treated subjects experienced headaches Use the normal distribution as an approximation to the binomial distribution and assume a 0 01 significance level to complete parts a through e below Right tailed test Left tailed test b What is the test statistic 2 1 79 Round to two decimal places as needed c What is the P value prop 0 1 z 1 794630924 p 0 0363562614 p 0 0684931507 n 292

Statistics
ProbabilityA random sample of 854 births included 426 boys Use a 0 01 significance level to test the claim that 50 7 of newborn babies are boys Do the results support the belief that 50 7 of newborn babies are boys The test statistic for this hypothesis test is 0 48 Round to two decimal places as needed Identify the P value for this hypothesis test The P value for this hypothesis test is 0 631 Round to three decimal places as needed Identify the conclusion for this hypothesis test OA Fail to reject Ho There is sufficient evidence to warrant rejection of the claim that 50 7 of newborn babies are boys OB Fail to reject Ho There is not sufficient evidence to warrant rejection of the claim that 50 7 of newborn babies are boys OC Reject Ho There is sufficient evidence to warrant rejection of the claim that 50 7 of newborn babies are boys OD Reject Ho There is not sufficient evidence to warrant rejection of the claim that 50 7 of newborn babies are boys

Statistics
ProbabilityIn a study of 816 randomly selected medical malpractice lawsuits it was found that 476 of them were dropped or dismissed Use a 0 05 significance level to test the claim that most medical malpractice lawsuits are dropped or dismissed revolut U Round to three decimal places as needed GIIS What is the conclusion about the null hypothesis QA Reject the null hypothesis because the P value is greater than the significance level a OB Fail to reject the null hypothesis because the P value is greater than the significance level c CC Fail to reject the null hypothesis because the P value is less than or equal to the significance level a D Reject the null hypothesis because the P value is less than or equal to the significance level a What is the final conclusion A There is not sufficient evidence to support the claim that most medical malpractice lawsuits are dropped or dismissed OB There is not sufficient evidence to warrant rejection of the claim that most medical malpractice lawsuits are dropped or dismissed OC There is sufficient evidence to warrant rejection of the claim that most medical malpractice lawsuits are dropped or dismissed D There is sufficient evidence to support the claim that most medical malpractice lawsuits are dropped or dismissed

Statistics
Probabilitystudy was conducted that resulted in the following elative frequency histogram Determine whether or not the histogram indicates that a normal distribution could be used as a model for the variable 0 4 0 2 1000 2000 3000 4000 OA The histogram is not bell shaped so a normal distribution could not be used as a model for the variable OB The histogram is bell shaped so a normal distribution could be used as a model the variable OC The histogram is not bell shaped so a normal distribution could be used as a mod the variable OD The histogram is bell shaped so a normal distribution could not be used as a mod the variable

Statistics
Probabilitylengths of human pregnancies are normally distributed with 266 days and ays Complete parts a and b below The figure to the right represents the normal curve with 266 days and a 16 days The area between x 290 and 305 is 0 0594 Provide two interpretations of this area ovide one interpretation of the area using the given values lect the correct choice below and fill in the answer boxes to mplete your choice pe integers or decimals Use ascending order A The proportion of human pregnancies that last between and days is B The proportion of human pregnancies that last less than more than 266 290 305