Probability Questions and Answers

Statistics
ProbabilityThe distribution of the sample mean x will be normally distributed if the sample a population that is normally distributed regardless of the sample size Choose the correct answer below O False True

Statistics
Probability120 psychology students took a standardized test The scores are summarized in the GFDT below Frequency 16 19 16 20 12 37 Scores 100 104 105 109 110 114 115 119 120 124 125 129 The scores are also described in the cumulative table shown below Scores less than 105 less than 110 less than 115 less than 120 less than 125 less than 130 Frequency 16 35 51 83 120 What is the missing value in the cumulative GFDT

Statistics
ProbabilityOn one large campus 21 of students surveyed said that they spend less than an hour a night studying If three students are chosen randomly find the following probabilities Part 1 of 2 a What s the probability that all three spend less than an hour a night studying Express your answer as a decimal rounded to four decimal places The probability that all three spend less than an hour a night studying 0 0093 Part 1 2 Part 2 of 2 b What s the probability that two of the three spend less than an hour studying Express your answer as a decimal rounded to four decimal places Do not round any intermediate calculations The probability that two of the three spend less than an hour a night studying is

Statistics
ProbabilityHow large should n be to guarantee that the Simpson s Rule approximation to 1 13e n 2 200 dx is accurate to within 0 00001

Statistics
ProbabilityA water taxi carries passengers from harbor to another Assume that weights of passengers are normally distributed with a mean of 19 The water taxi has a stated capacity of 25 passengers and the water taxi was rated for a load limit of 3750 lb Complete parts a through d below a Given that the water taxi was rated for a load limit of 3750 lb what is the maximum mean weight of the passengers if the water taxi is filled to the stated capacity of 25 passengers The maximum mean weight is 150 lb Type an integer or a decimal Do not round b If the water taxi is filled with 25 randomly selected passengers what is the probability that their mean weight exceeds the value from part a The probability is 1 Round to four decimal places as needed c If the weight assumptions were revised so that the new capacity became 20 passengers and the water taxi is filled with 20 randomly selected passengers what is the probability that their mean weight exceeds 187 5 lb which is the maximum mean weight that does not cause the total load to exceed 3750 lb The probability is Round to four decimal places as needed

Statistics
Probability5 The sampling distribution of x is given below Find X XI 1 0 P x 0 2 Answer 1 5 2 0 0 3 2 5 0 4 0 1 Round your answer to the nearest thousandths FANAR

Statistics
Probability4 The sampling distribution of x is given below Find X 3 0 P X Answer 3 5 0 2 0 3 40 0 4 4 5 0 1

Statistics
Probability2 What is the probability that a simple random sample of size 2 drawn from the small population 2 2 3 4 will result in a sample mean of 3 5 Round your answer to the nearest hundredths Answer Continue Reset answer
Statistics
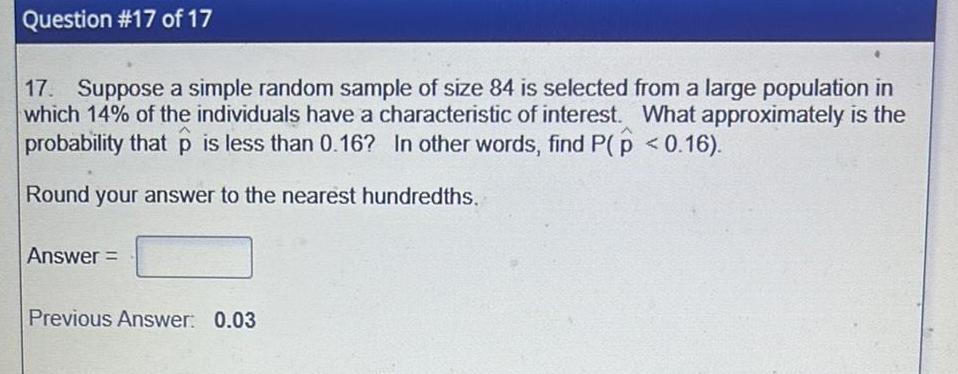
ProbabilityQuestion 17 of 17 17 Suppose a simple random sample of size 84 is selected from a large population in which 14 of the individuals have a characteristic of interest What approximately is the probability that p is less than 0 16 In other words find P p 0 16 Round your answer to the nearest hundredths Answer Previous Answer 0 03

Statistics
Probabilityfollowing results from a test for marijuana use which is provided by a certain drug testing company Among 145 subjects with positive test results there are 27 false positive results Among 153 negative results there are 2 false negative results Complete parts a through c Hint Construct a table a How many subjects were included in the study The total number of subjects in the study was 298 b How many subjects did not use marijuana A total of 178 subjects did not use marijuana c What is the probability that a randomly selected subject did not use marijuana The probability that a randomly selected subject did not use marijuana is Do not round until the final answer Then round to three decimal places as needed

Statistics
ProbabilityWords were displayed on a computer screen with background colors of red and blue Results from scores on a test of word recall are given below Use a 0 05 significance level to test the claim that the samples are from populations with the same standard deviation Assume that both samples are independent simple random samples from populations having normal distributions Does the background color appear to have an effect on the variation of word recall scores Red Background Blue Background X S n 34 15 66 5 99 36 12 47 5 49 What are the null and alternative hypotheses OA H 0 0 2 H 0 1 202 2 OC Ho o 02 H 0 0 www OB Ho 0 02 H 0 20 OD Ho 0 H 0 0

Statistics
ProbabilityA modified roulette wheel has 32 slots One slot is 0 another is 00 and the others are numbered 1 through 30 respectively You are placing a bet that the outcome is an even number In roulette 0 and 00 are neither odd nor even a What is your probability of winning The probability of winning is Type an integer or a simplified fraction

Statistics
Probabilityhen randomly selecting an adult A denotes the event of selecting someone with blue eyes What do P A and P epresent P A represents the A represents the event of selecting an adult with blue eyes probability of selecting an adult with blue eyes event of selecting an adult who does not have blue eyes probability of selecting an adult who does not have blue eyes

Statistics
ProbabilityAmong 400 randomly selected drivers in the 20 24 age bracket 4 were in a car crash in the last year It a driver in that age bracket is randomly selected what is the approximate probability that he or she will be in a car crash during the nex year Is it unlikely for a driver in that age bracket to be involved in a car crash during a year Is the resulting value high enough to be of concern to those in the 20 24 age bracket Consider an event to be unlikely if its probability is less than or equal to 0 05 The probability that a randomly selected person in the 20 24 age bracket will be in a car crash this year is approximately Type an integer or decimal rounded to the nearest thousandth as needed

Statistics
ProbabilityWhich of the following values cannot be probabilities 1 1 11 0 01 5 3 2 0 41 0 3 5 Select all the values that cannot be probabilities A 3 35 B 5 3 C 2 D 0 41 E 0 01 F 0 G 1 11 H 1

Statistics
Probabilitypling Three randomly selected children are surveyed The ages of the children are 1 3 and 8 Assume that samples population of 1 3 and 8 Listed below are the nine different samples Complete parts a through d 1 1 1 3 1 8 3 1 3 3 3 8 8 1 8 3 8 8 3 Type an integer or a decimal Do not round b Find the median of each of the nine samples then summarize the sampling distribution of the medians in the format of a table representing the probability distribution of the distinct median values Sample Median Probability fractions

Statistics
ProbabilityWhen two births are randomly selected the sample space for genders is bb bg gb and gg Assume that those four outcomes are equally likely Construct a table that describes the sampling distribution of the sample proportion of girls from two births Does the mean of the sample proportions equal the proportion of girls in two births Do the result suggest that a sample proportion is an unbiased estimator of a population proportion For the entire population assume the probability of having a boy is the probability of having a girl is and this is not affected by how many boys or girls have previously been born c Yes both the mean of the sample proportions and the population proportion are OD Yes both the mean of the sample proportions and the population proportion are Does the result suggest that a sample proportion is an unbiased estimator of a population proportion OA No because the sample proportions and the population proportion are the same OB Yes because the sample proportions and the population proportion are the same OC Yes because the sample proportions and the population proportion are not the same OD No because the sample proportions and the population proportion are not the same

Statistics
ProbabilityPoints 0 of 1 34 births are randomly selected the sample space for genders is bb bg gb and gg Assume that those four outcomes are equally likely Construct a table that describes the sampling distribution of the sample proportion of girls from two births Does the mean of the sample proportions equal the proportion of girls in two births Doe the result suggest that a sample proportion is an unbiased estimator of a population proportion For the entire population assume the probability of having a boy is the 1 1 probability of having a girl is and this is not affected by how many boys or girls have previously been born Does the mean of the sample proportions equal the proportion of girls in two births OA No the mean of the sample proportions and the population proportion are not equal OB Yes both the mean of the sample proportions and the population proportion are 3 1 C Yes both the mean of the sample proportions and the population proportion are 1 OD Yes both the mean of the sample proportions and the population proportion are points type integers or simpimed tractions Save
Statistics
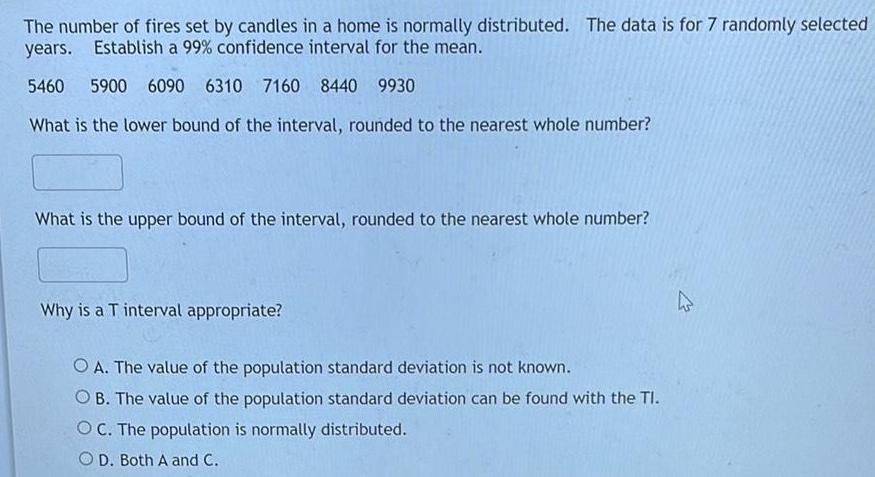
ProbabilityThe number of fires set by candles in a home is normally distributed The data is for 7 randomly selected years Establish a 99 confidence interval for the mean 5460 5900 6090 6310 7160 8440 9930 What is the lower bound of the interval rounded to the nearest whole number What is the upper bound of the interval rounded to the nearest whole number Why is a T interval appropriate OA The value of the population standard deviation is not known OB The value of the population standard deviation can be found with the TI OC The population is normally distributed OD Both A and C

Statistics
Probabilitystandard deviation 1 region The graph depicts the standard normal distribution of bone density scores with mean 0 and Z 1 19

Statistics
ProbabilityFind the mean of the data summarized in the given frequency distribution Compare the computed mean to the actual mean of 51 2 degrees Low Temperature o F Frequency 40 44 45 49 50 54 55 59 60 64 1 6 9 4 1 The mean of the frequency distribution is 51 5 degrees Round to the nearest tenth as needed Which of the following best describes the relationship between the computed mean and the actual mean O A The computed mean is close to the actual mean because the difference between the means is less than 5 of the actual mean OB The computed mean is close to the actual mean because the difference between the means is more than 5 of the actual mean OC The computed mean is not close to the actual mean because the difference between the means is less than 5 of the actual mean D The computed mean is not close to the actual mean because the difference between the means is more than 5 of the actual mean

Statistics
ProbabilityA researcher is interested in finding a 99 confidence interval for the mean number of times per day that college students text The study included 131 students who averaged 28 2 texts per day The standard deviation was 14 2 texts Round answers to 3 decimal places where possible a With 99 confidence the population mean number of texts per day is between texts and b If many groups of 131 randomly selected members are studied then a different confidence interval would be produced from each group About percent of these confidence intervals will contain percent will not contain the true the true population number of texts per day and about population mean number of texts per day

Statistics
ProbabilityWhat is the significance of the mean of a probability distribution Choose the correct answer below OA It can never be negative B It is the expected value of a discrete random variable OC It gives information about how the outcomes vary OD It represents the most likely possible outcome
Statistics
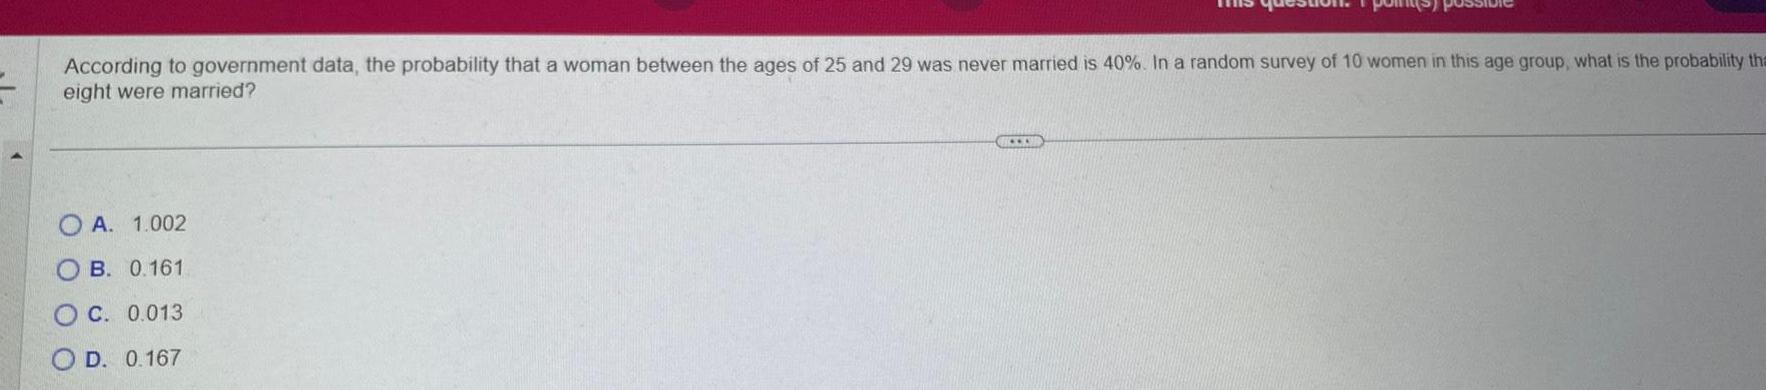
ProbabilityAccording to government data the probability that a woman between the ages of 25 and 29 was never married is 40 In a random survey of 10 women in this age group what is the probability tha eight were married A 1 002 OB 0 161 OC 0 013 OD 0 167
Statistics
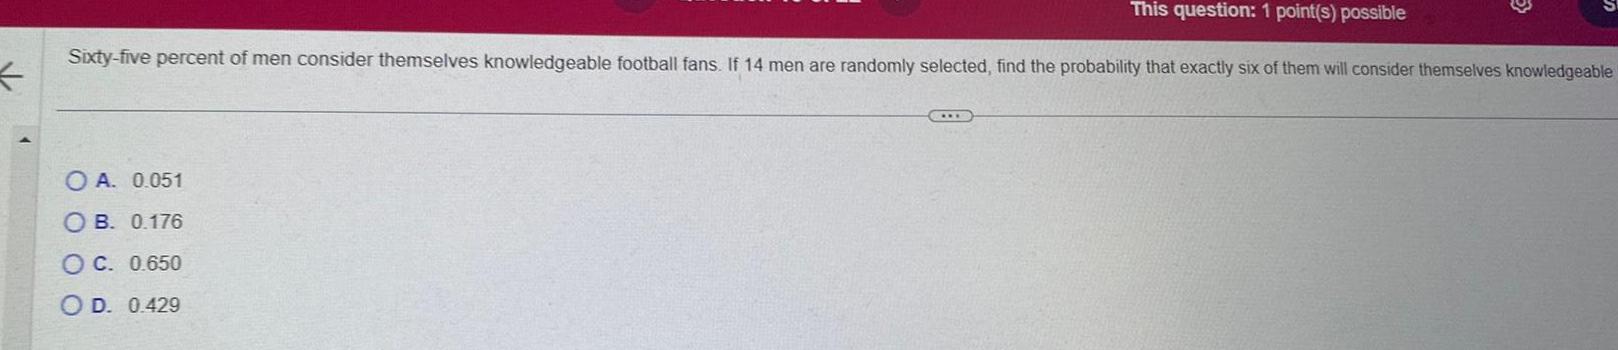
ProbabilityK Sixty five percent of men consider themselves knowledgeable football fans If 14 men are randomly selected find the probability that exactly six of them will consider themselves knowledgeable O A 0 051 OB 0 176 OC 0 650 OD 0 429 This question 1 point s possible E

Statistics
ProbabilityThis question 1 point s possible In a recent survey 80 of the community favored building a police substation in their neighborhood If 15 citizens are chosen what is the mean number favoring the substation OO O A 10 B 12 O C 15 OD 8

Statistics
ProbabilityK The following table contains data from a study of two airlines which fly to Small Town USA Number of flights which were on time Number of flights which were late Podunk Airlines 33 43 6 5 Upstate Airlines If one of the 87 flights is randomly selected find the probability that the flight selected is an Upstate Airlines flight given that it was late Express your answer as a simplified fraction 5 OA 48 O B 5 87 5 11 OD None of the above is correct O C C M This question 1 point s possible

Statistics
ProbabilityDetermine the written description of the complement of the given event When ten televisions are shipped at least one of them is free of defects Choose the correct answer below OA None of them are defective OB More than one of them are defective OC All of them are defective OD All of them are free of defects

Statistics
ProbabilityThe probability is Type an integer or a decimal Do not round poss Nineteen of the 100 digital video recorders DVRs in an inventory are known to be defective What is the probability you randomly select a DVR that is not defective submit quiz

Statistics
ProbabilityGiven the confidence interval 0 44 0 72 determine the value of p a 0 140 b 1 160 c 0 280 d 0 580
Statistics
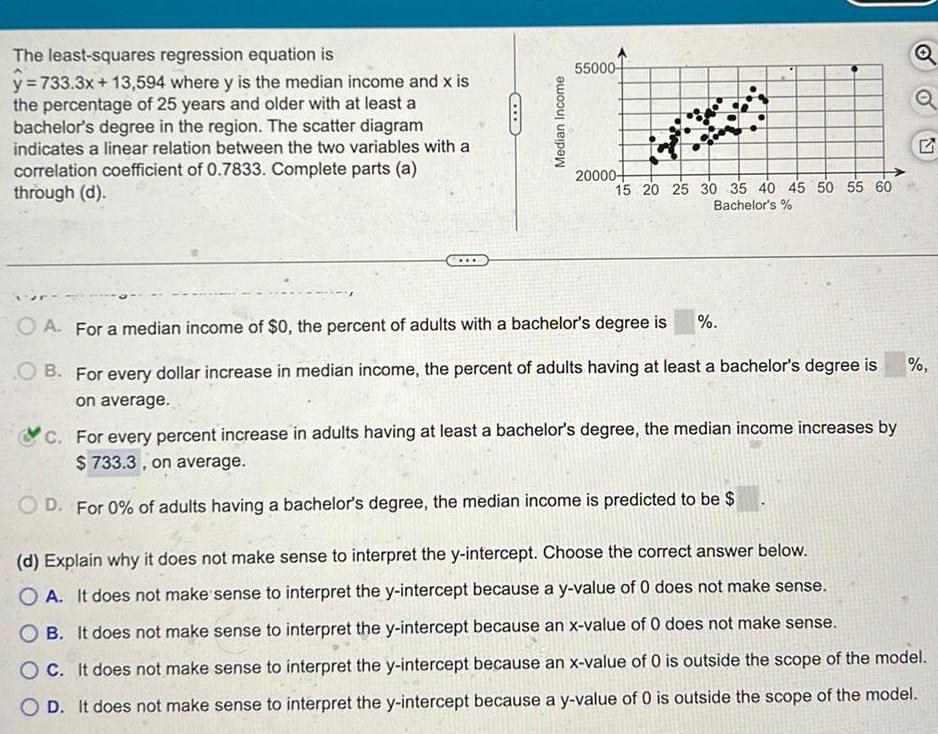
ProbabilityThe least squares regression equation is y 733 3x 13 594 where y is the median income and x is the percentage of 25 years and older with at least a bachelor s degree in the region The scatter diagram indicates a linear relation between the two variables with a correlation coefficient of 0 7833 Complete parts a through d Median Income 55000 20000 15 20 25 30 35 40 45 50 55 60 Bachelor s OA For a median income of 0 the percent of adults with a bachelor s degree is OB For every dollar increase in median income the percent of adults having at least a bachelor s degree is on average C For every percent increase in adults having at least a bachelor s degree the median income increases by 733 3 on average D For 0 of adults having a bachelor s degree the median income is predicted to be Q Q d Explain why it does not make sense to interpret the y intercept Choose the correct answer below OA It does not make sense to interpret the y intercept because a y value of 0 does not make sense OB It does not make sense to interpret the y intercept because an x value of 0 does not make sense OC It does not make sense to interpret the y intercept because an x value of 0 is outside the scope of the model D It does not make sense to interpret the y intercept because a y value of 0 is outside the scope of the model

Statistics
ProbabilityMatch the linear correlation coefficient to the scatter diagram The scales on the x and y axis are the same for each scatter diagram a r 0 810 b r 1 c r 0 049 a Scatter diagram b Scatter diagram c Scatter diagram Response Response 3 Explanatory Explanatory

Statistics
ProbabilityThe linear correlation between violent crime rate and percentage of the population that has a cell phone is 0 918 for years since 1995 Do you believe that increasing the percentage of the population that has a cell phone will decrease the violent crime rate What might be a lurking variable between percentage of the population with a cell phone and violent crime rate Will increasing the percentage of the population that has a cell phone decrease the violent crime rate Choose the best option below O No O Yes

Statistics
ProbabilityIn a sample of 900 U S adults 189 think that most celebrities are good role models Two U S adults are selected from this sample without replacement Complete parts a through c a Find the probability that both adults think most celebrities are good role models The probability that both adults think most celebrities are good role models is 0 044 Round to three decimal places as needed b Find the probability that neither adult thinks most celebrities are good role models The probability that neither adult thinks most celebrities are good role models is 0 624 Round to three decimal places as needed c Find the probability that at least one of the two adults thinks most celebrities are good role models The probability that at least one of the two adults thinks most celebrities are good role models is Round to three decimal places as needed

Statistics
ProbabilityIf np 25 and nq 25 estimate P fewer than 6 with n 13 and p 0 5 by using the normal distribution as an approximation to the binomial distribution if np 5 or nq 5 then state that the normal approximation is not suital Select the correct choice below and if necessary fill in the answer box to complete your choice OA P fewer than 6 Round to four decimal places as needed OB The normal approximation is not suitable

Statistics
ProbabilityIn a genetics experiment on peas one sample of offspring contained 444 green peas and 29 yellow peas Based o those results estimate the probability of getting an offspring pea that is green Is the result reasonably close to the value of that was expected 3 4 The probability of getting a green pea is approximately Type an integer or decimal rounded to three decimal places as needed Is this probability reasonably close to COC OA No it is not reasonably close OB Yes it is reasonably close 3 2 Choose the correct answer below

Statistics
ProbabilityLet event A subject is telling the truth and event B polygraph test indicates that the subject is lying Use your own words to translate the notation P BIA into a verbal statement Choose the correct option below OA The probability that the polygraph indicates lying given that the subject is actually lying OB The probability that the polygraph indicates truthfulness given that the subject is actually lying OC The probability that the polygraph indicates truthfulness given that the subject is actually telling the truth OD The probability that the polygraph indicates lying given that the subject is actually telling the truth

Statistics
ProbabilityMy courses My Media Event Land on pink Landing on pink and 3 Landing on a pink or yellow Landing on a yellow or an odd number Landing of blue and odd Use B for blue P for pink Y for yellow You can use words for or and and Use a space between letters and conjunctions A 11 11 Probability Enter as reduced fraction Probability Enter as reduced fraction

Statistics
ProbabilityThe amount of time adults spend watching television is closely monitored by firms because this helps to determine advertising pricing for commercials Complete parts a through d a Do you think the variable weekly time spent watching television would be normally distributed If not what shape would you expect the variable to have A The variable weekly time spent watching television is likely uniform not normally distributed B The variable weekly time spent watching television is likely symmetric but not normally distributed OC The variable weekly time spent watching television is likely normally distributed D The variable weekly time spent watching television is likely skewed right not normally distributed E The variable weekly time spent watching television is likely skewed left not normally distributed b According to a certain survey adults spend 2 45 hours per day watching television on a weekday Assume that the standard deviation for time spent watching television on a weekday is 1 93 hours If a random sample of 40 adults is obtained describe the sampling distribution of x the mean amount of time spent watching television on a weekday x is approximately normal with Hx 2 45 and ox 0 305160 Round to six decimal places as needed c Determine the probability that a random sample of 40 adults results in a mean time watching television on a weekday of between 2 and 3 hours The probability is 0 8941 Round to four decimal places as needed d One consequence of the popularity of the Internet is that it is thought to reduce television watching Suppose that a random sample of 35 individuals who consider themselves to be avid Internet users results in a mean time of 2 03 hours watching television on a weekday Determine the likelihood of obtaining a sample mean of 2 03 hours or less from a population whose mean is presumed to be 2 45 hours

Statistics
ProbabilityProbability The value of n is 5 Type an integer or a decimal Do not round ased on a survey assume that 46 of consumers are comfortable having drones deliver their purchases consumers are randomly selected exactly three of them are comfortable with delivery by drones Identify the values of n x p The value of x is 3 Type an integer or a decimal Do not round The value of pis Part integer or a decimal Do not round COLLE

Statistics
ProbabilityBased on a survey assume that 46 of consumers are comfortable having drones deliver their purchases Suppose that we want to find the probability that when five consumers are randomly selected exactly three of them are comfortable with delivery by drones Identify the values of n x p and q The value of n is 5 Type an integer or a decimal Do not round The value of x is Type an integer or a decimal Do not round

Statistics
Probability40 3 of consumers believe that cash will be obsolete in the next 20 years Assume that 6 consumers are randomly selected Find the probability that fewer than 3 a the selected consumers believe that cash will be obsolete in the next 20 years pints 0 of 1 The probability is Round to three decimal places as needed Save

Statistics
Probability39 596 of consumers believe that cash will be obsolete in the next 20 years Assume that 6 consumers are randomly selected Find the probability that fewer thar selected consumers believe that cash will be obsolete in the next 20 years The probability is Round to three decimal places as needed Qus HW Score 38 46 5 of 13 points O Points 0 of 1

Statistics
Probability7 Use the stem and leaf plot below to answer the following question Stem Leaves 2 3 4 5 6 3566 01 25 578 23334 Find the mean of the data Round the answer to the nearest tenth Mean

Statistics
ProbabilityThe acc mpanying table shows the numbers of male and female students in a particular country who received bachelor s degrees in business in a recent year Complete parts a and b below Click the icon to view the data on business degrees a Find the probability that a randomly selected student is male given that the student received a business degree The probability that a randomly selected student is male given that the student received a business degree is Round to three decimal places as needed Business Graduates Male Female Total Business degrees Nonbusiness degrees 187 599 613 528 173 574 864 512 361 173 1 478 040 Total 801 127 1 038 086 1 839 213 X K
Statistics
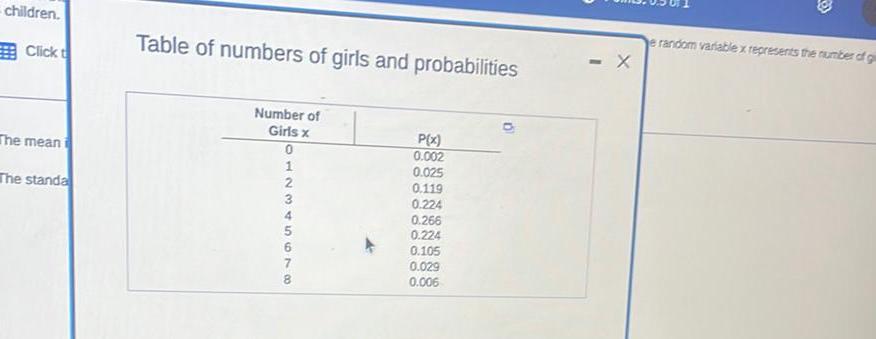
Probabilitychildren Click t The mean The standa Table of numbers of girls and probabilities Number of Girls x 0 12345678 P x 0 002 0 025 0 119 0 224 0 266 0 224 0 105 0 029 0 006 X e random variable x represents the number of g
Statistics
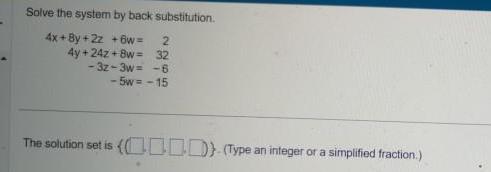
ProbabilitySolve the system by back substitution 4x By 2z 6w 2 4y 24z 8w 32 32 3w 6 5w 15 The solution set is 0 Type an integer or a simplified fraction

Statistics
Probabilityatch the histograms on the right to the summary statistics given I 11 IV a b c d Mean 60 65 60 60 Median 60 65 60 60 Standard Deviation 1 6 12 9 20 Frequency Frequency Frequency ncy 20 10 0 30 40 50 60 70 80 90 a 20 10 0 F 55 57 20 59 61 b 10 63 65 0 40 50 60 70 80 90 c Q 2 Q N O G O O

Statistics
ProbabilityThere is a 0 99968 probability that a randomly selected 22 year old female lives through the year An insurance company wants to offer her a one year policy with a death benefit of 1 000 000 How much should the company charge for this policy if it wants an expected return of 400 from all similar policies The company should charge Round to the nearest dollar

Statistics
ProbabilityIn a survey cell phone users were asked which ear they use to hear their cell phone and the table is based on their responses Determine whether a probably distribution is given It a probability distribution is given find its mean and standard deviation it a probability distribution is not givent identity the requirements that are not satisfiedk Find the mean of the random variable x Select the correct choice below and it necessary fill in the answer box to complete your choice OA Ha WITH Round to one decimal place as needed B The table does not show a probability distribution Find the standard deviation of the random variablex Select the correct choice below and it necessary fill in the answer box to complete your choice OA GE Round to one decimal place as needed OB The table does not show a probability distribution Leit Right No preference F 08 0 30 0 08