Probability Questions and Answers

Statistics
ProbabilityOn December 5th in Champlain MO the probability of snow is 28 the probability that the maximum temperature for the day will be above zero is 80 and the probability that it will both snow and be above zero is 60 What is the probability that it will snow OR the temperature will be above zero Show your work

Statistics
ProbabilityLease Terms Monthly fee Deposit Registration and Title Disposition fee Acquisition fee Cost What is the total cost of a 48 month lease with the terms 350 described in the table 450 300 2 500 300 A 15 500 B 24 750 C 14 400 D 18 000

Statistics
ProbabilityJames sees a truck at the dealership for 51 000 base price 1 300 premium interior 1 900 navigation touch screen and 2 400 smart traffic sensors If his current vehicle is worth 8 000 and he s offered a 80 trade in rate what is the total cost of the car after the 1 200 destination fee A 51 400 B 40 200 C 57 800 D 49 800

Statistics
ProbabilityReal Estate Tax Property Tax 1 5 Purchase Price 200 000 Market Value 250 000 A 30 000 B 3 000 C 3 750 D 37 500 How much money will the owner of the home shown in the table have to pay in property taxes per year

Statistics
Probability4 Pai rolls two dice then flips a coin then pulls a card out from a deck of cards What is the probability that she gets a odd number for the sum of the dice a heads for the coin flip and a spade from the deck of cards Note There are 4 suits in a deck of cards spades hearts clubs and diamonds

Statistics
Probability4 You buy two icecream cones one for you and one for your friend The probability that both both icecream cones are chocolate is 10 If you choose chocolate the probability that your friend also chooses chocolate is 20 What is the probability that you choose chocolate Show your work

Statistics
Probability5 Of the 102 customers at a restaurant 35 ate french fries and 55 ate hamburgers Of these customers 14 ate both Find the probability that a customer chosen at random ate french fries given that they ate a hamburger Show your work

Statistics
Probability6 You roll a dice 3 times What is the probability of rolling a 5 all three times Show your work

Statistics
ProbabilityThe function f x 4 x 2 6 X 2 has an inverse f x defined on the domain x2 6 Find the inverse function Provide your answer below

Statistics
ProbabilityScatter plot shows the nur cars or expe Vrite an approximate equation of the line of best fit for the data It doesn t have to be the exact line of best fit Using your equation from part a predict the amount charged per hour by a dog sitter with 18 years of experience that you can use the graphing tools to help you approximate the line Amount charged in dollars ner per hour 20 18 16 14 12 10 erience X and the amount charged per hour y for each of 23 dog sitters in Ne y 6 0 X 8 x X X X X xx X X y X X Years of experience X x 8 10 12 14 16 18 20 22 X X a Write an approximate equation of the line of best fit 0 b Using your equation from part a predict the amount charged per hour by a dog sitter with 18 years experience

Statistics
ProbabilityThe following frequency table summarizes a set of data What is the five number summary Value Frequency 7 2 8 3 10 2 11 1 13 2 14 2 1 2 16 17


Statistics
Probability3 Create the relative frequency of row table then make an observation about the frequencies Total Activity Male Jog Fly Kites 100 Female 1 27 100 Total 100 11 272 TO Picnic 15 27

Statistics
ProbabilityTER 7 17 Views on Capital Punishment In carrying out a study of views on capital punishment a student asked a question two ways 1 With persuasion My brother has been accused of murder and he is innocent If he is found guilty he might suffer capital punishment Now do you support or oppose capital punishment 2 Without persuasion Do you support or oppose capital punishment Here is a breakdown of her actual data Men For capital punishment Against capital punishment Women SURVEY SAMPLING AND INI For capital punishment Against capital punishment With persuasion 6 9 With persuasion 2 8 No persuasion 13 2 No persuasion 5 5 a What percentage of those persuaded against it support capital punishment b What percentage of those not persuaded against it support capital punishment c Compare the percentages in parts a and b Is this what you expected Explain 7 18 Views on Capital Punishment Use the data given in Exercise 7 17 Make the two given tables into one table by combining men for capital punishment into one group men opposing it into another women for it into one group and women opposing it into another Show your two way table The student who collected the data could have made the results misleading by trying persuasion more often on one gender than on the other but she did not do this She used persuasion on 10 of 20 women 50 and on 15 of 30 men 50 a What percentage of the men support capital punishment What per centage of the women support it b On the basis of these results if you were on trial for murder and did not want to suffer capital punishment would you want men or women on your jury

Statistics
Probabilitythan one bultet hole 7 20 Targets Bias or Lack of Precision Again a If a rifleman s gunsight is adjusted correctly but he has shaky arms the bullets might be scattered widely around the bull s eye target Draw a sketch of the target with the bullet holes Does this show variation lack of precision or bias Explain how you can tell from the widths of the graphs which has the largest sample n 40 and which has the smallest sample n 10 Jl ill amount Each dot in the dotplots represents the proportion of suc cess for one person For instance the dot in Figure A farthest to the right represents a person with an 80 success rate One dotplot rep TRY 7 33 What Is the Proportion of Seniors Example 5 resents an experiment in which each person had 10 trials another shows 20 trials and a third shows 40 trials population of college students is taking an advanced math clas the class are three juniors and two seniors Using numbers 1 3 to represent juniors and 4 and 5 to represent seniors sample out replacement Draw a sample of two people four times on each of parts a b c and d and then fill in the following table a Use the first line reprinted here from the random number table select your sample of two The selections are underlined 02779 72645 86009 B ooooooooooo CL 0 0 0 1 0 2 0 3 0 4 0 5 0 6 0 7 0 8 0 9 1 0 Sample Proportion 0000 7 28 ESP Again In the graph for Exercise 7 27 explain how you can tell from the shape of the graphs which has the largest sample size and which has the smallest sample size 7 29 Standard Error Which of the dotplots given in Exercise 7 27 has the largest standard error and which has the smallest stan dard error selecting any particular shape is 0 20 A card is selected randomly and a person is asked to guess which card has been chosen The graph below shows a computer simulation of experiments in which a person was asked to guess which card had been selected for a large number of trials If the person does not have ESP then his or her proportion of successes should be about 0 20 give or take some 7 30 Bias Assuming that the true proportion of success for the trials shown in the graph for Exercise 7 27 is 0 2 explain whether any of the graphs shows bias 7 31 Fair Coin One of the graphs shows the proportion of heads SECTION EXERCISES CHAPTER 7 7 32 Far from Fair Which of the graphs in Exercise 7 31 is centered farthest from 0 50 32699 Report the percentage of seniors in the sample Count the numb 4 s and 5 s and divide by the sample size 2 b Use the next line to select your sample of two 31867 85872 91430 45554 Report the percentage of seniors in the sample c Use the next line to select your sample of two 75298 75250 34546 07033 Report the percentage of seniors in the sample d Use the last line to select your sample of two 09541 80623 09084 98948 Report the percentage of seniors in the sample e Fill in the rest of the table below showing the results of the four samples Repetition 1 from part a 2 from part b 3 4 p Population Proportion of Seniors 2 5 0 4 p Sample Proportion of Seniors 1 2 0 5 Error p 0 5 0 4 7 34 Simulation From a very large essentially infinite popul of which half are men and half are women you take a random s

Statistics
ProbabilityI 4 Bartholomew is grocery shopping The probability that he buys chicken is 0 85 The probability that he buys beef is 0 52 The probability that he buys both is 0 42 What is the probability that he Duys chicken or beef

Statistics
ProbabilityA group of 262 students was polled to determine whether they exercise regularly engaging in moderate activity for 30 60 min 3 or more times per week Exercises Regularly No Yes Total 50 38 49 62 Female O 54 31 O 61 70 72 58 130 Gender Male 96 36 132 Total 168 If you choose a person from the survey at random what is the probability that the person is male 94 262

Statistics
ProbabilityWhich of the following is concerned with monitoring estimates of present performance and predictions of future performance O Construct validity Criterion validity O Content validity O Internal validity

Statistics
ProbabilityIn a box there are 8 red 7 blue and 6 green balls One ball is picked up randomly What is the probability that it is neither red nor green O 14 21 O 3 4 O 1 3 O 7 19

Statistics
Probabilityeducational backgrounds of the channel s viewers are different from the educational backgrounds of American adults ages 25 and over as a whole The executives have the following information on the American adult population as a whole obtained from a recent U S Current Population Survey Highest degree earned Less than high school High school College Higher than college Percent of population 8 The executives also obtained data from telephone surveys on highest degrees earned for a random sample of 150 American adults who are Thinking Channel viewers These data are summarized by the first row of numbers in the table below These numbers are the frequencies for the degree categories that were observed in the sample of 150 The second row of numbers gives the expected frequencies under the assumption that the distribution of highest degrees earned by Thinking Channel viewers is the same as the distribution of highest degrees earned by American adults as a whole The bottom row of numbers gives the following value for each of the degree categories fo SE Observed frequency Expected frequency Expected frequency fe Send data to Excel Observed frequency fo Part 1 Fill in the missing values in the table Round your responses for the expected frequencies to two or more decimal places Round your fo B responses to three or more decimal places Expected frequency JE 12 fo fe JE Less than high school 13 0 High school 25 27 0 10 College 101 82 50 55 4 148 a Determine the type of test statistic to use Higher than college 9 12 00 0 750 Total 150 Part 2 Answer the following to summarize the test of the hypothesis that the distribution of highest degrees earned by Thinking Channel viewers is the same as the distribution of highest degrees earned by American adults as a whole Use the 0 10 level of significance for the test X Type of test statistic Choose one b Find the value of the test statistic Round your answer to two or more decimal places 0 c Find the critical value Round your answer to two or more decimal places 0 d Can we conclude that the distribution of highest degrees earned by Thinking Channel viewers is different from the distribution of highest degrees earned by American adults as a whole As

Statistics
Probabilitywho support stricter gun control laws has been 52 A recent Gallup Poll of 1011 people showed 495 in favor of stricter gun control laws Assume the poll was given to a random sample of people Test the claim that the proportion of those favoring stricter gun control has changed Perform a hypothesis test using a significance level of 0 05 See page 405 for guidance Choose one of the following conclusions i The percentage is not significantly different from 52 A significant difference is one for which the p value is less than or equal to 0 050 The percentage is significantly different from 52

Statistics
Probability7 6 Heights of Basketball Team Suppose you find all the heights of the members of the men s basketball team at your school Could you use those data to make inferences about heights of all men at your school Why or why not

Statistics
ProbabilityToll Payment Method E Z Pass Cash Total Cars 527 935 1462 Trucks 316 683 999 Total 843 1618 2461 EZPass AND TICKETS 3 00 EZPass AND TICKETS 2 EZPass ONLY 11 EZPass AND TICKETS Based on the this data what is the probability that the first THREE vehicles passing through this toll station

Statistics
ProbabilityC Use comparative or superlative form of the adjectives A a daki c mleleri s fatlar n st nl k veya en st nl k halleriyle tamamlay n z 25P 1 Mount Everest is 2 My brother is the 3 Your father isn t 4 Her English is 5 August is the than Mount A ri high student in the class handsome than my father rich than her brother s good month of the year hot

Statistics
ProbabilityWhich of the following descriptive statistics can be used for ratio data choose one or more Variance Standard deviation Mode Mean

Statistics
ProbabilityBased on this correlation matrix which of the following statements is not accurate Number of Group Infant Birthweight in grams Visits Attended Fructosamine Number of Group Visits Attended Infant Birthweight in grams Fructosamine 1 0 83825039 0 843276728 1 0 67319823 1 As more group visits are attended fructosamine levels increase As fructosamine levels increase birthweight increases As more group visits are attended infant birthweight decreases

Statistics
ProbabilityWhich of the following correlations would be interpreted as a moderate relationship O 45 0 3


Statistics
ProbabilityCalculate a correlation matrix for the following data Which two variables have a strong positive relationship Number of Group Visits Fructosamine Attended 152 173 174 175 176 183 188 192 202 205 210 215 220 258 6 LO 5 4 4 3 2 3 3 2 2 1 Infant Birthweight in grams 2 2 1 160 3175 3225 3350 3400 3530 3540 3525 3650 3600 3550 3950 3325 4500 4800 Infant birthweight and number of group visits attended Number of group visits attended and fructosamine O Infant birthweight and fructosamine

Statistics
ProbabilityA certain big company classifies its employees according to gender age group 6 categories and employment type 10 categories How many classifications are there Select one O a 120 O b 40 O c 30 d 60

Statistics
ProbabilityIn a professional division of a Hockey league there are 9 total teams How many different rankings are possible at the end of the year Hint there are no ties Select one O a 181 440 O b 40 320 O c 362 880 d 3 628 750

Statistics
ProbabilityAn experiment is conducted with numbers Let S be the sample space of experiment S 1 2 3 4 5 6 7 8 9 10 11 12 with events E 1 2 3 4 5 6 F 5 6 7 8 9 G 7 8 9 10 11 12 H 2 3 4 Assume each outcome is equally likely On your paper list the outcomes in F and G F and G are P F or G 4

Statistics
ProbabilityAt a Phil s Cafe a dinner meal is made up of an appetizer a main course a dessert and a drink The choices for the appetizer are soup or salad for the main course are chicken fish steak or lobster for the dessert are ice cream pie sorbet or a pastry the drinks are coffee tea or milk How many different dinner meals are possible Select one O a 96 O b 52 OC 48 O d 16

Statistics
ProbabilityIn an economics class with 30 students the teacher wants 2 different students to answer problems 4 and 9 in front of the class In how many ways can the teacher pick students for the problems Select one O a 435 O b 560 O c 870 O d 660

Statistics
ProbabilityWith the toss of a coin what is the probabilty of getting tails Select one O a 1 2 O b 1 OC 0 O d 2

Statistics
ProbabilityA knitting club has 14 members It has to send a team of 5 knitters to a knitting competition in the neighboring town Find the number of different knitting teams that can be sent Select one O a 240 240 O b 4 004 OC 2 200 d 2 002

Statistics
ProbabilityTime left If there are 5 finalists at a singing competition in how many ways can they be ordered if they each take turns singing Select one a 60 b 120 OC 30 O d 40

Statistics
ProbabilityAs a professional golfer you decide to experiment with two different golf balls Nike and Callaway After the experiment you will make a contract with one of the manufacturers and use their golf ball for the next year The experiment consists of using the driver and hitting 200 golf balls of each type and measuring the distance traveled in yards Your decision of which golf ball to use will be based upon consistency and maximal distance both of which is valued in the game of golf The box and whisker plot for each manufacturer is shown below Nike Callaway 225 220 230 240 245 250 255 5 V 252 250 260 266 268 5 270 280 280 287 290 Yards Based on these boxplots which golf balls would you use and why 300 A 305 310 2

Statistics
ProbabilityYou draw a card from a deck Find the probability round to 4 decimal places Drawing a face card Jack Queen King

Statistics
ProbabilityAn instructor recommends to students in his introductory statistics class to spend at least 5 hours studying outside class One of the items on the student survey for this course was How many hours a week do you study for this class The instructor examined the data for men and women separately Below is the distribution of this variable for the 30 women in the class that 32CX 1 2 3 4 5 6 7 8 9 10 HOURS OF STUDY Part C Which of the following boxplots represents the same data set as the histogram shown above 2 3 Boxplot A HOURS OF STUDY 8 9 10 A B C

Statistics
ProbabilityFrequency 10 8 6 2 0 H 3 160 160 170 170 180 180 190 190 200 200 210 210 220 Mean yolk mass g 16 Based on the frequency distribution does a normal probability distribution reasonably model the mean yolk mass of eggs in past breeding seasons 220 17 Explain your answer to the previous question Be sure to discuss the assumptions of a normal probability distribution and why based on the frequency distribution those assumptions soom appropriate for not for modeling the mean volle mass

Statistics
Probability14 The following data was collected at the local clinic Vaccinated Vaccinated Unvaccinated and not boosted 56 and boosted 30 Positive for COVID Negative for COVID If one patient is selected find the probability that they are a vaccinated and boosted and are positive b vaccinated and boosted or are negative c unvaccinated given that they are positive 67 56 129 28

Statistics
ProbabilityAt one high school girls can run the 100 yard dash in an average of 15 2 seconds with a standard deviation of 0 9 second The times are very closely approximated by a normal curve Find the percent of times that are 18 Between 14 3 and 16 1 seconds A 47 5 B 50 C 68 D 34

Statistics
ProbabilityAssume a Poisson distribution Find the following probabilities a Let 6 0 find P X 2 b Let 0 6 find P X 1 c Let 6 0 find P X 3 d Let 4 4 find P X 1 e Let 5 3 find P X 3 a When 6 0 P X 2 Round to three decimal places as needed

Statistics
ProbabilityGiven the probability distributions shown to the right complete the following parts a Compute the expected value for each distribution b Compute the standard deviation for each distribution c What is the probability that x will be at least 3 in Distribution A and Distribution B d Compare the results of distributions A and B a What is the expected value for distribution A P Type an integer or decimal rounded to three decimal places as needed Xi 01234 Distribution A P X x 0 54 0 20 0 14 0 10 0 02 XOTN34 X 0 1 2 Distribution B P X X 0 02 0 10 0 14 0 20 0 54

Statistics
Probabilitystudent is taking a multiple choice exam in which each question has two choices Assuming that she has no knowledge of the correct answers to any of the questions she has decided on trategy in which she will place two balls marked A and B into a box She randomly selects one ball for each question and replaces the ball in the box The marking on the ball will determine nswer to the question There are six multiple choice questions on the exam Complete parts a through d below a What is the probability that she will get six questions correct Round to four decimal places as needed
Statistics
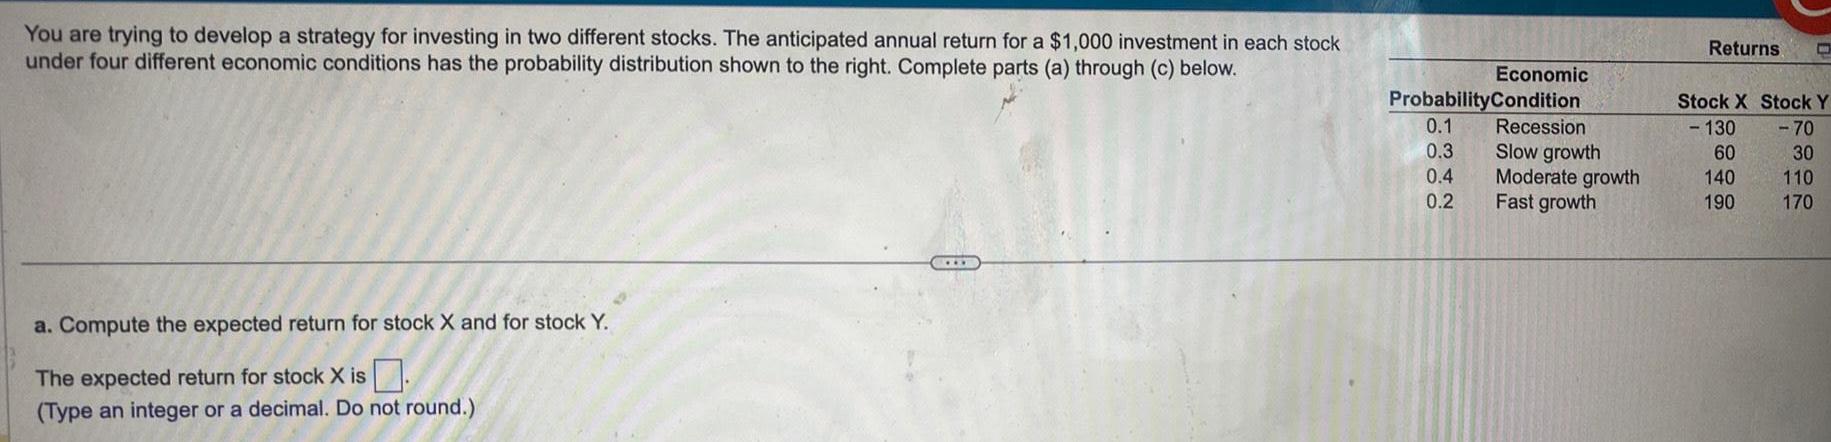
ProbabilityYou are trying to develop a strategy for investing in two different stocks The anticipated annual return for a 1 000 investment in each stock under four different economic conditions has the probability distribution shown to the right Complete parts a through c below a Compute the expected return for stock X and for stock Y The expected return for stock X is Type an integer or a decimal Do not round Economic Probability Condition 0 1 Recession 0 3 Slow growth 0 4 Moderate growth 0 2 Fast growth Returns C Stock X Stock Y 130 70 60 30 140 110 190 170
Statistics
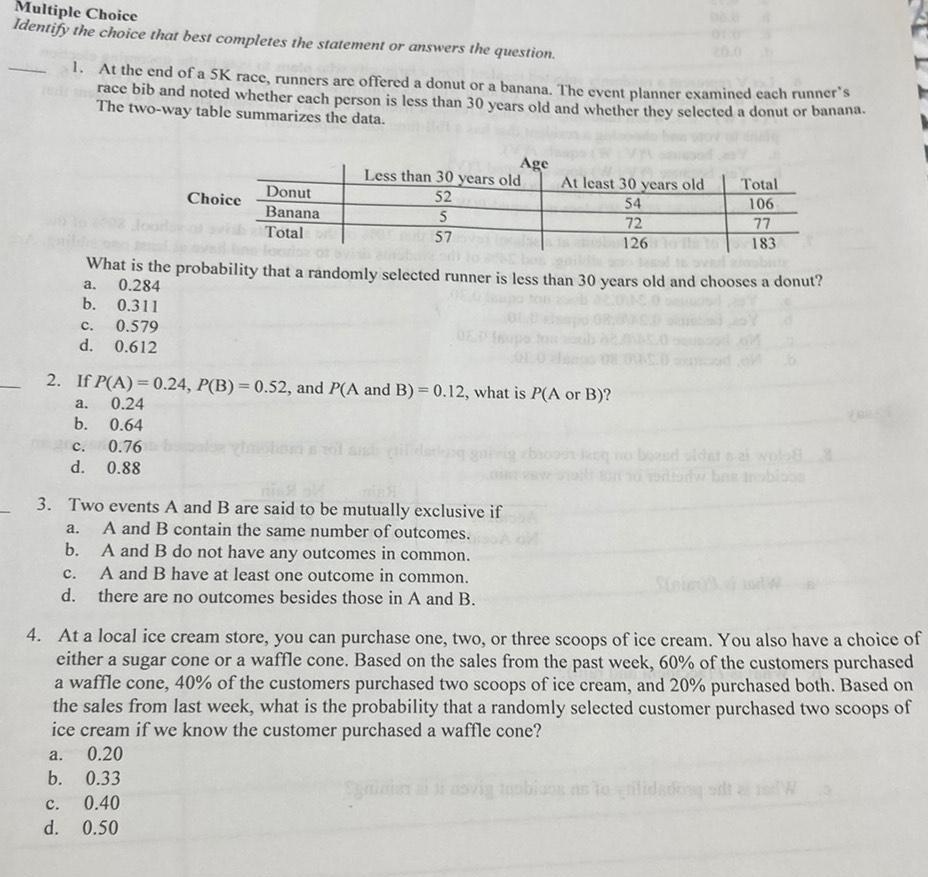
ProbabilityMultiple Choice Identify the choice that best completes the statement or answers the question 1 At the end of a 5K race runners are offered a donut or a banana The event planner examined each runner s race bib and noted whether each person is less than 30 years old and whether they selected a donut or banana The two way table summarizes the data 0 311 C 0 579 d 0 612 a Choice b Donut Banana Total 2 If P A 0 24 P B 0 52 and P A and B 0 12 what is P A or B a 0 24 b 0 64 c 0 76 d 0 88 Age Less than 30 years old At least 30 years old 52 54 5 57 3 Two events A and B are said to be mutually exclusive if A and B contain the same number of outcomes What is the probability that a randomly selected runner is less than 30 years old and chooses a donut a 0 284 b A and B do not have any outcomes in common C A and B have at least one outcome in common d there are no outcomes besides those in A and B C 0 40 d 0 50 72 126 Total 106 77 183 4 At a local ice cream store you can purchase one two or three scoops of ice cream You also have a choice of either a sugar cone or a waffle cone Based on the sales from the past week 60 of the customers purchased a waffle cone 40 of the customers purchased two scoops of ice cream and 20 purchased both Based on the sales from last week what is the probability that a randomly selected customer purchased two scoops of ice cream if we know the customer purchased a waffle cone a 0 20 b 0 33
Statistics
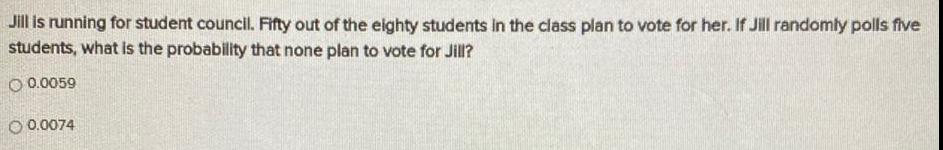
ProbabilityJill is running for student council Fifty out of the eighty students in the class plan to vote for her If Jill randomly polls five students what is the probability that none plan to vote for Jill O 0 0059 O 0 0074