Probability Questions and Answers

Statistics
ProbabilityA binomial experiment with probability of success p 0 5 and n 7 trials is conducted What is the probability that the experiment results in exactly 1 success Do not round your intermediate computations and round your answer to three decimal places If necessary consult a list of formulas
Statistics
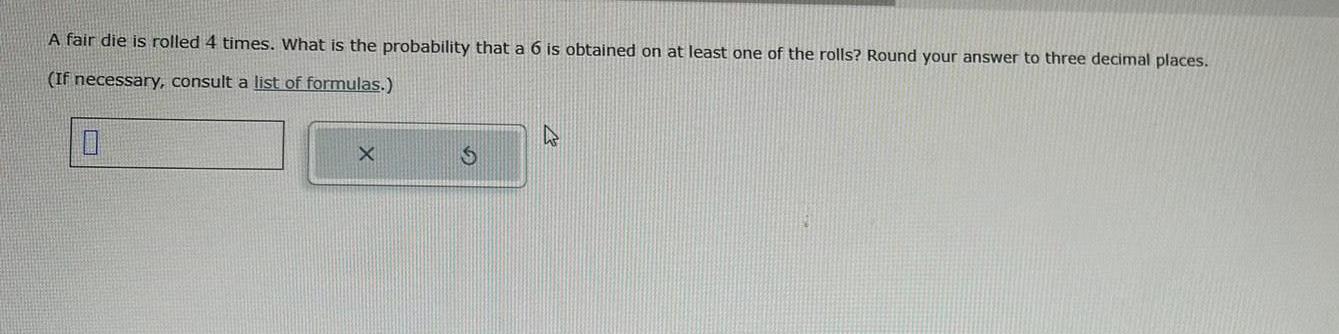
ProbabilityA fair die is rolled 4 times What is the probability that a 6 is obtained on at least one of the rolls Round your answer to three decimal places If necessary consult a list of formulas 0 X S h

Statistics
ProbabilityA binomial pro probability of x successes in the n independent trials of the experiment n 9 p 0 4 x 3 The probability of x 3 successes is Round to four decimal places as neede

Statistics
Probabilityrobability distribution to the of hits a baseball player obtained in a game over the course of a Complete parts a through f below 012345 an integer or a decimal Do not round at is the probability that in a randomly selected game the player got more than

Statistics
Probabilityprobabilit right number of hits a baseball player obtained in a game over the course of a season Complete parts a through f below O A 0 4 0 3 0 2 0 1 O B 0 4 0 31 0 2 0 1 0 O C Probability 0 4 0 3 0 2 0 1 0 O D Probability 0 4 321 0 3 0 2 0 1 0 2 3 4 5 0 168 0 335 0 284 0 148 0 038 0 024

Statistics
ProbabilityToday the waves are crashing onto the beach every 5 4 seconds The times from when a person arrives at the shoreline until a crashing wave is observed follows a Uniform distribution from 0 to 5 4 seconds Round to 4 decimal places where possible a The mean of this distribution is 2 7 08 b The standard deviation is 1 5588 OF c The probability that wave will crash onto the beach exactly 0 9 seconds after the person arrives is P x 0 9 0 0000 d The probability that the wave will crash onto the beach between 1 8 and 2 7 seconds after the person arrives is P 1 8 x 2 7 e The probability that it will take longer than 1 98 seconds for the wave to crash onto the beach after the person arrives is P x 1 98 f Find the maximum for the lower quartile seconds

Statistics
ProbabilityThe age of children in kindergarten on the first day of school is uniformly distributed between 4 97 and 5 77 years old A first time kindergarten child is selected at random Round answers to 4 decimal places if possible a The mean of this distribution is 5 37 b The standard deviation is c The probability that the the child will be older than 5 years old d The probability that the child will be between 5 07 and 5 27 years old is e If such a child is at the 88th percentile how old is that child years old

Statistics
ProbabilityBus wait times are uniformly distributed between 6 minutes and 22 minutes The unshaded rectangle below with area 1 depicts this The shaded rectangle depicts the probability that a randomly selected bus wait time will be between 9 and 16 minutes Give answers to the following questions in fraction form 5 6 7 8 9 10 11 12 13 14 15 16 17 18 19 20 21 22 The base of the shaded rectangle is The height of the rectangle is

Statistics
Probabilityccording to flightstats com American Airlines flights from Dallas to Chicago are on time me time Suppose 24 flights are randomly selected and the number of on time flights is a Explain why this is a binomial experiment Determine the values of n and p Find and interpret the probability that exactly 16 flights are on time d Find and interpret the probability that fewer than 16 flights are on time e Find and interpret the probability that at least 16 flights are on time Find and interpret the probability that between 14 and 16 flights inclusive are on tim
Statistics
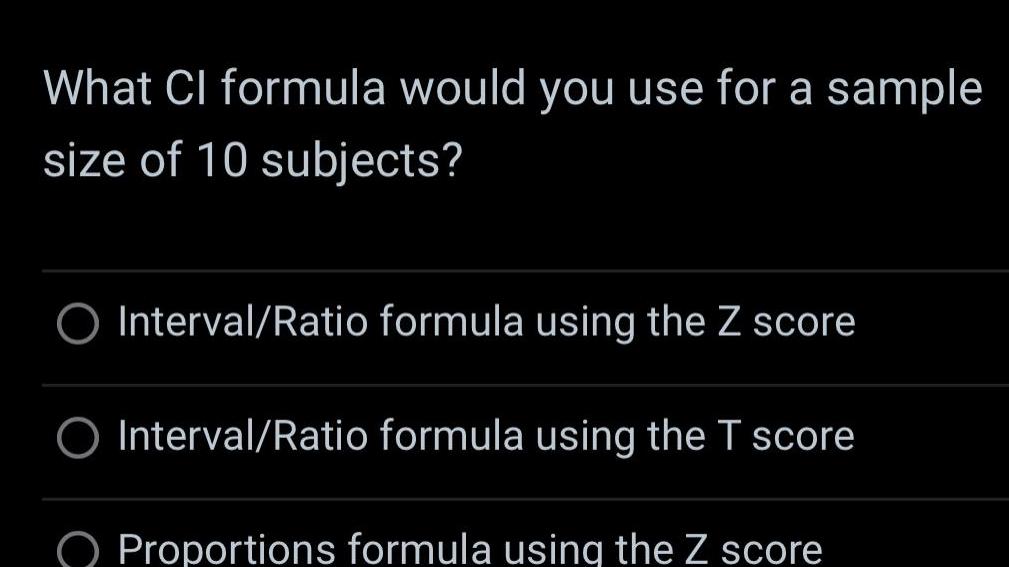
ProbabilityWhat Cl formula would you use for a sample size of 10 subjects O Interval Ratio formula using the Z score O Interval Ratio formula using the T score Proportions formula using the Z score

Statistics
Probabilityoor Complete parts a through c For 250 randomly selected adults compute the mean and standard deviation of the able X the number of adults who believe that the overall state of moral values is po e mean of X is Round to the nearest whole number as needed

Statistics
Probabilityold female for 280 According to the National Vital Statistics Report 58 21 the ity that the female survives the year is 0 999544 Compute and interpret the exp this policy to the insurance company pected value is to the nearest cent as needed

Statistics
Probabilitystrong the investment will result in a profit of 30 000 If the economy e pace the investment will result in a profit of 20 000 However if the ssion the investment will result in a loss of 30 000 You contact an e there is a 30 probability the economy will remain strong a 60 prob will grow at a moderate pace and a 10 probability the economy wil n What is the expected profit from this investment ected profit is Type an integer or a decimal

Statistics
Probabilitygraph of the discrete bability to the right resents the number of births by a mother 46 51 years old who had a birth in 2015 mplete parts a ough d below Probability 0 30 0 25 0 20 0 15 0 10 0 05 0 00 0 0 235 0 275 0165 0 113 0 099 0024 0 033 3 4 5 6 Number of Live Births 7 0 056 8 113 Type an integer or a decimal What is the probability that a randomly selected 46 to 51 year old mother who had 2015 has had her fourth or fifth live birth in that year Type an integer or a decimal

Statistics
ProbabilityChoose the correct answer below OA A random variable is a numerical measure having either a finite or countal of values of the outcome of a probability experiment OB A random variable is a numerical measure of the outcome of a probability OC A random variable is a numerical measure having values that can be plott an uninterrupted fashion of the outcome of a probability experiment

Statistics
Probabilityt of a 6th to 8th grade student is involved in Complete parts a through f below to 0 376 t 0 0 092 X P x 2 3 4 D 0 191 0 098 0 243 C rify that this is a discrete probability distribution a discrete probability distribution because the sum of the probabilities is Dility is and

Statistics
ProbabilityChoose the correct answer below Select all that apply A 0 P x 1 B P x 0 C 0 P x 1 D P x 1

Statistics
ProbabilityThe human resource department at a certain company wants to conduct a survey regarding worker benefits The department has an alphabetical list of all 5154 employees at the company and wants to conduct a systematic sample of size 50 a What is k k 103 b Determine the individuals who will be administered the survey Randomly select a number from 1 to k Suppose that we randomly select 7 Starting with the first individual selected the individuals in the survey will be 0

Statistics
ProbabilityA club wants to sponsor a panel discussion on an upcoming election The club wants to have four of its members lead the panel discussion To be fair however the panel should consist of two members of each party Below is a list of members in each party Obtain a stratified sample of two people from party 1 and two from party 2 Bolden Carter Haydra Lukens Party 1 Nolan Pawlak Tate Wright Cooper Engler Keating May Party 2 Ochs Rice Thomas Weber Which of the following is a possible list of club members to lead the panel discussion O A Bolden Carter Pawlak Nolan B Bolden Carter Weber May OC Bolden Carter Pawlak Weber OD Weber May Rice Thomas OE Weber May Rice Bolden

Statistics
Probability6 Suppose the length of time in hours between emergency arrivals at a certain hospital is modeled as an exponential distribution with 4 a What is the probability that more than 5 hours pass without an emergency arrival b Find P 1 X 3 c Find a approximately such that P X a 0 19691168
Statistics
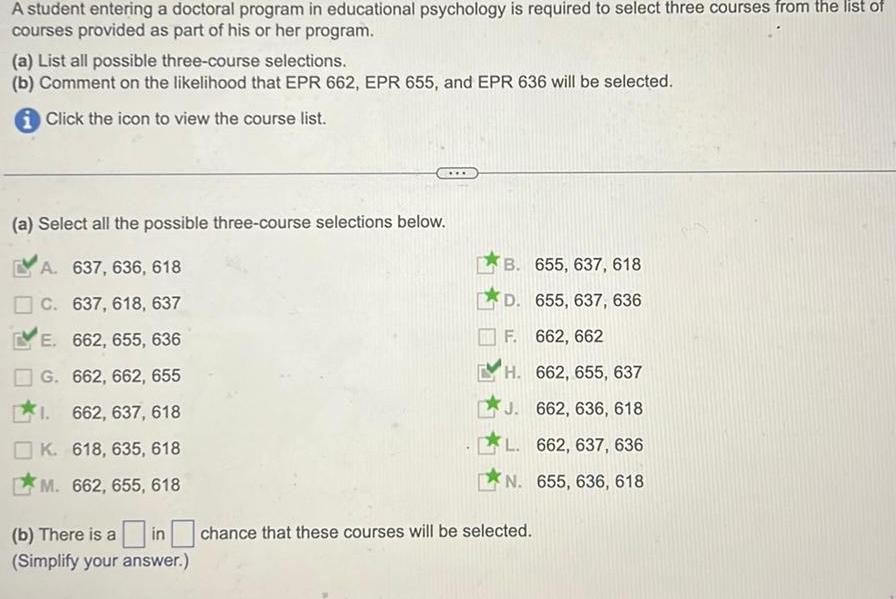
ProbabilityA student entering a doctoral program in educational psychology is required to select three courses from the list of courses provided as part of his or her program a List all possible three course selections b Comment on the likelihood that EPR 662 EPR 655 and EPR 636 will be selected iClick the icon to view the course list a Select all the possible three course selections below A 637 636 618 C 637 618 637 E 662 655 636 G 662 662 655 1 662 637 618 K 618 635 618 M 662 655 618 b There is a in Simplify your answer B 655 637 618 D 655 637 636 F 662 662 H 662 655 637 J 662 636 618 L 662 637 636 N 655 636 618 chance that these courses will be selected

Statistics
ProbabilityIncome Brackets The following diagram shows the movement of households in a certain country among three income groups affluent middle class and poor over the 11 year period 1980 1991 72 000 in 1994 dollars 24 000 in 1994 dollars AFFLUENT 27 9 MIDDLE CLASS 30 8 POOR 7 3 8 i a Use the transitions shown in the diagram to construct a transition matrix assuming zero probabilities for the transitions between affluent and poor Let 1 affluent 2 middle class and 3 poor 0 721 0 279 0 0 847 0 08 0 073 0 0 308 0 692 b Assuming that the trend shown was to continue what percent of households classified as affluent in 1980 were predicted to become poor in 2002 Give your answer to the nearest 0 1 22 3 04 c According to the model what percentage of all households will be in each income bracket in the long term Give your answer to the nearest 0 1 affluent 172

Statistics
ProbabilityFor the decision tree below state which decision should be made Pay attention to the minus signs The probabilities are given in brackets Decision 1 Decision 2 Decision 3 Decision 4 favourable 5 unfavourable 5 favourable 6 unfavourable 4 favourable 5 unfavourable5 favourable 5 untavourable 5 6 500 7 300 8 800 9 1000 105 400 115 600 124 1000 135 500

Statistics
Probability5 Assume that z scores are normally distributed with a mean of 0 and a standard deviation of 1 a If P 0 z a 0 3907 find a b If P b z b 0 8664 find b c If P Z c 0 0643 find c d If P z d 0 9922 find d e If P Z e 0 4500 find e f If P f z 1 59164 0 86889 find h

Statistics
Probability1 Inability to get along with others is the reason cited in 17 of worker firings based on data from Robert Half International Inc Concerned about her company s working conditions the personnel manager at the Boston Finance Company plans to investigate the five employee firings that occurred over the past year a Assuming that the p 17 rate applies find the probability that among those five employees n 5 the number fired because of an inability to get along with others is at least four P X 4 b If the personnel manager actually does find that at least four of the firings are due to an inability to get along with others does this company appear to be very different from other typical companies Answer YES NO Why or why not

Statistics
Probability2 Currently an average of 7 residents of the village of Westport population 760 die each year based on data from the National Center for Health Statistics a Find the mean number of deaths per day Answer b Find the probability that on a given day there are no deaths c Find the probability that on a given day there is one death d Find the probability that on a given day there is more than one death e Based on the preceding results should Westport have a contingency plan to handle Why or more than one death per day YES why not NO

Statistics
ProbabilityAssume that human body temperatures are normally distributed with a mean of 98 21 F and a standard deviation of 0 64 F a A hospital uses 100 6 F as the lowest temperature considered to be a fever What percentage of normal and healthy persons would be considered to have a fever Does this percentage suggest that a cutoff of 100 6 F is appropriate b Physicians want to select a minimum temperature for requiring further medical tests What should that temperature be if we want only 5 0 of healthy people to exceed it Such a result is a false positive meaning that the test result is positive but the subject is r really sick Click to view page 1 of the table Click to view page 2 of the table a The percentage of normal and healthy persons considered to have a fever is 0 01 Round to two decimal places as needed Does this percentage suggest that a cutoff of 100 6 F is appropriate A No because there is a small probability that a normal and healthy person would be considered to have a fever OB No because there is a large probability that a normal and healthy person would be considered to have a fever OC Yes because there is a large probability that a normal and healthy person would be considered to have a fever D Yes because there is a small probability that a normal and healthy person would be considered to have a fever b The minimum temperature for requiring further medical tests should be F if we want only 5 0 of healthy people to exceed it Round to two decimal places as needed SXXCE

Statistics
ProbabilityFill in the blank with the appropriate choice As the sample size not the numbe rof sample statistics increases the sampling distribution for the sample statistic becomes wider does not change becomes narrower

Statistics
ProbabilityIdentity which of these types of sampling is used random systematic convenience stratified or cluster A large company wants to administer a satisfaction survey to its current customers Using their customer database the company randomly selects 50 customers and asks them about their level of satisfaction with the company What type of sampling is used O Systematic O Stratified O Convenience O Cluster Random

Statistics
ProbabilityAn investment counselor calls with a hot stock tip He believes that if the economy remains strong the investment will result in a profit of 50 000 If the economy grows at a moderate pace the investment will result in a profit of 10 000 However if the economy goes into recession the investment will result in a loss of 50 000 You contact an economist who believes there is a 20 probability the economy will remain strong a 70 probability the economy will grow at a moderate pace and a 10 probability the economy will slip int recession What is the expected profit from this investment The expected profit is Type an integer or a decimal

Statistics
ProbabilityAccording to a study 81 of K 12 schools or districts in a country use digital content such as ebooks audio books and digital textbooks Of these 81 6 out of 10 use digital content as part of their curriculum Find the probability that a randomly selected school or district uses digital content and uses it as part of their curriculum

Statistics
ProbabilityIn a particular survey of internet users 3745 respondents say that they use social networking sites and 1434 respondents say that they do not use social networking sites What is the probability that a randomly selected person uses a social networking site Does that result suggest that it is likely with a probability of 0 5 or greater for someone to use social networking sites The probability that a randomly selected person uses a social networking site is Round to three decimal places as needed G

Statistics
ProbabilityChoose the correct answer below OA A sample of size n from a population of size N is obtained through simple random sampling if every possible sample of size n has an equally likely chance of occurring The sample is then called a simple random sample O B Simple random sampling is the process of selecting individuals from a population using a convenient sample The sample is then called a simple random sample OC Simple random sampling is the process of obtaining a sample of size n from a population of the same size n The sample is then called a simple random sample O D Simple random sampling is the process of using chance to select individuals from a population to be included in the sample The sample is then called a simple random sample

Statistics
ProbabilityHere are 6 celebrities with some of the highest net worths in millions of dollars in a recent year George Lucas 5500 Oprah Winfrey 3200 Michael Jordan 1700 J K Rowling 1000 David Copperfield 1000 and Jerry Seinfeld 950 Find the range variance and standard deviation for the sample data What do the results tell us about the population of all celebrities Based on the nature of the amounts what can be inferred about their precision The range is 4550 million Round to the nearest integer as needed The variance is 3315750 million dollars squared Round to the nearest integer as needed The standard deviation is 1821 million Round to the nearest integer as needed What do the results tell us about the population of all celebrities A Because the data are from celebrities with the highest net worths the measures of variation are not at all typical for all celebrities OB Because the statistics are calculated from the data the measures of variation cannot tell us about other celebrities OC Because the statistics are calculated from the data the measures of variation are typical for all celebrities D Because the data are from celebrities with the highest net worths the measures of variation are typical for all celebrities Based on the nature of the amounts what can be inferred about their precision Because all of the amounts end with 0 it appears that they are rounded to the nearest hundred thousand dollars GEEEE so it would make sense to round the results to the nearest hundred million dollars million dollars 4 e

Statistics
ProbabilityThe lengths of your statistics class has a continuous uniform distribution between 46 minutes and 58 minutes Let X be the length of a class in minutes If one section is randomly selected answer the following questions a What is the distribution of X X Please show the following answers to 4 decimal places b What is the probability that the class is exactly 52 minutes long c What is the probability that the class is more than 52 minutes long d What is the probability that the class is between 49 minutes and 53 minutes long e What is the probability that the class is less than 49 minutes or more than 53 minutes long

Statistics
ProbabilityA web page design firm has two designs for an online hardware store To determine which is the more effective design the firm uses one page with only teenage visitors and a second page with only adult visitors For each visit the firm records the visitor s rating on the layout and the number of items viewed Complete parts a through c below b What are the two response variables For each response variable state whether it is qualitative or quantitative Select all that apply A One response variable is the number of items viewed This response variable is quantitative B One response variable is the web page design This response variable is qualitative C One response variable is the visitor s rating on the layout This response variable is qualitative D One response variable is the age group This response variable is qualitative c Explain how confounding might be an issue with this study Choose the correct answer below OA Since the variables are not all quantitative or all qualitative they may interact causing the results to be misleading or incorrect OB Since there is only one explanatory variable and two response variables the explanatory variable will not affect both response variables equally resulting in misleading results OC Since there are two response variables in this study they may interact causing the results to be misleading or incorrect O D Since the designs are being tested with two different age groups preferences depending on the age group may groups

Statistics
Probability64 of all violent felons in the prison system are repeat offenders If 42 violent felons are randomly selected find the probability that a Exactly 27 of them are repeat offenders b At most 29 of them are repeat offenders c At least 28 of them are repeat offenders d Between 22 and 29 including 22 and 29 of them are repeat offenders Round all answers to 4 decimal places

Statistics
Probabilityetermine whether the scatter diagram indicates mat a linear relation may exist between the two ariables If the relation is linear determine hether it indicates a positive or negative ssociation between the variables Ise this information to answer the following o the two variables have a linear relationship OA The data points have a linear relationship because they lie mainly in a straight line OC The data points do not have a linear relationship because they do not lie mainly in a straight line Response 30 20 10 OB 0 8 20 Explanatory the two variables have a positive or a negative association 8 40 The data points do not have a linear relationship because they lie mainly straight line OD The data points have a linear relationship because they do not lie mainly in a straight line

Statistics
ProbabilityLet the random variable T represent the time it takes for a randomly selected runner to complete a 100 meter dash T

Statistics
ProbabilitySuppose that events E and F are independent P E 0 3 and P F 0 8 What is the P E and F The probability P E and F is Type an integer or a decimal

Statistics
ProbabilityJohn Roberto Marco and Clarice work for a publishing company The company wants to send two employees to a statistics conference To be fair the company decides that the two individuals who get to attend will have their names randomly drawn from a hat a Determine the sample space of the experiment That is list all possible simple random samples of size n 2 b What is the probability that John and Roberto attend the conference c What is the probability that Roberto attends the conference d What is the probability that Clarice stays home a Choose the correct answer below Note that each person is represented by the first letter in their name OA JR JM JC OB JR JM JC RM RC MC OC JR JM JC RM RC MC JJ RR MM CC D JR JM JC RM RC MC RJ MJ CJ MR CR CM


Statistics
ProbabilityA police officer randomly selected 577 police records of larceny thefts The accompanying data represent the number of offenses for various types of larceny thefts a Construct a probability model for type of larceny theft b Are purse snatching larcenies unusual c Are shoplifting larcenies unusual Type of Larceny Theft Pocket picking Purse snatching Shoplifting From motor vehicles Motor vehicle accessories Bicycles From buildings From coin operated machines Complete table Type of Larceny Theft Pocket picking Purse snatching Shoplifting From motor vehicles Motor vehicle accessories Bicycles From buildings Number of Offenses 8 9 123 210 83 37 97 10 Also do Coin Operating Machines Round three decimal places as needed Probability

Statistics
ProbabilityE and F are not disjoint events then P E or F E and F are not disjoint events then P E or F P E P F P B P E P F P E P F P


Statistics
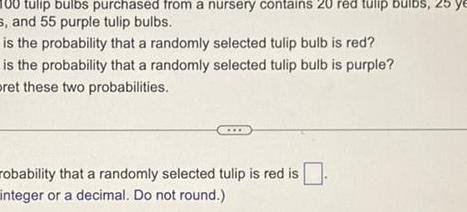
Probabilityg of 100 tulip bulbs purchased from a nursery contains 20 red tulip bulbs 25 yellow bulbs and 55 purple tulip bulbs What is the probability that a randomly selected tulip bulb is red What is the probability that a randomly selected tulip bulb is purple Interpret these two probabilities piling ng iwwe in prip be an integer or a decimal Do not round Select the correct choice below and fill in the answer boxes within your choice pe whole numbers A If 100 tulip bulbs were sampled with replacement one would expect about bulbs to be red and about of the bulbs to be purple B If 100 tulip bulbs were sampled with replacement one would expect exactly bulbs to be red and exactly of the bulbs to be purple of th of t

Statistics
Probabilityis the probability that a randomly selected family has an income greater than is the probability that a randomly selected family has an income greater than 5 Type an integer or a decimal
Statistics
Probability00 tulip bulbs purchased from a nursery contains 20 red tulip bulbs 25 ye s and 55 purple tulip bulbs is the probability that a randomly selected tulip bulb is red is the probability that a randomly selected tulip bulb is purple pret these two probabilities robability that a randomly selected tulip is red is integer or a decimal Do not round
Statistics
ProbabilityWhy is the following not a probability model Click the icon to view the data table etermine why it is not a probability model Choose the correct answer below OA This is not a probability model because the sum of the probabilities is not OB This is not a probability model because at least one probability is less thar OC This is not a probability model because at least one probability is greater t OD This is not a probability model because at least one probability is greater t

Statistics
Probabilityccording to a survey the probability that a randomly selected worker primarily drives a van te ork is 0 873 The probability that a randomly selected worker primarily takes public ansportation to work is 0 048 Complete parts a through d ype an integer or decimal rounded to three decimal places as needed d Can the probability that a randomly selected worker primarily walks to work equal 0 15 W r why not A No The probability a worker primarily drives walks or takes public transportation wou be less than 1 OB Yes The probability a worker primarily drives walks or takes public transportation wou equal 1 OC No The probability a worker primarily drives walks or takes public transportation woul be greater than 1 OD Yes If a worker did not primarily drive or take public transportation the only other