Probability Questions and Answers

Statistics
ProbabilityFind the probability P EC if P E 0 41 The probability P E is Simplify your answer

Statistics
ProbabilityThe following table of values gives a company s annual profits in millions of dollars Rescale the data so that the year 2003 corresponds to x 0 Year 2003 2004 2005 2006 2007 2008 Profits in millions of dollars 31 3 32 7 31 8 33 7 35 9 36 1 Find the R2 value for the exponential regression model 0 8766 0 6868 0 7867 0 8667 0 8676 None of the above

Statistics
Probabilityose Dan loses 42 of all chess games What is the probability that Dan loses two chess games in a row What is the probability that Dan loses four chess games in a row When events are independent their complements are independent as well Use th mine the probability that Dan loses four chess games in a row but does not lose www the probability that Dan loses two chess games in a row is and to four decimal places as needed he probability that Dan loses four chess games in a row is and to four decimal places as needed he probability that Dan loses four chess games in a row but does not lose five in and to four decimal places as needed

Statistics
ProbabilityClarice Marco and John work for a publishing company The company wants to send two employees to a statistics conference To be fair the company decides that the two individuals who get to attend will have their names randomly drawn from a hat a Determine the sample space of the experiment That is list all possible simple random samples of size n 2 b What is the probability that Clarice and Marco attend the conference c What is the probability that John attends the conference d What is the probability that Marco stays home

Statistics
ProbabilityCompute the probability of randomly selecting a club or spade Compute the probability of randomly selecting a club or spade Compute the probability of randomly selecting an ace or diamo club or spade e an integer or a decimal rounded to three decimal places as n club or spade or diamond an integer or a decimal rounded to three decimal places as n ace or diamond an integer or a decimal rounded to three decimal places as n

Statistics
Probability3 balls and 8 type C balls find the probability that the golf ball is not a typ he probability that the golf ball is not a type A ball is Type an integer or decimal rounded to three decimal places as needed

Statistics
Probabilityon 42 8 of 3 year olds are E What is the probability that a randomly selected 3 year old is enrolled in day ca probability that a randomly selected 3 year old is enrolled in day care is an integer or a decimal

Statistics
Probabilityetermine whether a certain antibody is present is 99 5 effective Thi ccurately come back negative if the antibody is not present in the test The probability of a test coming back positive when the antibody is no ive is 0 005 Suppose the test is given to four randomly selected pec antibody s the probability that the test comes back negative for all four people es the probability that the test comes back positive for at least one of th tests are negative Round to four decimal places as needed ast one positive Round to four decimal places as needed

Statistics
Probabilityhe outcome red red green blue brown yellow orange 0 0 2 0 1 0 0 the table above an example of a probability model OA No because not all the probabilities are greater than 0 OB No because the probabilities do not sum to 1 OC Yes because the probabilities sum to 1 and they are all greater than or e to 0 and less than or equal to 1 OD Yes because the probabilities sum to 1 What do we call the outcome red

Statistics
ProbabilityLet the sample space be S 1 2 3 4 5 6 7 8 9 10 Suppose the outcomes are equally likely Compute the probability of the event E an odd number less than 16 P E Type an integer or a decimal Do not round

Statistics
Probabilitythe data in the following table which lists survey results from high school drivers at least 16 years of age Assume that subjects are randomly selected from the included in the table Drove When Drinking Alcohol No 2925 4588 Yes 663 152 Texted While Driving No Texting While Driving If four different high school drivers are randomly selected find the probability that they all drove when drinking alcohol The probability that four randomly selected high school drivers all drove when drinking alcohol is Round to six decimal places as needed Save

Statistics
Probabilitythe data in the following table which lists drive thru order accuracy at popular fast food chains Assume that orders are randomly selected from those included in the table Order Accurate Order Not Accurate Drive thru Restaurant D C 233 40 A 318 34 B 264 60 D 128 12 If one order is selected find the probability of getting an order from Restaurant A or an order that is accurate Are the events of selecting an order from Restaurant A and selecting an accurate order disjoint events CCI Save The probability of getting an order from Restaurant A or an order that is accurate is Round to three decimal places as needed

Statistics
Probabilityrinciple of redundancy is used when system reliability is improved through redundant or backup components Assume that a students alarm clock has a 12 Failure rate Complete parts a through d below C mat is the probability that the student s alarm clock will not work on the morning of an important final exam Round to three decimal places as needed

Statistics
ProbabilityAccording to a recent report 44 of college student internships are unpaid A recent survey of 100 college interns at a local university found that 48 had unpaid internships a Use the five step p value approach to hypothesis testing and a 0 10 level of significanc to determine whether the proportion of college interns that had unpaid internships is different from 0 44 b Assume that the study found that 57 of the 100 college interns had unpaid internships and repeat a Are the conclusions the same a Let be the population proportion Determine the null hypothesis Ho and the alternative hypothesis H Ho H V Type integers or decimals Do not round
Statistics
ProbabilityOn their first date Kelly asks Mike to guess the date of her birth not including the year Complete parts a through c below a What is the probability that Mike will guess correctly Ignore leap years Type an integer or a simplified fraction

Statistics
Probabilityen a population and a sample Choose the correct answer below OA A population is the entire group that is being studied while a sample is a subset of the population that is being studied OB A population is a person or object that is a member of the sample being studied while a sample is the entire group that is being studied OC A population is a subset of the sample that is being studied while a sample is the entire group that is being studied OD A population is the entire group that is being studied while a sample is a person or object that is a member of the population being studied

Statistics
ProbabilityFill in the blank are the characteristics of the individuals of the population being studied Choose the correct answer below are the characteristics of the individuals of the population being studied

Statistics
Probability4 Consider the probability distribution shown here 4 3 2 1 0 1 2 3 4 X 4 3 p x 0 2 0 7 10 15 30 18 10 06 02 a Calculate u o and o b Graph P x and locate 20 20 on the graph c What is the probability that x is in the interval u 20

Statistics
Probability2 Which of the following is not a probability distribution for the discrete random variable X please circle your answer a it is it is not b it is c it is it is not d it is b d P x X P x P x P X 0 2 25 MOD 4 3 2 15 3 IS 20 3 3 O NEO it is not it is not

Statistics
ProbabilityOne practical application of slope of a line is O A to see what a value was at one point in time OB to describe change over time OC to describe the difference between two values

Statistics
ProbabilityAngela drove to Florida for Spring Break It took her two days The first leg of her trip was 315 8 miles The second leg of her trip was 152 3 miles Around how many miles did she drive in all OA 4681 miles OB 500 miles OC 468 miles

Statistics
ProbabilityWhich equation correctly show how to find the percent of tiles that are white in a kitchen that has a total of 200 times 75 of which are white OA 75 75 100 200 OB X 75 100 200 OC 75 X 100 200

Statistics
ProbabilityA person s credit card balance is 3660 If the person pays off 25 of the balance what is the new balance The new balance is dollars

Statistics
ProbabilityA job placement agency advertised that last year its clients on average had a starting salary of 40 000 Assuming average refers to the mean which of the following claims must be true based on this information Note More than one statement could be true If none of the statements is true mark the appropriate box Last year some of their clients had a starting salary of 40 000 or above Last year some of their clients had a starting salary of exactly 40 000 This year at least one of their clients will have a starting salary of at least 40 000 Last year at least one of their clients had a starting salary of more than 36 000 Last year the number of their clients who had a starting salary of 40 000 or below was equal to the number of their clients who had a starting salary of 40 000 or above None of the above statements are true X


Statistics
ProbabilityA weight loss clinic advertised that last month its patients on average lost 7 lb Assuming that average refers to the mea which of the following claims must be true based on this information Note More than one statement could be true If none of the statements is true mark the appropriate box Last month some of their patients lost exactly 7 lb Last month the number of their clients who lost more than 0 7 lb was equal to the number of their clients who lost less than 7 lb Last month at least one of their patients lost more than 12 lb Two months ago at least one of their patients lost at least 7 lb Last month all of their patients lost at least 7 lb None of the above statements are true X S

Statistics
ProbabilityA spinner with 5 equally sized slices has 3 yellow slices 1 red slice and 1 blue slice Rachel spun the dial 1000 time got the following results Outcome Number of Spins Answer the following Round your answers to the nearest thousandths Yellow 633 Red a From Rachel s results compute the experimental probability of landing on yellow 0 c Assuming that the spinner is fair choose the statement below that is true O With a large number of spins there might be a difference between the experimental and theoretical probabilities but the difference should be small 181 b Assuming that the spinner is fair compute the theoretical probability of landing on yellow 0 With a large number of spins there must be no difference between the experimental and theoretical probabilities O With a large number of spins there must be a large difference between the experimental and theoretical probabilities Blue 186 X


Statistics
ProbabilityConsider the scatterplot 20 15 10 G 0 5 10 unit pressure diff vs effectiveness 100 0 effectiveness 100 O 200 The correlation coefficient between effectiveness and unit pressure diff is closest to 0 98031 0 41428 0 69954 0 98048 0 41483 O 0 01014 The regression line slope between effectiveness and unit pressure diff is closest to 0 04202 O 1 95677 01 68226 O 5 5391 The regression line y intercept is closest to 601 23937 99 73725 4 9937

Statistics
ProbabilityA Pr A is closest to 010 18 05 6 5 14 08 14 012 18 09 18 04 11 03 13 Pr B is closest to 07 14 03 11 011 18 08 18 08 13 Pr A U B is closest to 16 18 017 18 08 14 07 11 010 13 07 14 06 6 013 18 Pr A B is closest to 05 7 00 3 06 11 03 9 04 8 01 8 02 3 07 7 Events A and B are B C

Statistics
Probabilityf the mean height of bonsai trees is 42 cm and 95 of the trees are between 12cm and 72cm The standard deviation is

Statistics
Probability0 1 pt 100 Details The amount of time to complete a physical activity in a PE class is approximately normally distributed with a mean of 39 8 seconds and a standard deviation of 6 4 seconds a What is the probability that a randomly chosen student completes the activity in less than 31 7 seconds b What is the probability that a randomly chosen student completes the activity in more than 45 6 seconds c What proportion of students take between 35 6 and 44 4 seconds to complete the activity d 95 of all students finish the activity in less than seconds

Statistics
ProbabilityThe accompanying data represent the weights in grams of a random sample of 48 M M candies Complete parts a through f Click the icon to view the weights of the M M plain candies gram s Round to three decimal places as needed b On the basis of the accompanying histogram comment on the appropriateness of using the Empirical Rule to make any general tatements about the weights of M Ms OA The histogram is not approximately bell shaped so the Empirical Rule can be used OB The histogram is approximately bell shaped so the Empirical Rule cannot be used OC The histogram is approximately bell shaped so the Empirical Rule can be used OD The histogram is not approximately bell shaped so the Frequency Weight of Plain M Ms 30 0 0 7 Weight g

Statistics
ProbabilityWhich histogram depicts a higher standard deviation Q Frequency 10 8 6 4 2 0 40 44 48 52 56 60 a Choose the correct answer below OA Histogram a depicts the higher standard deviation because the distribution has more dispersion OC Histogram a depicts the higher standard deviation because the bars are higher than the average bar in h Frequency 686420 10 30 40 50 60 b OB Histogram b depicts the hi standard deviation since it shaped D Histogram b depicts the hig standard deviation becaus

Statistics
Probability014 1447 8 35557 9 01 egend 110 represents 10 he original set of data is se a comma to separate answers as needed Use ascend
Statistics
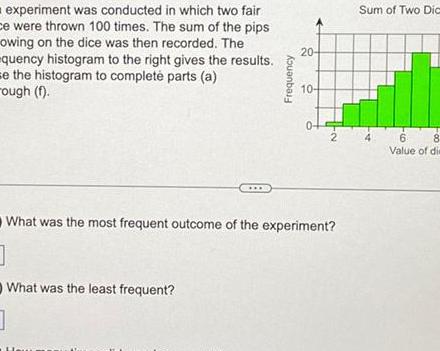
Probabilityexperiment was conducted in which two fair ce were thrown 100 times The sum of the pips owing on the dice was then recorded The quency histogram to the right gives the results se the histogram to complete parts a rough f Frequency 20 10 0 What was the most frequent outcome of the experiment 1 What was the least frequent Sum of Two Dica 6 8 Value of die


Statistics
Probability8 The adult population on a cruise ship has a total of 1564 and can be divided into 3 educational level categories B adults with less than high school B adults with high school diploma and B3 adults with a baccalaureate or more The probabilities of selecting an adult at random within these categories are P B 7 4 P B 53 3 and P B3 39 3 Certain percent of the adults in each educational level category read an astrology report every day event A The percentages are P A B 9 P A B 7 and P A B3 4 For one of these adults selected at random determine the probability that he or she a reads an astrology report every day Answer P A b is an adult with a high school diploma given that he or she reads an astrology report every day Answer P B 4

Statistics
Probability9 In a Sample Space S there are three events of interest A B and C as defined in the Venn diagram below Find Note the numbers are probabilities that each event or part of the event will occur 15 05 S 10 10 175 05 15 B C a P B b P BNC c P C B d P C e Are B and C independent events Why YES NO

Statistics
Probability7 The work force of the Superior Corporation has the following distribution among type of work and gender of workers Gender Male Female Total Type of work Sales 825 Clerical Production Total 675 1 675 825 2 500 1 500 750 250 1 000 2 250 2 750 5 000 The company randomly chooses a worker Find a P Is a Female working on Sales Department Answer b P is a worker from Sales Department given that the worker is a Female Answer c In order to promote loyalty to the company the company randomly chooses a worker to receive an all expenses paid vacation next month Is the event of choosing a Female independent of the event of choosing a Sales Department worker Answer YES NO Why
Statistics
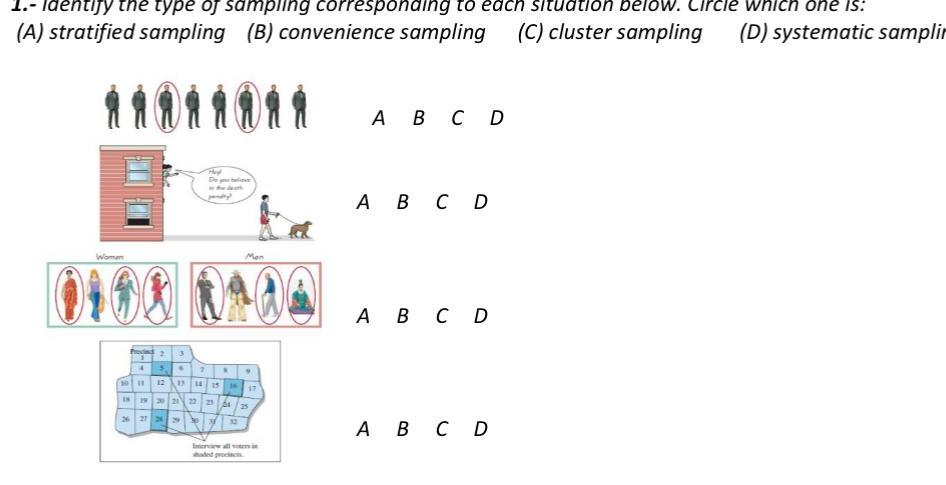
Probability1 Identify the type of sampling corresponding to each situation below Circle which one is A stratified sampling B convenience sampling C cluster sampling D systematic samplin Women 3 5 7 N E De 10 11 12 1u 18 19 20 21 22 23 24 25 N 15 9 17 Interview all voters in A B C D A B C D A B C D A B C D

Statistics
ProbabilityLast year over 7000 students took an entrance exam at a certain state university Mary s score was at the percentile 74th a Which of the following must be true about Mary s score Mary scored higher than about 26 of the students who took the exam About 26 of the students who took the exam scored higher than Mary O Mary got about 74 of the questions correct O Mary got about 74 of the questions wrong b Which of the following must be true about Mary s and Rafael s scores Mary scored higher than Rafael Both Mary and Rafael scored higher than the median O Mary got 33 more questions correct than Rafael O Mary s and Rafael s scores were both in the bottom half of all scores X 5 percentile Rafael s score was at the 41st

Statistics
Probabilitya coin is flipped 8 times what is the probability that it will show all heads or all tails Show your work

Statistics
Probability4 If a coin is flipped 8 times what is the probability that it will show all heads or all tails Show your work

Statistics
ProbabilityThe table shows the relationship between weight and lifespan for several dog breeds Use DESMOS to find an equation of the line of best fit Let pounds be the x value and lifespan be y Breed Yorkshire Terrier Shih Tzu Pug Boston Terrier Welsh Corgi Pembroke Bulldog Siberian Husky Golden Retriever German Shepherd Dog Rottweiler Great Dane Oy 0 04x 13 62 Oy 0 04x 13 62 Oy 04x 13 62 OYN 0 04x 13 62 Typical Weight pounds Typical Lifespan years 5 5 15 12 5 13 13 5 There is no correct answer given 16 20 26 45 47 5 65 72 5 107 5 135 13 13 7 12 12 11 10 8 5
Statistics
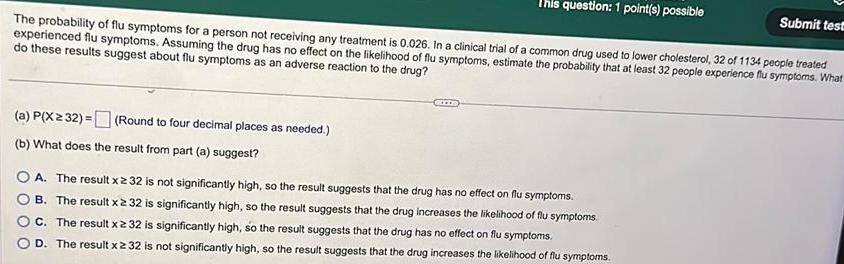
ProbabilityThis question 1 point s possible The probability of flu symptoms for a person not receiving any treatment is 0 026 In a clinical trial of a common drug used to lower cholesterol 32 of 1134 people treated experienced flu symptoms Assuming the drug has no effect on the likelihood of flu symptoms estimate the probability that at least 32 people experience flu symptoms What do these results suggest about flu symptoms as an adverse reaction to the drug a P X2 32 b What does the result from part a suggest Round to four decimal places as needed A The result x 32 is not significantly high so the result suggests that the drug has no effect on flu symptoms B The result x 32 is significantly high so the result suggests that the drug increases the likelihood of flu symptoms C The result x 232 is significantly high so the result sug ests that the drug has no effect on flu symptoms D The result x 232 is not significantly high so the result suggests that the drug increases the likelihood of flu symptoms Submit test

Statistics
ProbabilityFor the histogram on the right determine whether the mean is greater than less than or approximately equal to the median 201 Justify your answer 16 12 8 4 0 Which of the following is correct OA x M because the histogram is symmetric OC x M because the histogram is skewed right OE x M because the histogram is skewed right OB x M because the histogram is skewed left O D x M because the histogram is symmetric OF x M because the histogram is skewed left O

Statistics
ProbabilityQuestion 11 of 16 A survey found that women s heights are normally distributed with mean 63 9 in and standard deviation 2 2 in A branch of the military requires women s heights to be between 58 in and 80 in a Find the percentage of women meeting the height requirement Are many women being denied the opportunity to join this branch of the military because they are too short or too tall b If this branch of the military changes the height requirements so that all women are eligible except the shortest 1 and the tallest 2 what are the new height requirements Click to view page 1 of the table Click to view page 2 of the table a The percentage of women who meet the height requirement is 9931 Round to two decimal places as needed Are many women being denied the opportunity to join this branch of the military because they are too short or too tall This test 16 point s possible This question 1 point s possible A No because only a small percentage of women are not allowed to join this branch of the military because of their height B No because the percentage of women who meet the height requirement is fairly small C Yes because a large percentage of women are not allowed to join this branch of the military because of their height D Yes because the percentage of women who meet the height requirement is fairly large b For the new height requirements this branch of the military requires women s heights to be at least in and at most in Round to one decimal place as needed Sub

Statistics
ProbabilityWhich statement below indicates the area to the left of 19 5 before a continuity correction is used Choose the correct answer below At least 19 At least 20 At most 19 Less than 19 C

Statistics
ProbabilityDr Szyslak is a very demanding statistics professor Only 65 of students who take his class pass Assuming that the chance of passing is independent among all students if five students are randomly sampled from Dr Szyslak s class what is the probability that exactly three of them will pass