Probability Questions and Answers
Statistics
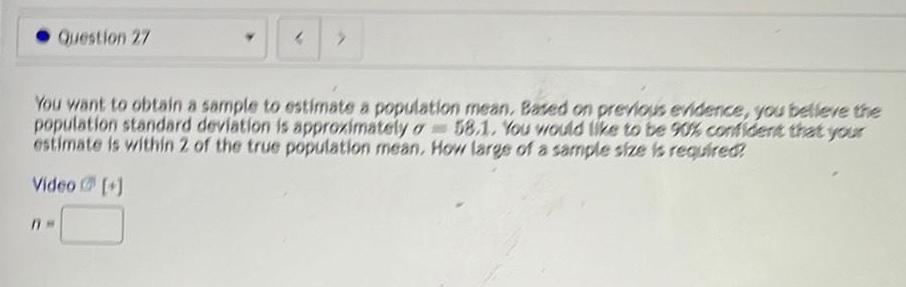
ProbabilityQuestion 27 4 You want to obtain a sample to estimate a population mean Based on previous evidence you believe the population standard deviation is approximately o 58 1 You would like to be 90 confident that your estimate is within 2 of the true population mean How large of a sample size is required Video
Statistics
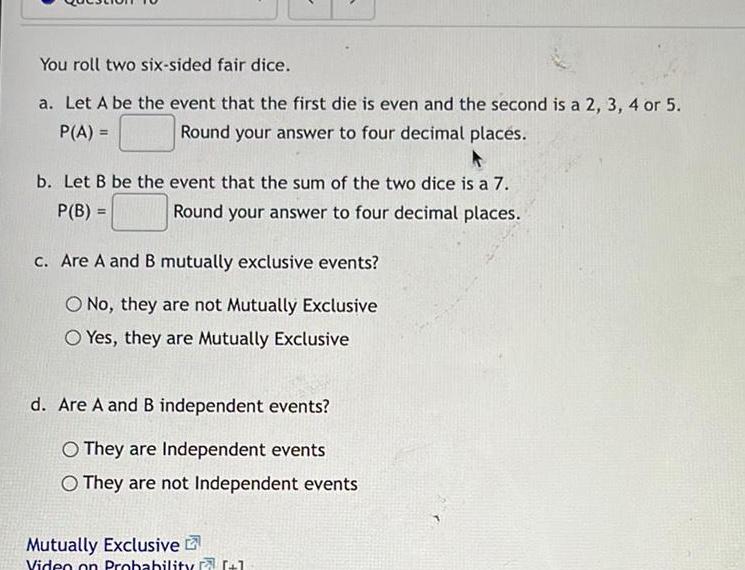
ProbabilityYou roll two six sided fair dice a Let A be the event that the first die is even and the second is a 2 3 4 or 5 Round your answer to four decimal places P A A b Let B be the event that the sum of the two dice is a 7 P B Round your answer to four decimal places c Are A and B mutually exclusive events O No they are not Mutually Exclusive O Yes they are Mutually Exclusive d Are A and B independent events O They are Independent events O They are not Independent events Mutually Exclusive Video on Probability 1
Statistics
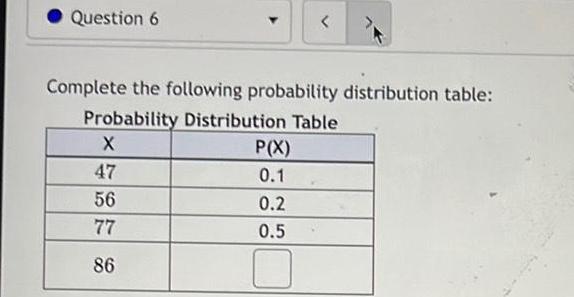
ProbabilityQuestion 6 Complete the following probability distribution table Probability Distribution Table X 47 56 77 86 P X 0 1 0 2 0 5
Statistics
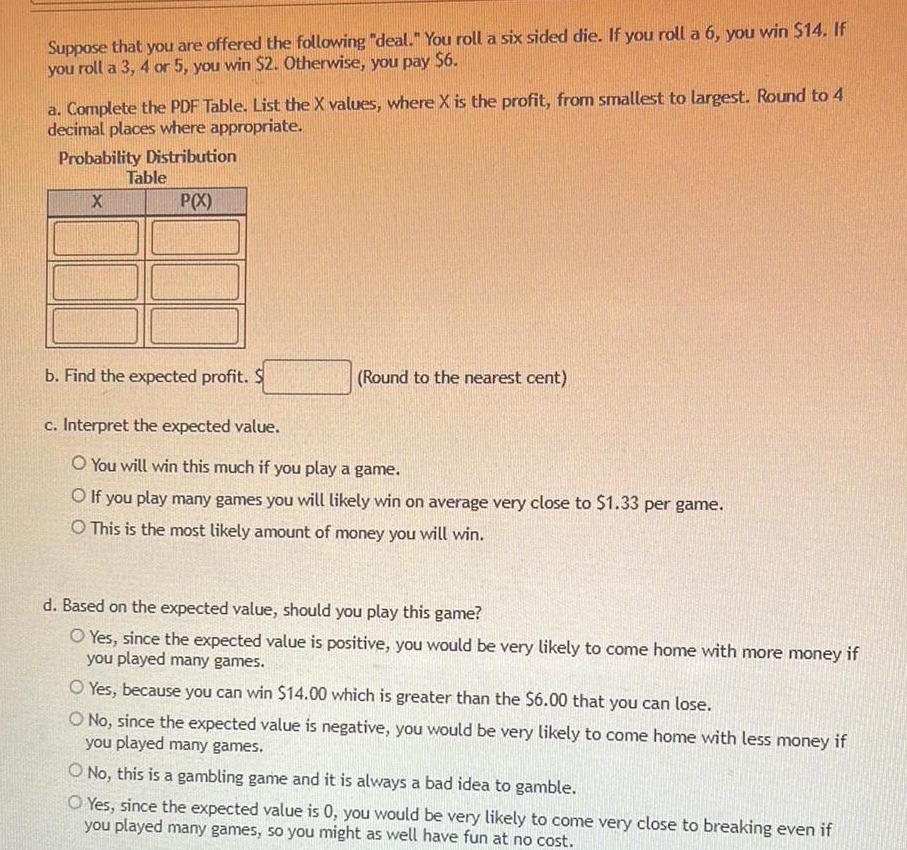
ProbabilitySuppose that you are offered the following deal You roll a six sided die If you roll a 6 you win 14 If you roll a 3 4 or 5 you win 2 Otherwise you pay 6 a Complete the PDF Table List the X values where X is the profit from smallest to largest Round to 4 decimal places where appropriate Probability Distribution P X X Table b Find the expected profit Round to the nearest cent c Interpret the expected value O You will win this much if you play a game O If you play many games you will likely win on average very close to 1 33 per game O This is the most likely amount of money you will win d Based on the expected value should you play this game O Yes since the expected value is positive you would be very likely to come home with more money if you played many games O Yes because you can win 14 00 which is greater than the 6 00 that you can lose O No since the expected value is negative you would be very likely to come home with less money if you played many games O No this is a gambling game and it is always a bad idea to gamble O Yes since the expected value is 0 you would be very likely to come very close to breaking even if you played many games so you might as well have fun at no cost
Statistics
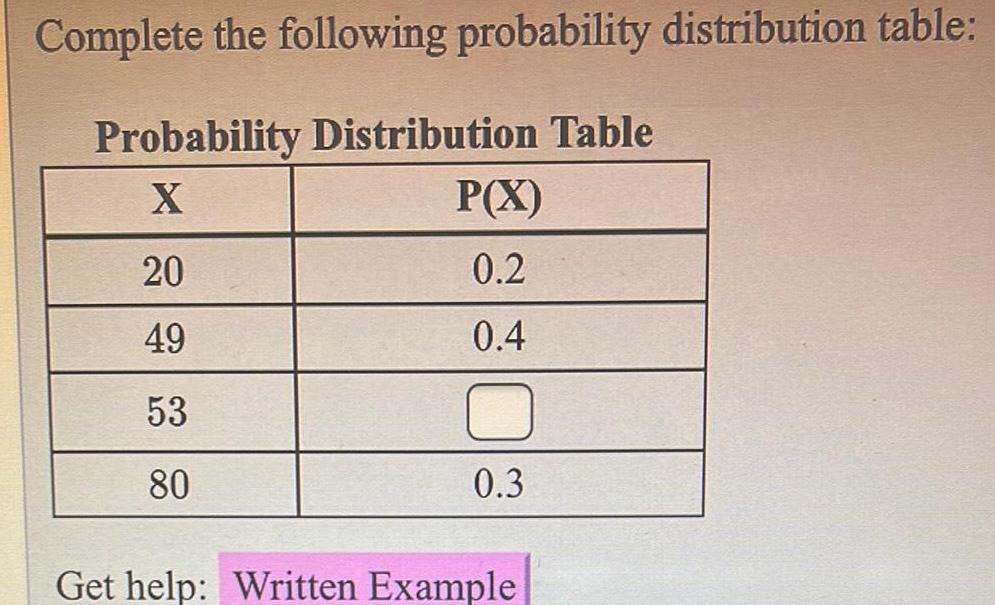
ProbabilityComplete the following probability distribution table Probability Distribution Table X 20 49 53 80 P X 0 2 0 4 0 3 Get help Written Example
Statistics
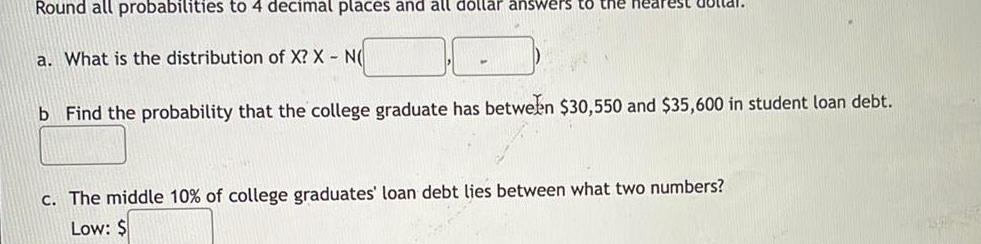
ProbabilityRound all probabilities to 4 decimal places and all dollar answers to the nearest Buttal a What is the distribution of X X N b Find the probability that the college graduate has between 30 550 and 35 600 in student loan debt c The middle 10 of college graduates loan debt lies between what two numbers Low
Statistics
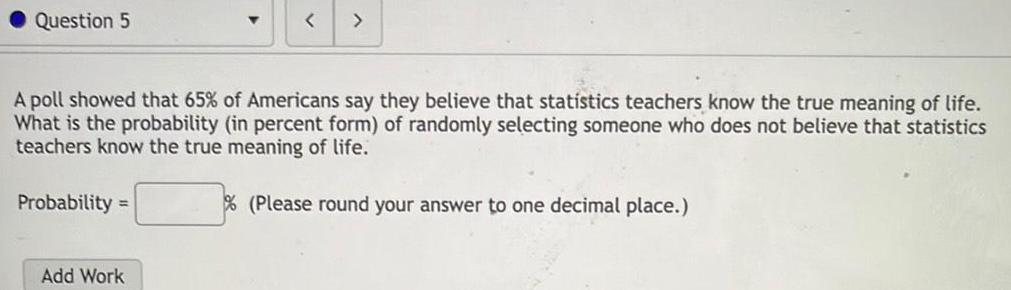
ProbabilityQuestion 5 Probability A poll showed that 65 of Americans say they believe that statistics teachers know the true meaning of life What is the probability in percent form of randomly selecting someone who does not believe that statistics teachers know the true meaning of life Please round your answer to one decimal place Add Work
Statistics
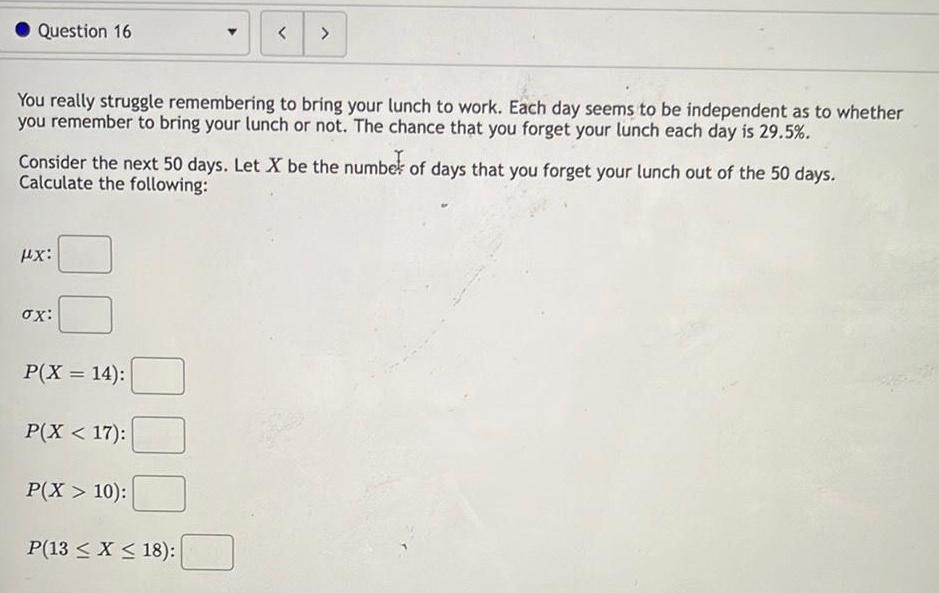
ProbabilityQuestion 16 You really struggle remembering to bring your lunch to work Each day seems to be independent as to whether you remember to bring your lunch or not The chance that you forget your lunch each day is 29 5 Consider the next 50 days Let X be the number of days that you forget your lunch out of the 50 days Calculate the following HX ox P X 14 P X 17 P X 10 P 13 x 18
Statistics
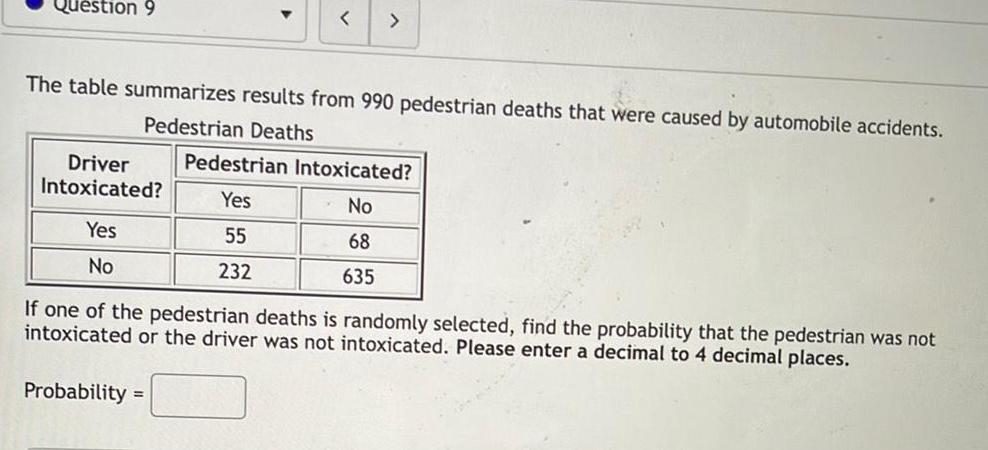
ProbabilityQuestion 9 The table summarizes results from 990 pedestrian deaths that were caused by automobile accidents Pedestrian Deaths Driver Intoxicated Yes No Probability Pedestrian Intoxicated Yes No 55 68 232 635 If one of the pedestrian deaths is randomly selected find the probability that the pedestrian was not intoxicated or the driver was not intoxicated Please enter a decimal to 4 decimal places
Statistics
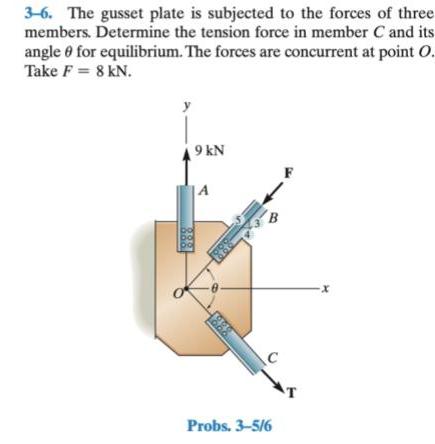
Probability3 6 The gusset plate is subjected to the forces of three members Determine the tension force in member C and its angle for equilibrium The forces are concurrent at point O Take F 8 KN 9 kN A 0 00 100 C Probs 3 5 6 X
Statistics
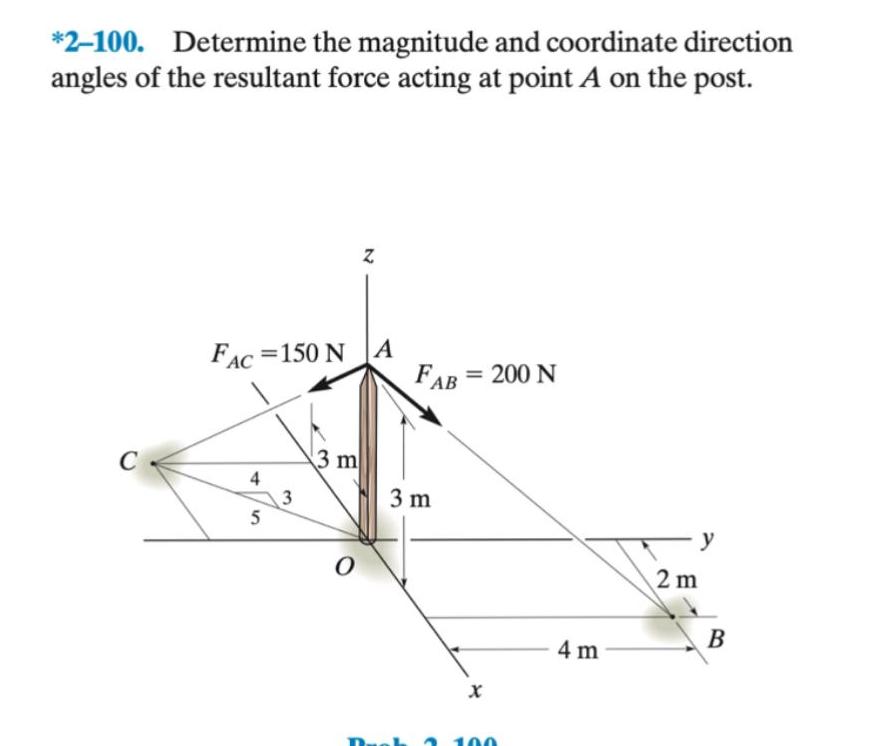
Probability2 100 Determine the magnitude and coordinate direction angles of the resultant force acting at point A on the post C FAC 150 NA 4 5 3 3 m N 0 FAB 3 m 200 N X 100 4 m 2 m B
Statistics
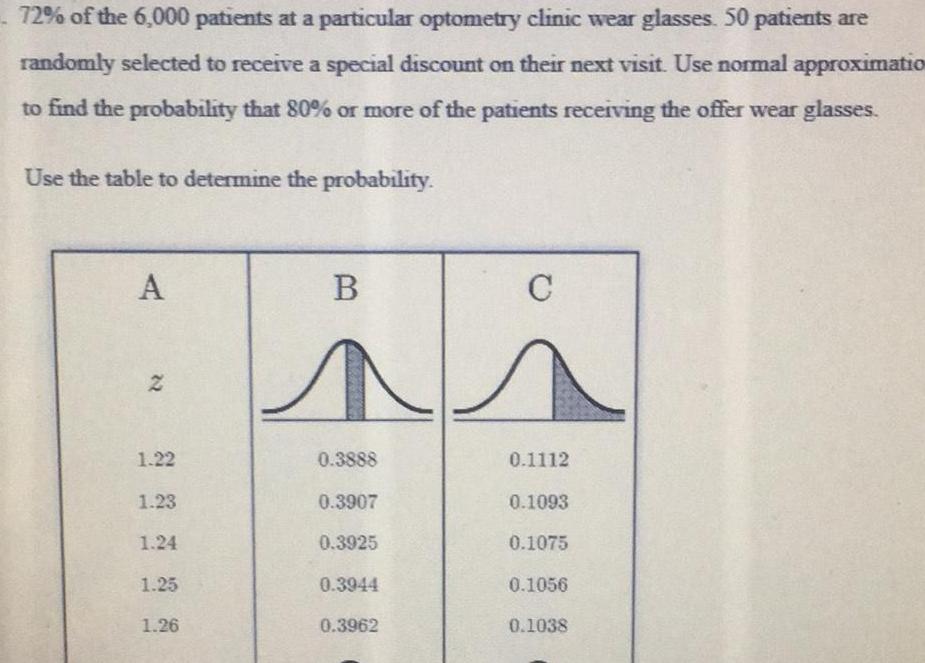
Probability72 of the 6 000 patients at a particular optometry clinic wear glasses 50 patients are randomly selected to receive a special discount on their next visit Use normal approximatio to find the probability that 80 or more of the patients receiving the offer wear glasses Use the table to determine the probability A 22 1 22 1 23 1 24 1 25 1 26 B 0 3888 0 3907 0 3925 0 3944 0 3962 C 0 1112 0 1093 0 1075 0 1056 0 1038

Statistics
ProbabilitySupposed you will receive 50 each week for 8 years How much is this worth to you today if your discount rate is 9 Round to the nearest dollar
Statistics
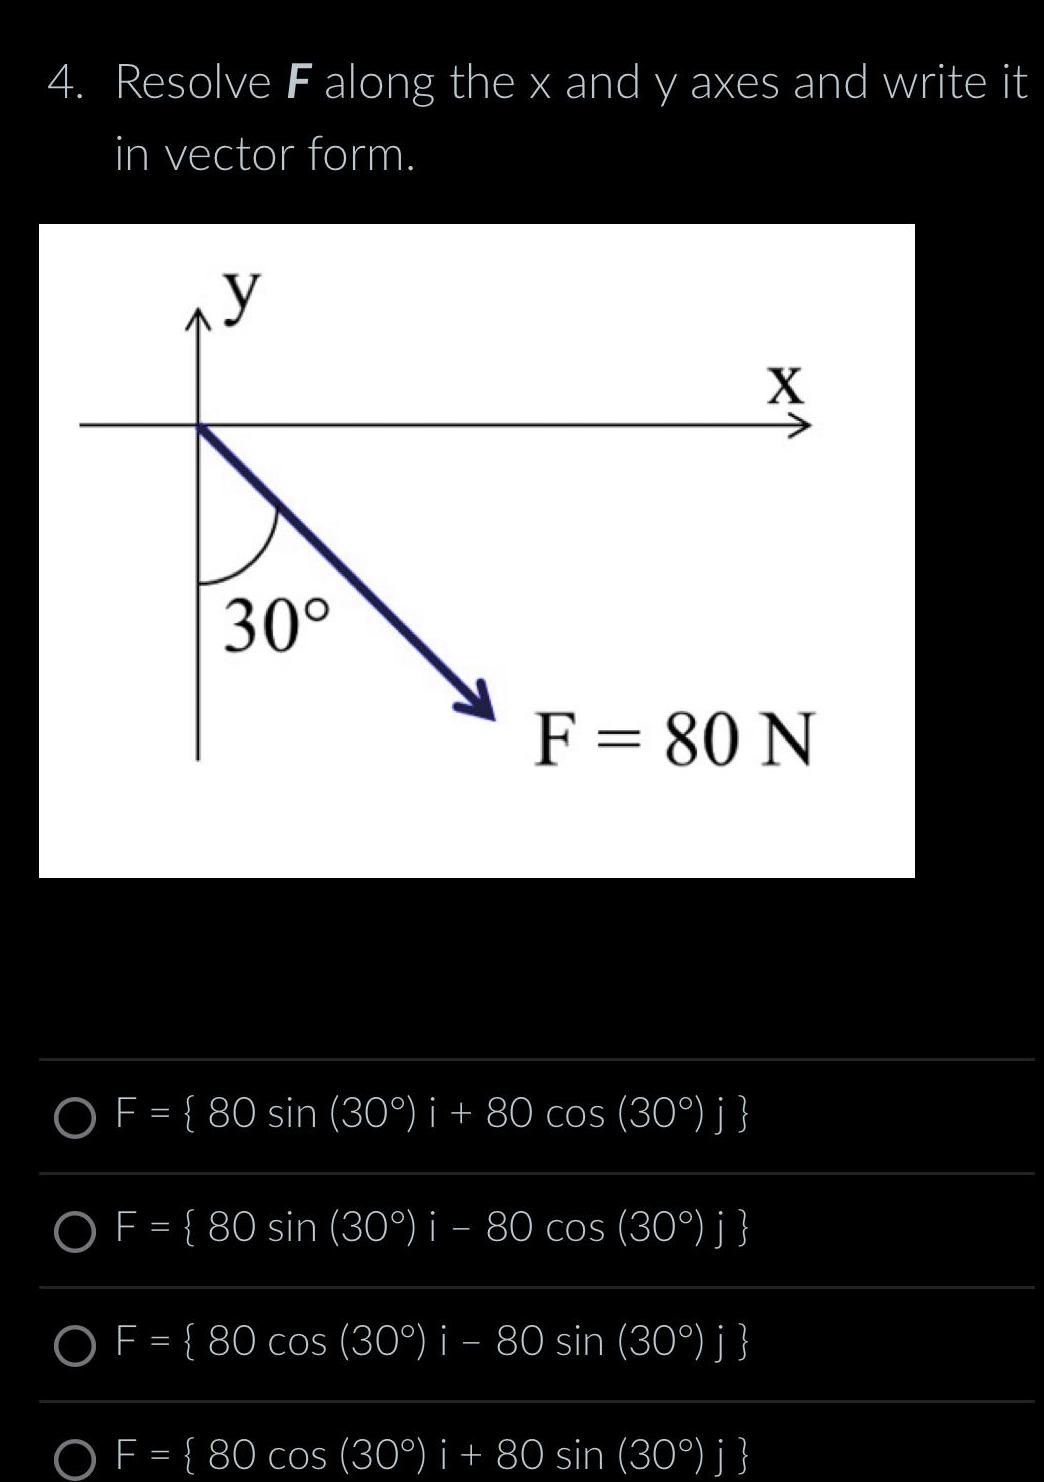
Probability4 Resolve F along the x and y axes and write it in vector form y 30 X F 80 N OF 80 sin 30 i 80 cos 30 j OF 80 sin 30 i 80 cos 30 j OF 80 cos 30 i 80 sin 30 j OF 80 cos 30 i 80 sin 30 j
Statistics
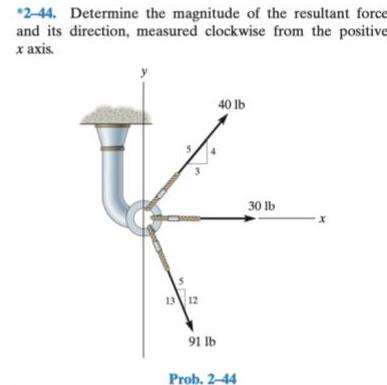
Probability2 44 Determine the magnitude of the resultant force and its direction measured clockwise from the positive x axis 13 12 91 lb 40 lb Prob 2 44 30 lb
Statistics
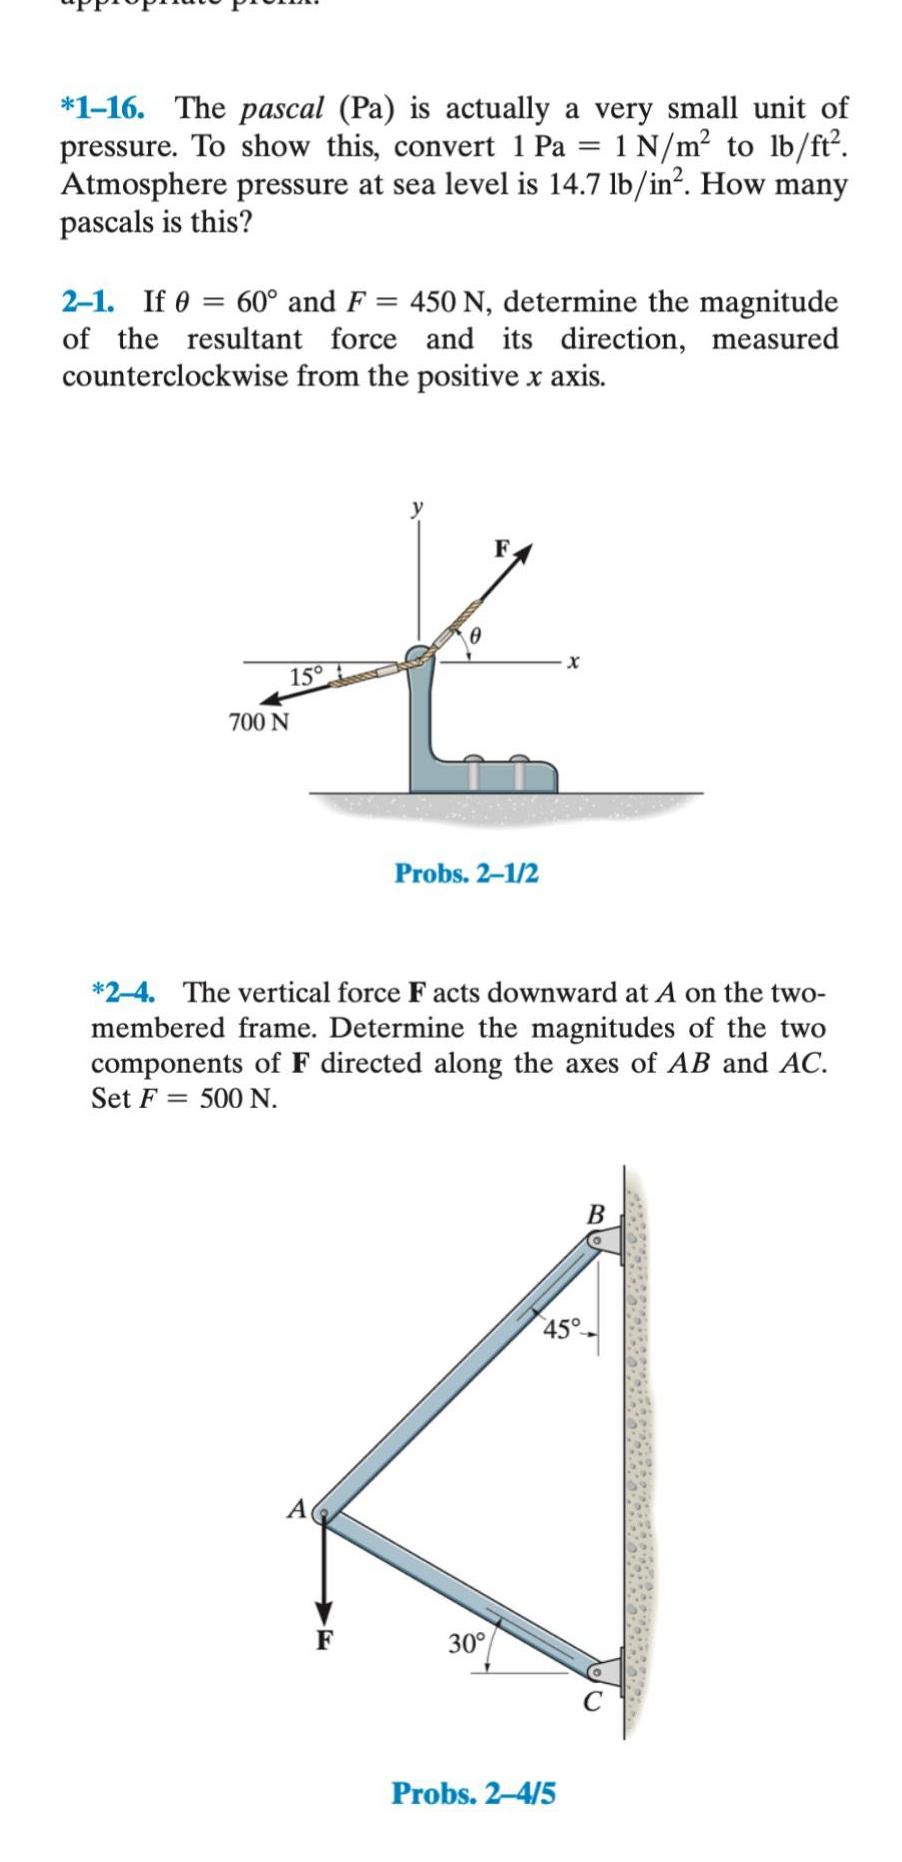
Probability1 16 The pascal Pa is actually a very small unit of pressure To show this convert 1 Pa 1 N m to lb ft Atmosphere pressure at sea level is 14 7 lb in How many pascals is this 2 1 If 60 and F 450 N determine the magnitude of the resultant force and its direction measured counterclockwise from the positive x axis 15 700 N F F Probs 2 1 2 2 4 The vertical force Facts downward at A on the two membered frame Determine the magnitudes of the two components of F directed along the axes of AB and AC Set F 500 N 30 Probs 2 4 5 B 45
Statistics
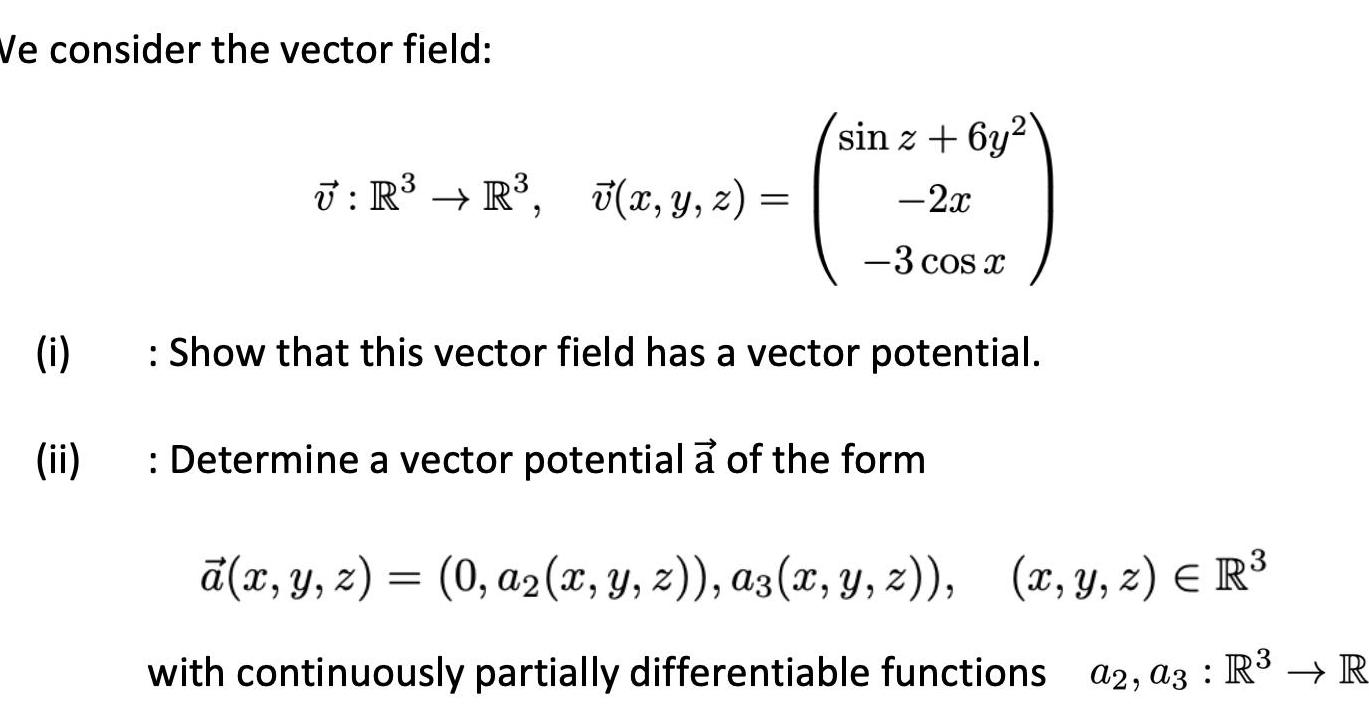
ProbabilityWe consider the vector field i ii 3 U R R 7 x y z sin z 6y 2x 3 cos x Show that this vector field has a vector potential Determine a vector potential a of the form x y z 0 a2 x y z az x y z x y z R with continuously partially differentiable functions a2 a3 R R
Statistics
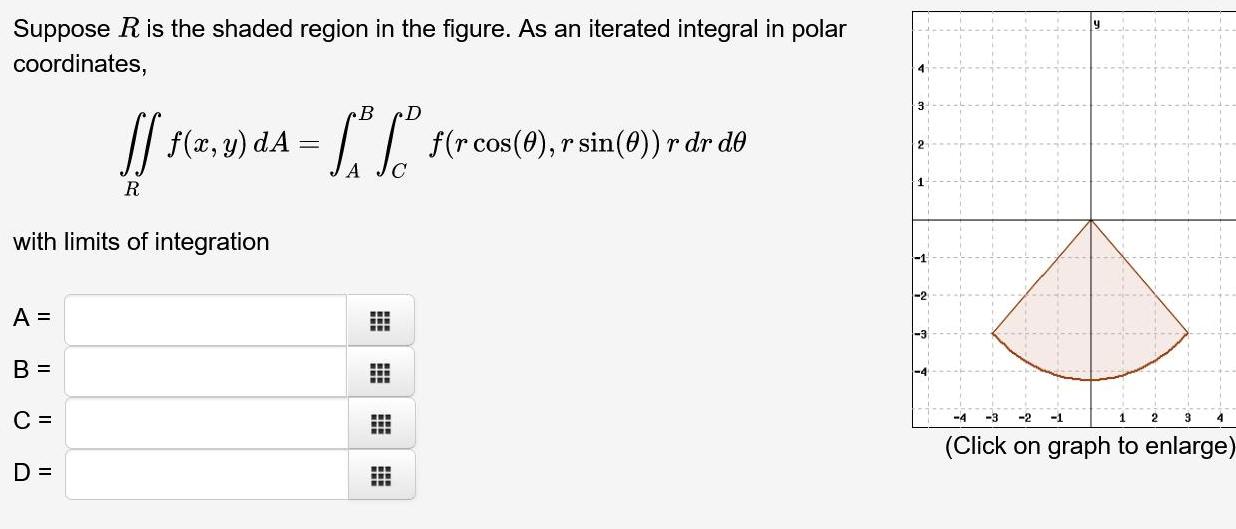
ProbabilitySuppose R is the shaded region in the figure As an iterated integral in polar coordinates B D f 2 3 A f r cos 9 r sin 0 dr d y r A C R with limits of integration A B C D FEE HHH www 4 3 2 1 3 Click on graph to enlarge 4
Statistics
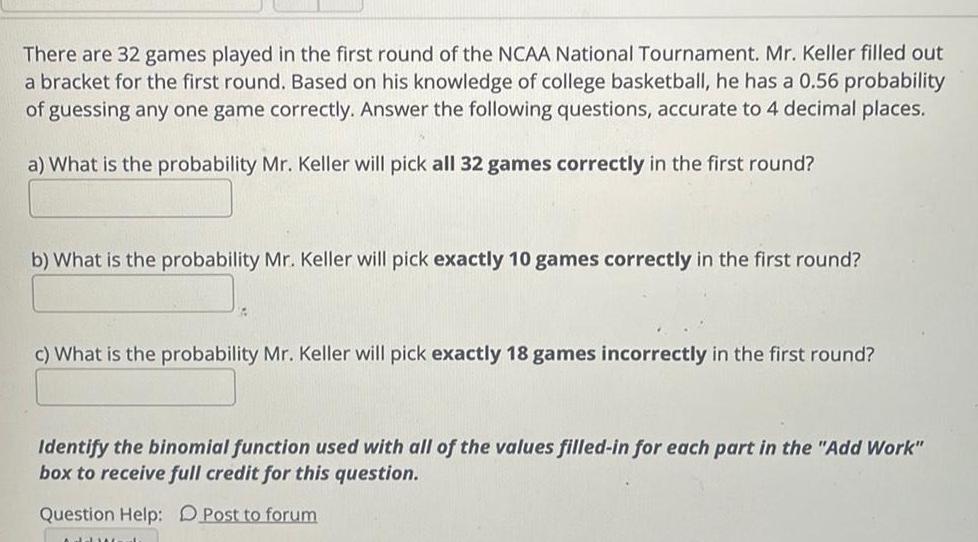
ProbabilityThere are 32 games played in the first round of the NCAA National Tournament Mr Keller filled out a bracket for the first round Based on his knowledge of college basketball he has a 0 56 probability of guessing any one game correctly Answer the following questions accurate to 4 decimal places a What is the probability Mr Keller will pick all 32 games correctly in the first round b What is the probability Mr Keller will pick exactly 10 games correctly in the first round c What is the probability Mr Keller will pick exactly 18 games incorrectly in the first round Identify the binomial function used with all of the values filled in for each part in the Add Work box to receive full credit for this question Question Help Post to forum
Statistics
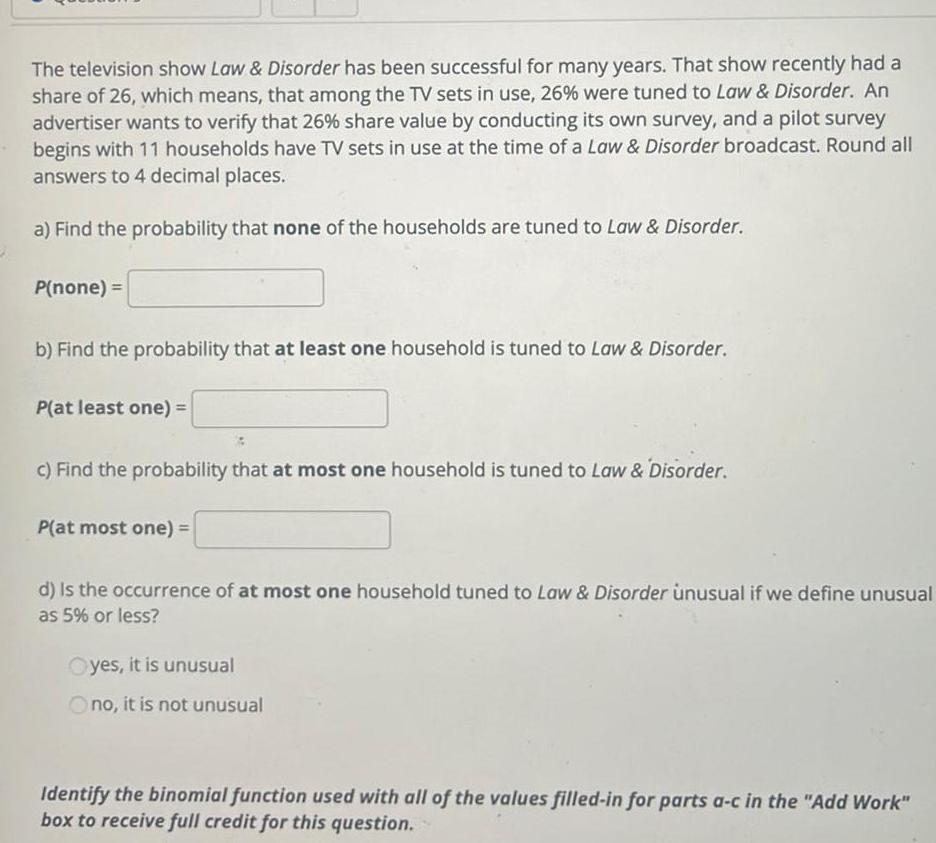
ProbabilityThe television show Law Disorder has been successful for many years That show recently had a share of 26 which means that among the TV sets in use 26 were tuned to Law Disorder An advertiser wants to verify that 26 share value by conducting its own survey and a pilot survey begins with 11 households have TV sets in use at the time of a Law Disorder broadcast Round all answers to 4 decimal places a Find the probability that none of the households are tuned to Law Disorder P none b Find the probability that at least one household is tuned to Law Disorder P at least one c Find the probability that at most one household is tuned to Law Disorder P at most one d Is the occurrence of at most one household tuned to Law Disorder unusual if we define unusual as 5 or less Oyes it is unusual Ono it is not unusual Identify the binomial function used with all of the values filled in for parts a c in the Add Work box to receive full credit for this question
Statistics
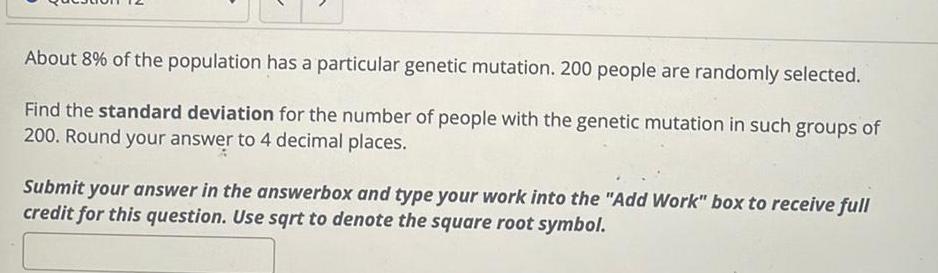
ProbabilityAbout 8 of the population has a particular genetic mutation 200 people are randomly selected Find the standard deviation for the number of people with the genetic mutation in such groups of 200 Round your answer to 4 decimal places Submit your answer in the answerbox and type your work into the Add Work box to receive full credit for this question Use sqrt to denote the square root symbol
Statistics
ProbabilityA poll is given showing 70 are in favor of a new building project If 7 people are chosen at random what is the probability that exactly 5 of them favor the new building project Round your answers to 4 decimal places Identify the binomial function used with all of the values filled in in the Add Work box to receive full credit for this question
Statistics
Probability9 For a normal distribution with 12 8 and a 1 35 find the probability of a P x 11 b P x 12 2 c P 10 5 x 11 2 d P 13 1 x 13 9
Statistics
Probability10 The SAT is one of two major college aptitude tests that is taken The mean composite score i 1060 with a standard deviation of 195 Assuming that the distribution of scores is approximately normal find the probability that a randomly selected test taker a scores above 1100 b scores between 1100 and 1200 c scores above 1400 11 Using the information from 10 find the percentile for each score a Susan scored 980 this puts her in the b Jaydin scored 1125 this puts him in the c Yesinia scored 1302 this puts her in the percentile percentile percentile
Statistics
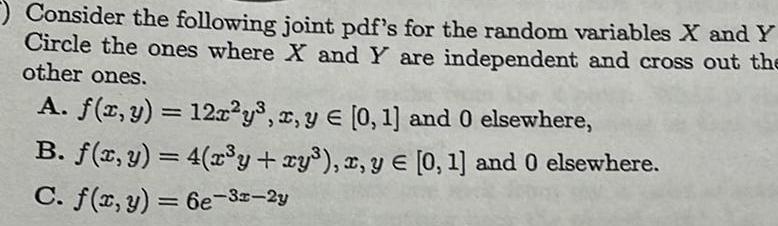
ProbabilityConsider the following joint pdf s for the random variables X and Y Circle the ones where X and Y are independent and cross out the other ones A f x y 12x y x y 0 1 and 0 elsewhere B f x y 4 x y xy x y 0 1 and 0 elsewhere C f x y 6e 3x 2y
Statistics
ProbabilityDefaulting on a loan means failing to pay it back on time The default rate among NYU students on their student loans is 1 As a project you develop a test to predict which students will default Your test is good but not perfect It gives 4 false positives i e prediciting a student will default who in fact will not If has a 0 false negative rate i e prediciting a student won t default who in fact will 10 a Suppose a random student tests positive What is the probability that he will truly default
Statistics
Probability8 There is a theory that people can postpone their death until after an important event To test the theory Phillips and King 1988 collected data on deaths around the Jewish holiday Passover Of 1919 deaths 922 died the week before the holiday and 997 died the week after Think of this as a binomial and test the null hypothesis that 0 Is there evidence to reject the null hypothesis at a 95 level
Statistics
ProbabilityFor the following please find the boundary at infinity of the region 1 z y z y 1 0 2 z y z 0 y 0 3 x y z x y x x y z 6
Statistics
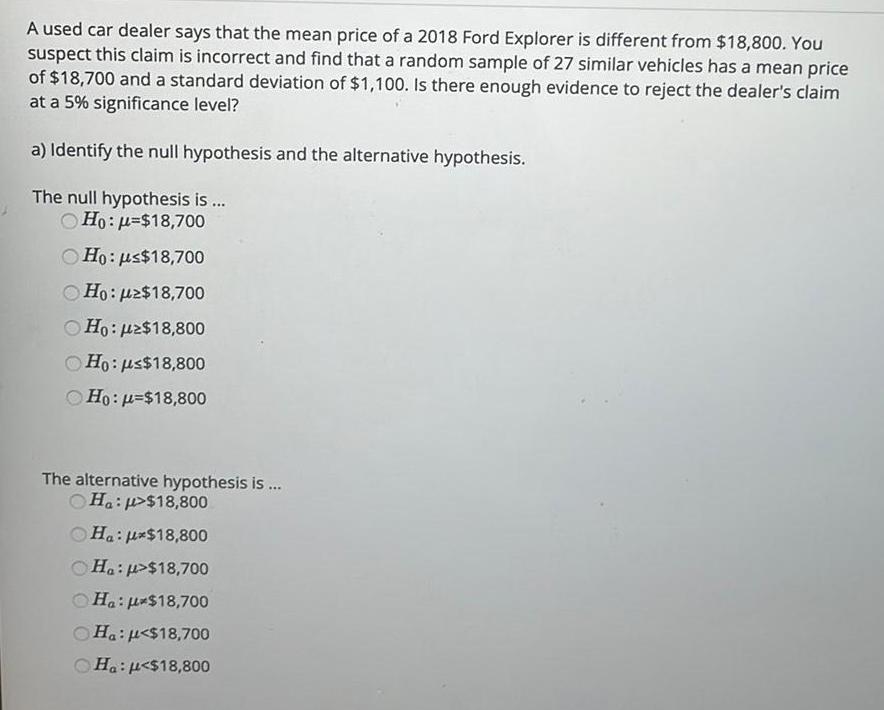
ProbabilityA used car dealer says that the mean price of a 2018 Ford Explorer is different from 18 800 You suspect this claim is incorrect and find that a random sample of 27 similar vehicles has a mean price of 18 700 and a standard deviation of 1 100 Is there enough evidence to reject the dealer s claim at a 5 significance level a Identify the null hypothesis and the alternative hypothesis The null hypothesis is Ho 18 700 Ho us 18 700 Ho 2 18 700 Ho uz 18 800 Ho us 18 800 Ho 18 800 The alternative hypothesis is Ha 18 800 Ha 18 800 Ha 18 700 Ha 18 700 Ha 18 700 Ha 18 800

Statistics
Probabilityyou randomly select a card from a well shuffled standard deck of 52 cards what is the probability that the card you select is a spade or 7 Your answer must be in the form of a reduced fraction
Statistics
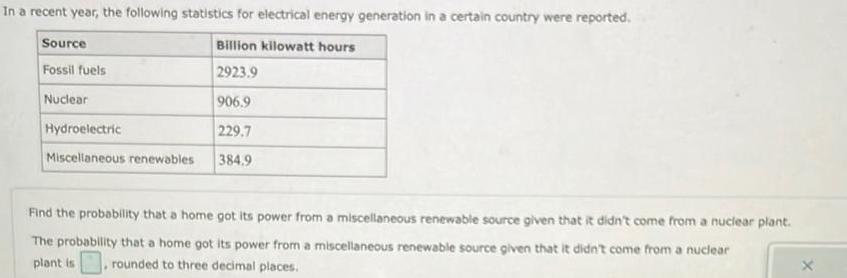
ProbabilityIn a recent year the following statistics for electrical energy generation in a certain country were reported Billion kilowatt hours 2923 9 906 9 229 7 384 9 Source Fossil fuels Nuclear Hydroelectric Miscellaneous renewables Find the probability that a home got its power from a miscellaneous renewable source given that it didn t come from a nuclear plant The probability that a home got its power from a miscellaneous renewable source given that it didn t come from a nuclear plant is rounded to three decimal places
Statistics
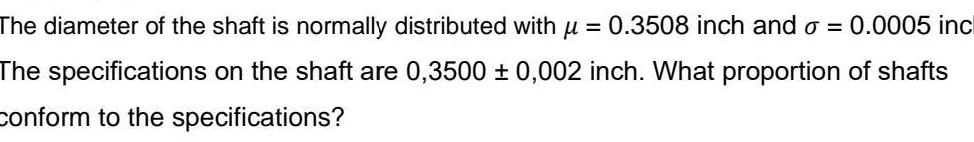
ProbabilityThe diameter of the shaft is normally distributed with u 0 3508 inch and o 0 0005 inc The specifications on the shaft are 0 3500 0 002 inch What proportion of shafts Conform to the specifications
Statistics
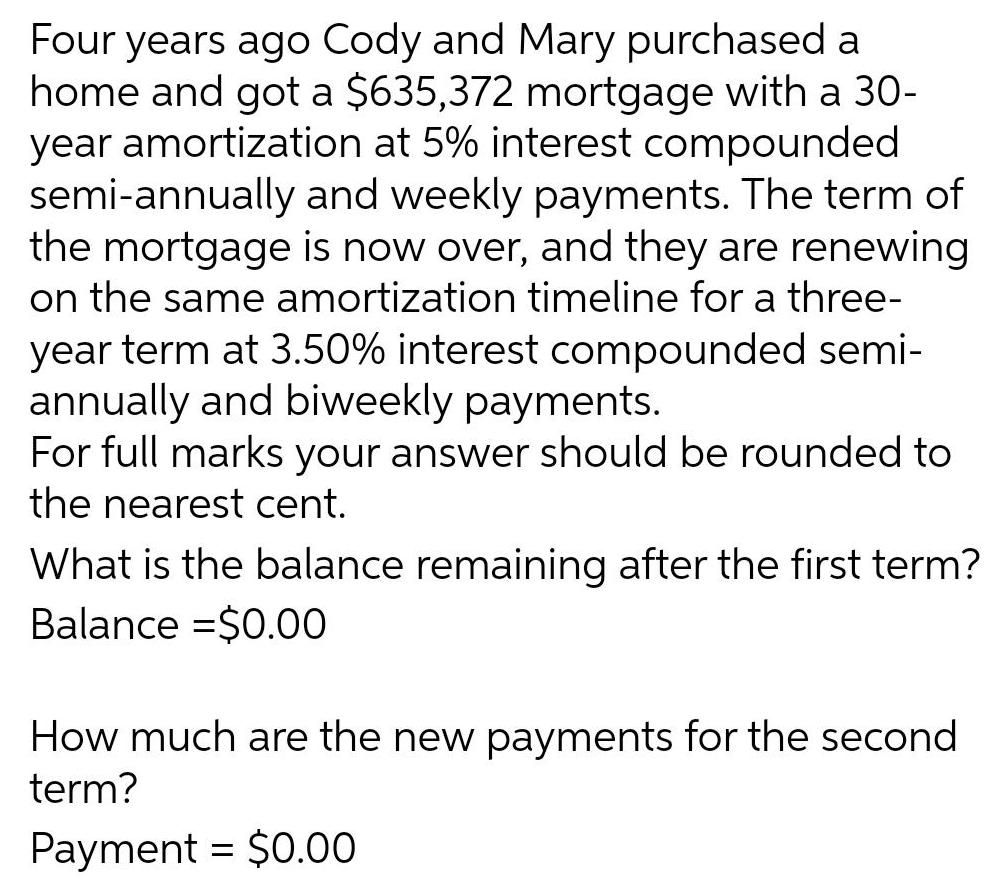
ProbabilityFour years ago Cody and Mary purchased a home and got a 635 372 mortgage with a 30 year amortization at 5 interest compounded semi annually and weekly payments The term of the mortgage is now over and they are renewing on the same amortization timeline for a three year term at 3 50 interest compounded semi annually and biweekly payments For full marks your answer should be rounded to the nearest cent What is the balance remaining after the first term Balance 0 00 How much are the new payments for the second term Payment 0 00
Statistics
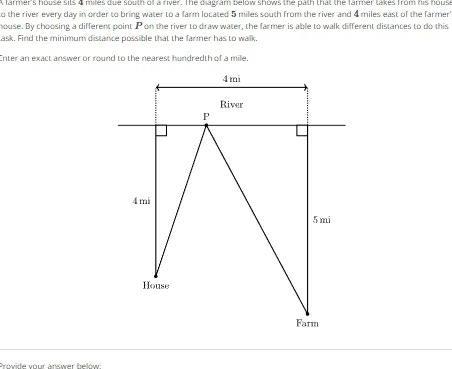
Probabilityfarmer s house sits 4 miles due south of a river The diagram below shows the path that the farmer Lakes from his house a the river every day in order to bring water to a farm located 5 miles south from the river and 4 miles east of the farmer house By choosing a different point P on the river to draw water the farmer is able to walk different distances to do this ask Find the minimum distance possible that the farmer has to walk Inter an exact answer or round to the nearest hundredth of a mile Provide your answer below mi House P 4 mi River 5 mi Farm
Statistics
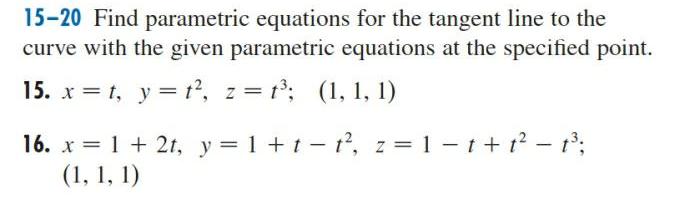
Probability15 20 Find parametric equations for the tangent line to the curve with the given parametric equations at the specified point 15 x t y 1 z t 1 1 1 16 x 1 2t y 1 t t z 1 t t 1 1 1 1
Statistics
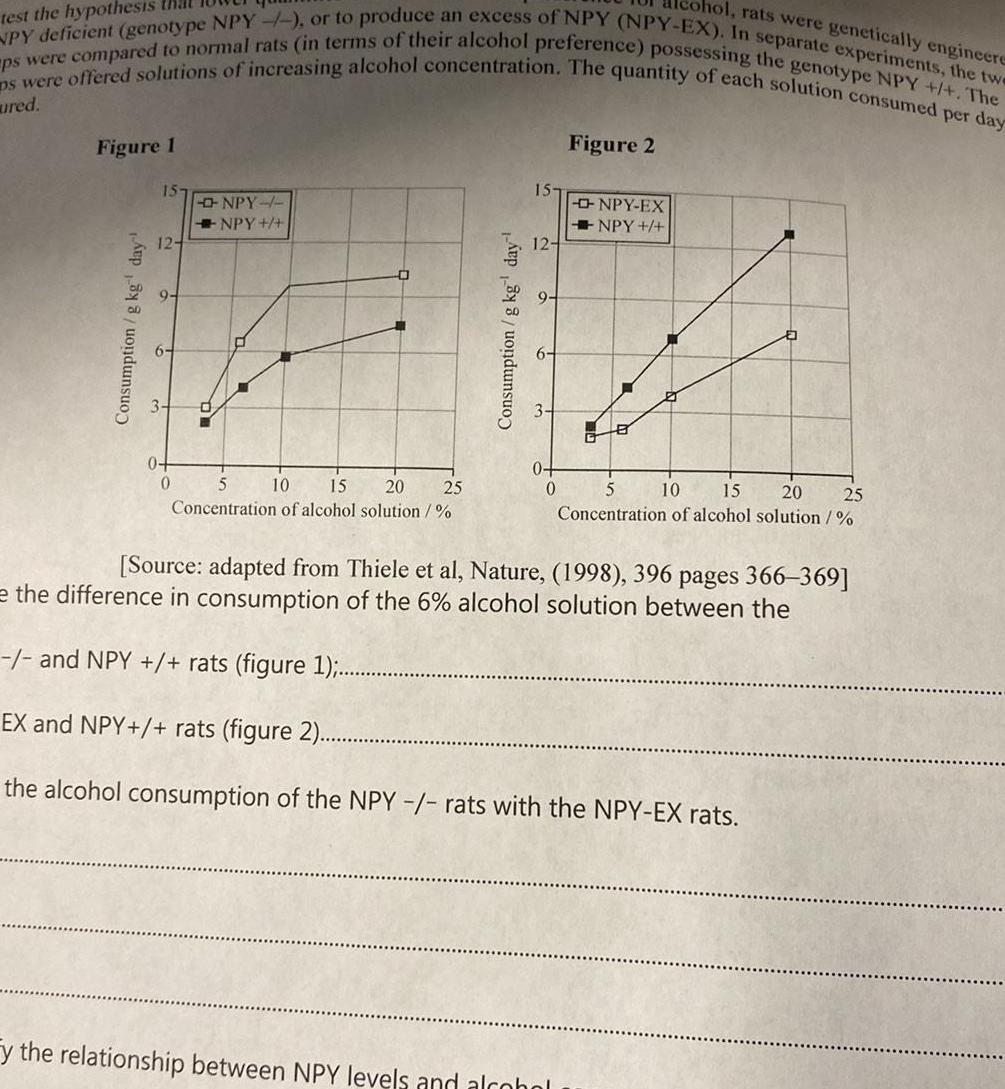
Probabilitycohol rats were genetically engineere test the hypothesis that NPY deficient genotype NPY or to produce an excess of NPY NPY EX In separate experiments the twe ps were offered solutions of increasing alcohol concentration The quantity of each solution consumed per day ps were compared to normal rats in terms of their alcohol preference possessing the genotype NPY The ured Figure 1 Consumption g kg day 15 12 0 0 NPY NPY 5 10 15 20 25 Concentration of alcohol solution Consumption g kg day 15 12 6 0 Figure 2 y the relationship between NPY levels and alcohol NPY EX NPY B 25 5 10 15 20 Concentration of alcohol solution Source adapted from Thiele et al Nature 1998 396 pages 366 369 e the difference in consumption of the 6 alcohol solution between the and NPY rats figure 1 EX and NPY rats figure 2 the alcohol consumption of the NPY rats with the NPY EX rats
Statistics
Probability9 A couple received an inheritance of 125 000 the year they turned 46 and invested it in a fund that earns 6 3 compounded monthly If this amount is deferred for 16 years until they retire how much will it provide at the end of each month for the next 20 years after they retire
Statistics
Probability3 Professional curlers can slide the stone into the house centre 75 7 of the time What is the probability of a randomly selected professional curler sliding the stone into the center five times in a row 5 points
Statistics
ProbabilityHector was admitted to the hospital for liver failure He has been in the hospital for eight days and is ready to go home but his condition is not getting any better He expressed to the staff that he wanted to leave against medical advice but the staff refused to discharge him This is an example of which of the following types of torts AKS 6 a battery b verbal abuse c invasion of privacy d false imprisonment
Statistics
ProbabilityThe term Freshman 15 refers to the claim that college students typically gain 15 lb during their freshman year at college Assume that the amounts of weight that male college students gain during their freshman year are normally distributed with a mean of 2 2 lb and a standard deviation of 11 3 lb Find the probability that a randomly selected male college student gains 15 lb or more during his freshman year What does the result suggest about the claim of the Freshman 15
Statistics
ProbabilityRachel invest in the stock market 0 100 her initial investment after 10 days 10 50 after 100 days it s 100 0 how long before the value reaches 25 of the original 100 investment what is the rate of change of her investment
Statistics
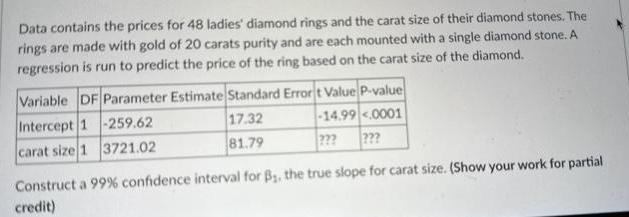
ProbabilityData contains the prices for 48 ladies diamond rings and the carat size of their diamond stones The rings are made with gold of 20 carats purity and are each mounted with a single diamond stone A regression is run to predict the price of the ring based on the carat size of the diamond Variable DF Parameter Estimate Standard Errort Value P value Intercept 1 259 62 17 32 14 99 0001 carat size 1 3721 02 81 79 Construct a 99 confidence interval for B the true slope for carat size Show your work for partial credit
Statistics
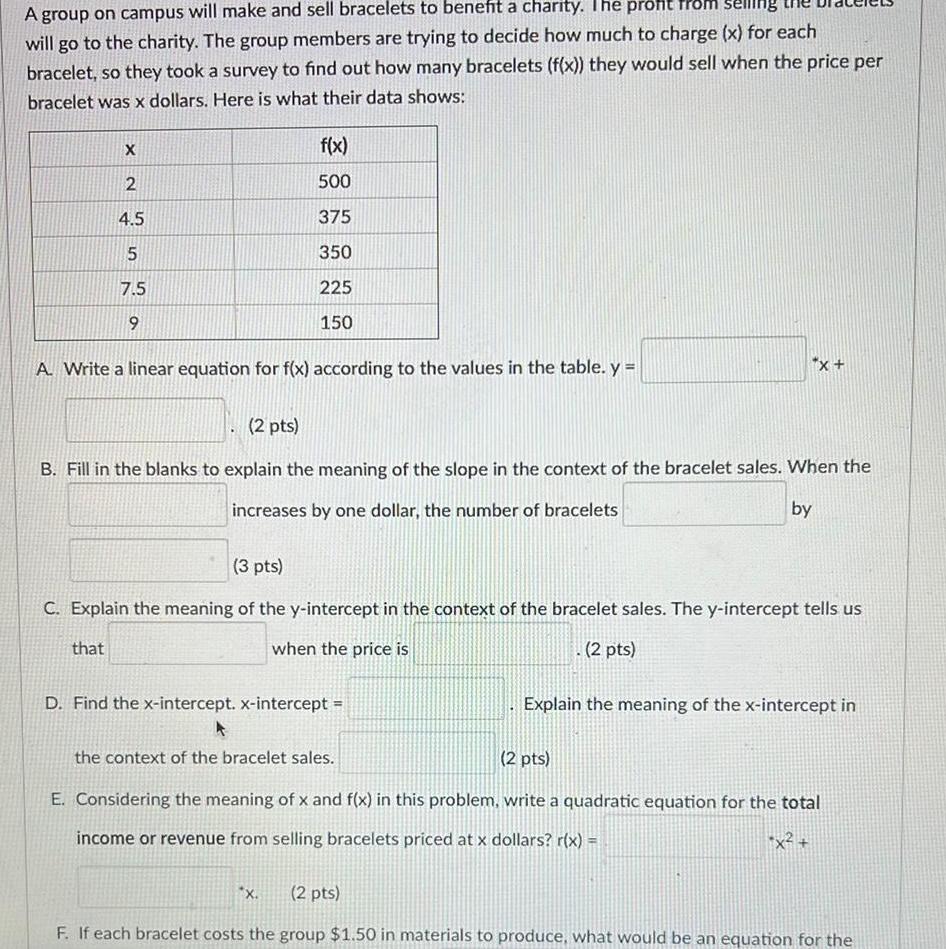
ProbabilityA group on campus will make and sell bracelets to benefit a charity The pront selling will go to the charity The group members are trying to decide how much to charge x for each bracelet so they took a survey to find out how many bracelets f x they would sell when the price per bracelet was x dollars Here is what their data shows X 2 4 5 5 7 5 9 f x 500 375 350 225 150 A Write a linear equation for f x according to the values in the table y 2 pts B Fill in the blanks to explain the meaning of the slope in the context of the bracelet sales When the increases by one dollar the number of bracelets by x 3 pts C Explain the meaning of the y intercept in the context of the bracelet sales The y intercept tells us that when the price is 2 pts D Find the x intercept x intercept x Explain the meaning of the x intercept in the context of the bracelet sales 2 pts E Considering the meaning of x and f x in this problem write a quadratic equation for the total income or revenue from selling bracelets priced at x dollars r x x 2 pts F If each bracelet costs the group 1 50 in materials to produce what would be an equation for the
Statistics
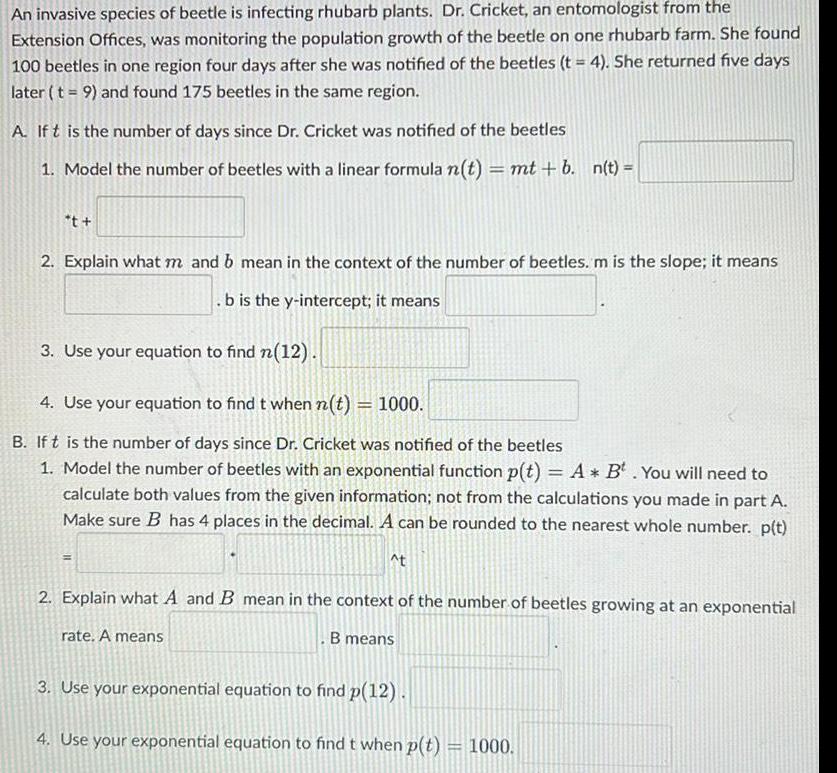
ProbabilityAn invasive species of beetle is infecting rhubarb plants Dr Cricket an entomologist from the Extension Offices was monitoring the population growth of the beetle on one rhubarb farm She found 100 beetles in one region four days after she was notified of the beetles t 4 She returned five days later t 9 and found 175 beetles in the same region A If t is the number of days since Dr Cricket was notified of the beetles 1 Model the number of beetles with a linear formula n t mt b n t t 2 Explain what m and b mean in the context of the number of beetles m is the slope it means b is the y intercept it means 3 Use your equation to find n 12 4 Use your equation to find t when n t 1000 B If t is the number of days since Dr Cricket was notified of the beetles 1 Model the number of beetles with an exponential function p t A B You will need to calculate both values from the given information not from the calculations you made in part A Make sure B has 4 places in the decimal A can be rounded to the nearest whole number p t t 2 Explain what A and B mean in the context of the number of beetles growing at an exponential rate A means B means 3 Use your exponential equation to find p 12 4 Use your exponential equation to find t when p t 1000
Statistics
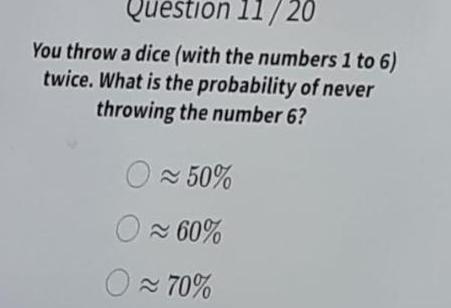
ProbabilityQuestion 11 20 You throw a dice with the numbers 1 to 6 twice What is the probability of never throwing the number 6 O 50 60 70
Statistics
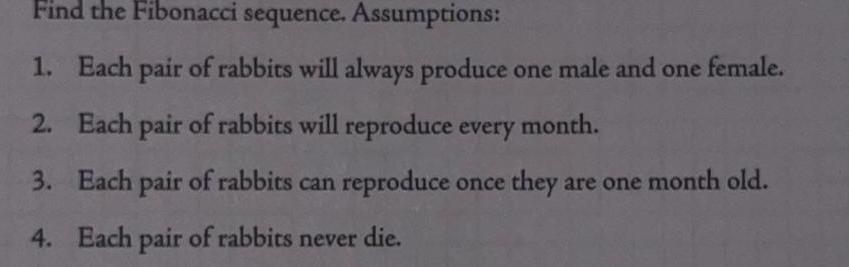
ProbabilityFind the Fibonacci sequence Assumptions 1 Each pair of rabbits will always produce one male and one female 2 Each pair of rabbits will reproduce every month 3 Each pair of rabbits can reproduce once they are one month old 4 Each pair of rabbits never die
Statistics
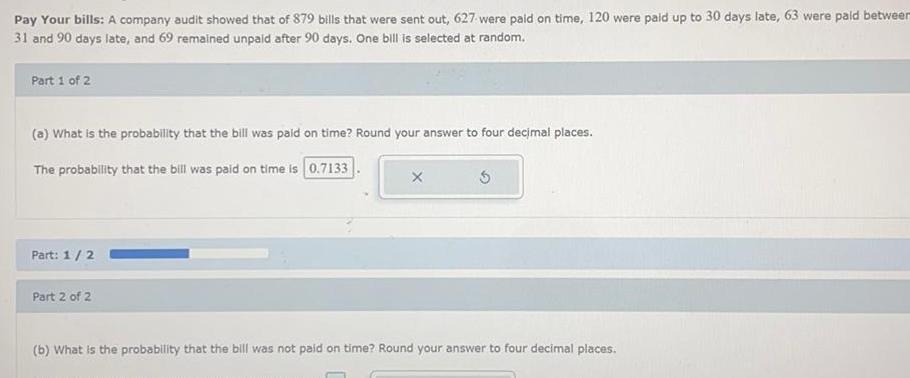
ProbabilityPay Your bills A company audit showed that of 879 bills that were sent out 627 were paid on time 120 were paid up to 30 days late 63 were paid between 31 and 90 days late and 69 remained unpaid after 90 days One bill is selected at random Part 1 of 2 a What is the probability that the bill was paid on time Round your answer to four decimal places The probability that the bill was paid on time is 0 7133 Part 1 2 Part 2 of 2 X b What is the probability that the bill was not paid on time Round your answer to four decimal places
Statistics
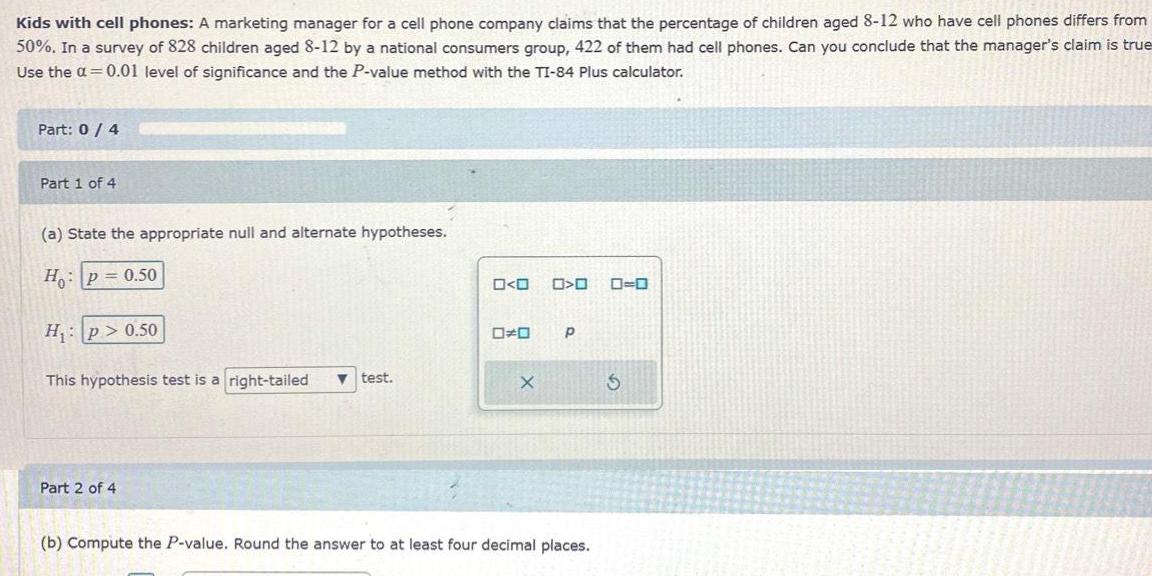
ProbabilityKids with cell phones A marketing manager for a cell phone company claims that the percentage of children aged 8 12 who have cell phones differs from 50 In a survey of 828 children aged 8 12 by a national consumers group 422 of them had cell phones Can you conclude that the manager s claim is true Use the a 0 01 level of significance and the P value method with the TI 84 Plus calculator Part 0 4 Part 1 of 4 a State the appropriate null and alternate hypotheses Ho P 0 50 H p 0 50 This hypothesis test is a right tailed test Part 2 of 4 O O 00 X 0 0 0 0 P b Compute the P value Round the answer to at least four decimal places
Statistics
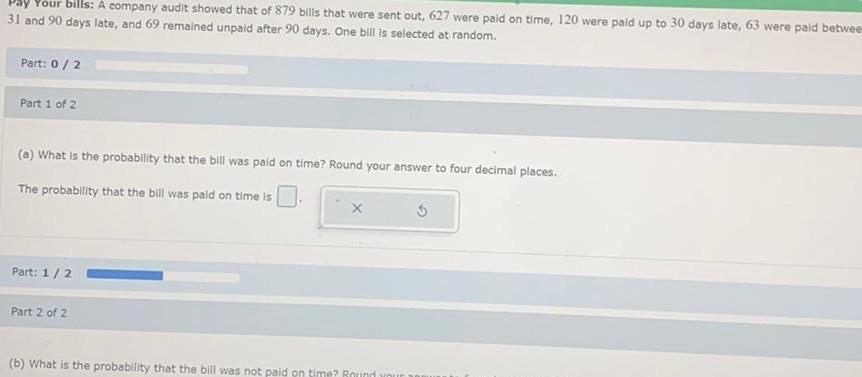
Probabilitybills A company audit showed that of 879 bills that were sent out 627 were paid on time 120 were paid up to 30 days late 63 were paid betwee 31 and 90 days late and 69 remained unpaid after 90 days One bill is selected at random Part 0 2 Part 1 of 2 a What is the probability that the bill was paid on time Round your answer to four decimal places The probability that the bill was paid on time is Part 1 2 Part 2 of 2 b What is the probability that the bill was not paid on time Round your a 3

Statistics
ProbabilityEmpathy The Interpersonal Reactivity Index is a survey designed to assess four different types of empathy One type of empathy called Empathetic Concern measures the tendency to feel sympathy and compassion for people who are less fortunate The index ranges from 0 less empathetic to 28 more empathetic The following data representing random samples of 10 males and 10 females are consistent with results reported in psychological studies Boxplots show that it is reasonable to assume that the populations are approximately normal Can you conclude that the mean empathy score for men is greater than the mean empathy score for women Let denote the mean empathy score for men Use the 0 01 level and the P value method with the TI 84 Plus calculator 26 23 21 23 Send data to Excel Part 1 of 4 Females 19 20 22 20 23 19 16 15 23 21 17 State the null and alternate hypotheses Ho H H H 0 Part 2 of 4 Males 18 22 Part 3 of 4 0 The hypothesis test is a right tailed test 25 15 20 Part 3 4 Compute the P value Round the answer to at least four decimal places P value 0 2025 Part 4 of 4 Determine whether to reject Ho We do not reject the null hypothesis Ho at the a 0 01 level