Probability Questions and Answers
Statistics
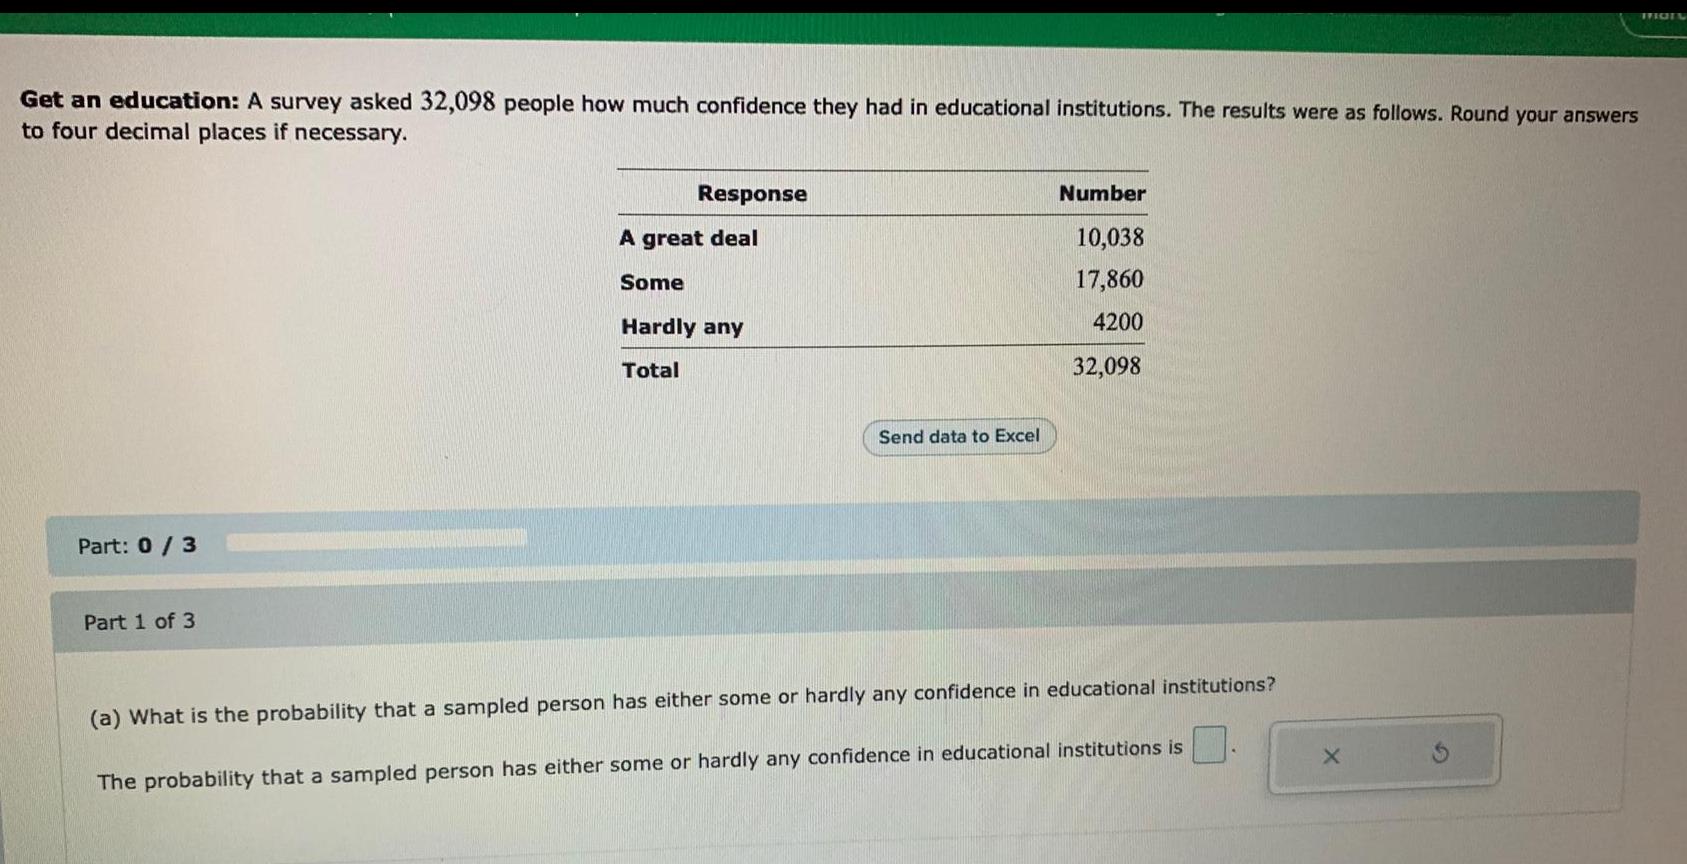
ProbabilityGet an education: A survey asked 32,098 people how much confidence they had in educational institutions. The results were as follows. Round your answers to four decimal places if necessary.
Part: 0/3
Part 1 of 3
Response Number
A great deal 10,038
Some 17,860
Hardly any 4200
Total 32,098
(a) What is the probability that a sampled person has either some or hardly any confidence in educational institutions?
The probability that a sampled person has either some or hardly any confidence in educational institutions is
Statistics
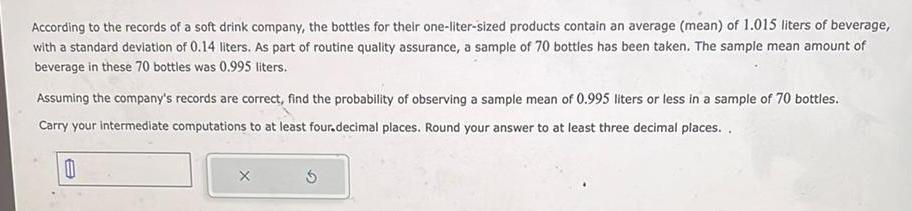
ProbabilityAccording to the records of a soft drink company, the bottles for their one-liter-sized products contain an average (mean) of 1.015 liters of beverage, with a standard deviation of 0.14 liters. As part of routine quality assurance, a sample of 70 bottles has been taken. The sample mean amount of beverage in these 70 bottles was 0.995 liters.
Assuming the company's records are correct, find the probability of observing a sample mean of 0.995 liters or less in a sample of 70 bottles.
Carry your intermediate computations to at least four.decimal places. Round your answer to at least three decimal places.
Statistics
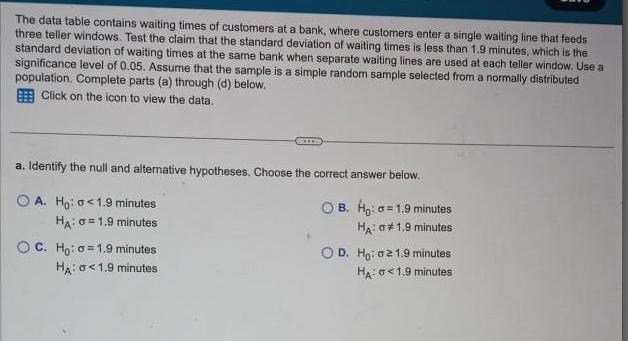
ProbabilityThe data table contains waiting times of customers at a bank, where customers enter a single waiting line that feeds three teller windows. Test the claim that the standard deviation of waiting times is less than 1.9 minutes, which is the standard deviation of waiting times at the same bank when separate waiting lines are used at each teller window. Use a significance level of 0.05. Assume that the sample is a simple random sample selected from a normally distributed population. Complete parts (a) through (d) below.
Click on the icon to view the data.
a. Identify the null and alternative hypotheses. Choose the correct answer below.
B. Ho: a=1.9 minutes
HA: #1.9 minutes
A. Ho: <1.9 minutes
HA: 0= 1.9 minutes
C. Ho: 1.9 minutes
HA: 0 < 1.9 minutes
D. Ho: 021.9 minutes
HA: 0 <1.9 minutes
Statistics
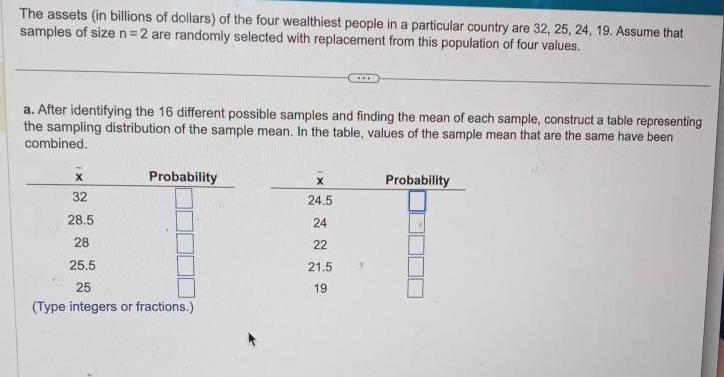
ProbabilityThe assets (in billions of dollars) of the four wealthiest people in a particular country are 32, 25, 24, 19. Assume that samples of size n=2 are randomly selected with replacement from this population of four values.
a. After identifying the 16 different possible samples and finding the mean of each sample, construct a table representing the sampling distribution of the sample mean. In the table, values of the sample mean that are the same have been combined.
Statistics
ProbabilityIn a science fair project, Emily conducted an experiment in which she tested professional touch therapists to see if they could sense her energy field. She flipped a coin to select either her right hand or her left hand, and then she asked the therapists to identify the selected hand by placing their hand just under Emily's hand without seeing it and without touching it. Among 327 trials, the touch therapists were correct 158 times. Complete parts (a) through (d).
a. Given that Emily used a coin toss to select either her right hand or her left hand, what proportion of correct responses would be expected if the touch therapists made random guesses?
(Type an integer or a decimal. Do not round.)
Statistics
ProbabilityThe overhead reach distances of adult females are normally distributed with a mean of 200 cm and a standard deviation of 8.3 cm.
a. Find the probability that an individual distance is greater than 209.30 cm.
b. Find the probability that the mean for 15 randomly selected distances is greater than 198.50 cm.
c. Why can the normal distribution be used in part (b), even though the sample size does not exceed 30?
a. The probability is.
(Round to four decimal places as needed.)
Statistics
ProbabilityAn airliner carries 200 passengers and has doors with a height of 75 in. Heights of men are normally distributed with a mean of 69.0 in and a standard deviation of 2.8 in. Complete parts (a) through (d)..
a. If a male passenger is randomly selected, find the probability that he can fit through the doorway without bending.
The probability is_________-
(Round to four decimal places as needed.)
Statistics
ProbabilityIf np 25 and nq 25, estimate P(fewer than 5) with n = 13 and p = 0.6 by using the normal distribution as an approximation to the binomial distribution; if np <5 or nq <5, then state that the normal approximation is not suitable.
Select the correct choice below and, if necessary, fill in the answer box to complete your choice.
A. P(fewer than 5) =
(Round to four decimal places as needed.)
B. The normal approximation is not suitable.
Statistics
ProbabilityA gender-selection technique is designed to increase the likelihood that a baby will be a girl. In the results of the gender-selection technique, 973 births consisted of 508 baby girls and 465 baby boys. In analyzing these results, assume that boys and girls are equally likely
a. Find the probability of getting exactly 508 girls in 973 births.
b. Find the probability of getting 508 or more girls in 973 births. It boys and girls are equally likely, is 508 girls in 973 births unusually high?
c. Which probability is relevant for trying to determine whether the technique is effective: the result from part (a) or the result from part (b)?
d. Based on the results, does it appear that the gender-selection technique is effective?
a. The probability of getting exactly 508 girls in 973 births is
(Round to four decimal places as needed)

Statistics
ProbabilitySuppose that the times taken for germination for cauliflower seeds are normally distributed with a mean of 6.9 days. Suppose also that exactly 70% of the cauliflower seeds germinate in 5.9 days or more. Find the standard deviation of times taken for germination for cauliflower seeds. Carry your intermediate computations to at least four decimal places. Round your answer to at least two decimal places.
Statistics
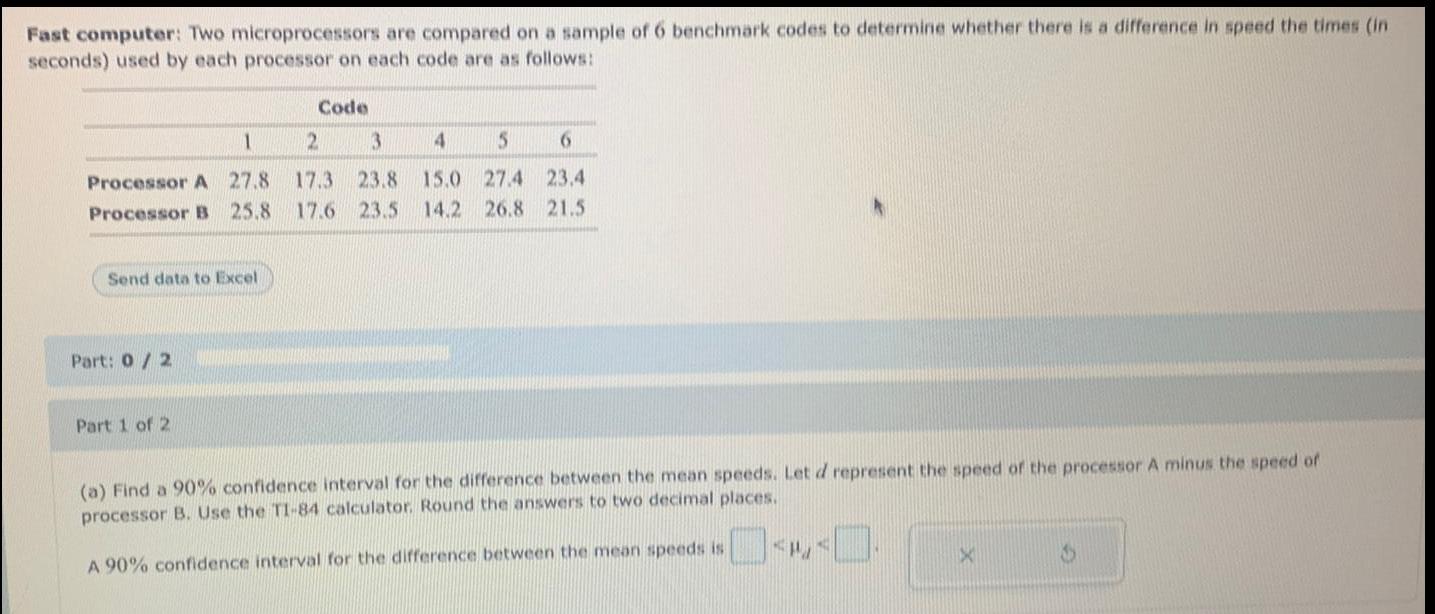
ProbabilityFast computer: Two microprocessors are compared on a sample of 6 benchmark codes to determine whether there is a difference in speed the times (in
seconds) used by each processor on each code are as follows:
Processor A 27.8
Processor B 25.8
Send data to Excel
Part: 0/2
Part 1 of 2
Code
17.3 23.8 15.0 27.4 23.4
17.6 23.5 14.2 26.8 21.5
(a) Find a 90% confidence interval for the difference between the mean speeds. Let d represent the speed of the processor A minus the speed of
processor B. Use the TI-84 calculator. Round the answers to two decimal places.
A 90% confidence interval for the difference between the mean speeds is
Statistics
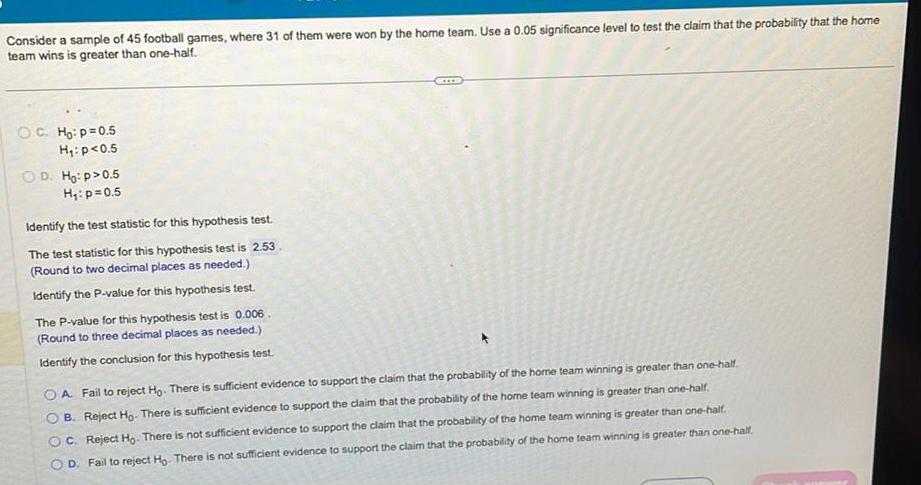
ProbabilityConsider a sample of 45 football games, where 31 of them were won by the home team. Use a 0.05 significance level to test the claim that the probability that the home
team wins is greater than one-half.
OC. Ho: p=0.5
H₁: p<0.5
D. Ho:p> 0.5
H₁: p=0.5
Identify the test statistic for this hypothesis test.
The test statistic for this hypothesis test is 2.53
(Round to two decimal places as needed.)
Identify the P-value for this hypothesis test.
The P-value for this hypothesis test is 0.006.
(Round to three decimal places as needed.)
Identify the conclusion for this hypothesis test.
OA Fail to reject Ho. There is sufficient evidence to support the claim that the probability of the home team winning is greater than one-half.
B. Reject Ho. There is sufficient evidence to support the claim that the probability of the home team winning is greater than one-half.
OC. Reject Ho. There is not sufficient evidence to support the claim that the probability of the home team winning is greater than one-half.
D. Fail to reject Ho. There is not sufficient evidence to support the claim that the probability of the home team winning is greater than one-half.
Statistics
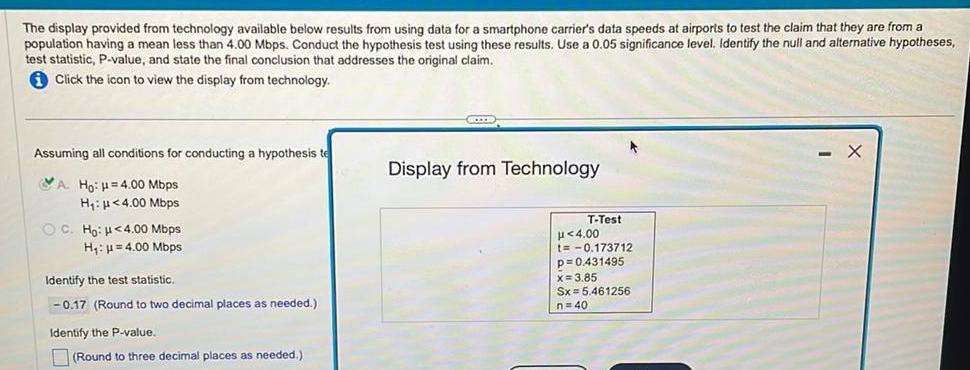
ProbabilityThe display provided from technology available below results from using data for a smartphone carrier's data speeds at airports to test the claim that they are from a
population having a mean less than 4.00 Mbps. Conduct the hypothesis test using these results. Use a 0.05 significance level. Identify the null and alternative hypotheses,
test statistic, P-value, and state the final conclusion that addresses the original claim.
Click the icon to view the display from technology.
Assuming all conditions for conducting a hypothesis te
A. Ho: H=4.00 Mbps
H₁: <4.00 Mbps
OC. Ho: <4.00 Mbps
H₁: =4.00 Mbps
Identify the test statistic.
-0.17 (Round to two decimal places as needed.)
Identify the P-value.
(Round to three decimal places as needed.)
GEXE
Display from Technology
T-Test
μ<4.00
t=-0.173712
p=0.431495
x= 3.85
Sx = 5.461256
n=40
Statistics
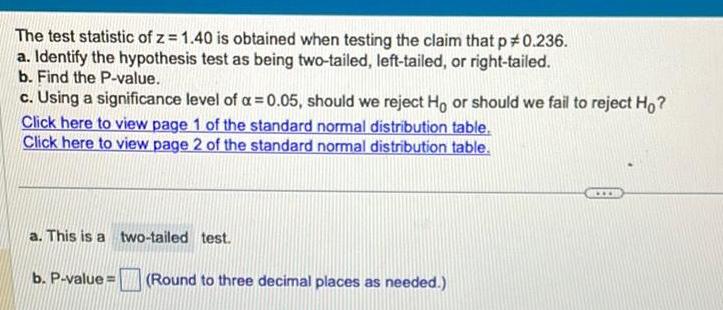
ProbabilityThe test statistic of z=1.40 is obtained when testing the claim that p #0.236.
a. Identify the hypothesis test as being two-tailed, left-tailed, or right-tailed.
b. Find the P-value.
c. Using a significance level of α = 0.05, should we reject Ho or should we fail to reject Ho?
a. This is a two-tailed test.
b. P-value=
(Round to three decimal places as needed.)
www.
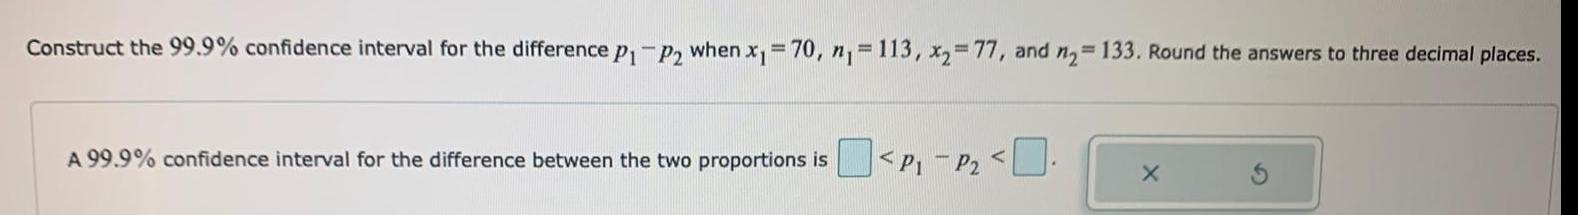
Statistics
ProbabilityConstruct the 99.9% confidence interval for the difference P₁-P₂ when x₁ =70, n₁ = 113, x₂=77, and n₂= 133. Round the answers to three decimal places.
A 99.9% confidence interval for the difference between the two proportions is
<P1 - p2<
Statistics
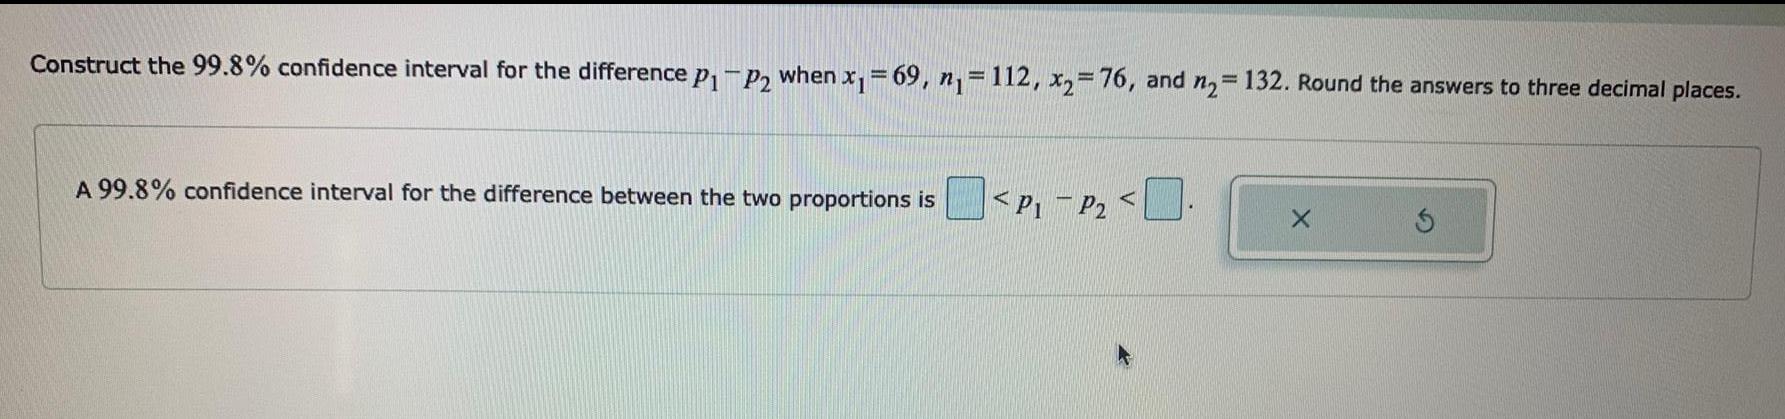
ProbabilityConstruct the 99.8% confidence interval for the difference P₁ P2 when x₁=69, n₁ = 112, x₂= 76, and n₂ = 132. Round the answers to three decimal places. A 99.8% confidence interval for the difference between the two proportions is
Statistics
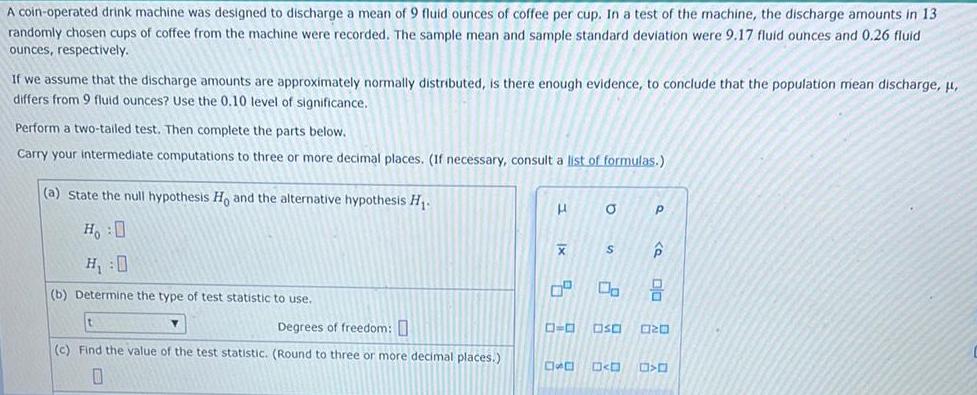
ProbabilityA coin-operated drink machine was designed to discharge a mean of 9 fluid ounces of coffee per cup. In a test of the machine, the discharge amounts in 13
randomly chosen cups of coffee from the machine were recorded. The sample mean and sample standard deviation were 9.17 fluid ounces and 0.26 fluid
ounces, respectively. If we assume that the discharge amounts are approximately normally distributed, is there enough evidence, to conclude that the population mean discharge, μ, differs from 9 fluid ounces? Use the 0.10 level of significance.
Perform a two-tailed test. Then complete the parts below.
Carry your intermediate computations to three or more decimal places. (If necessary, consult a list of formulas.)
(a) State the null hypothesis Ho and the alternative hypothesis H₁.
Ho :O
H₁:0
(b) Determine the type of test statistic to use.
Degrees of freedom:
(c) Find the value of the test statistic. (Round to three or more decimal places.)
Statistics
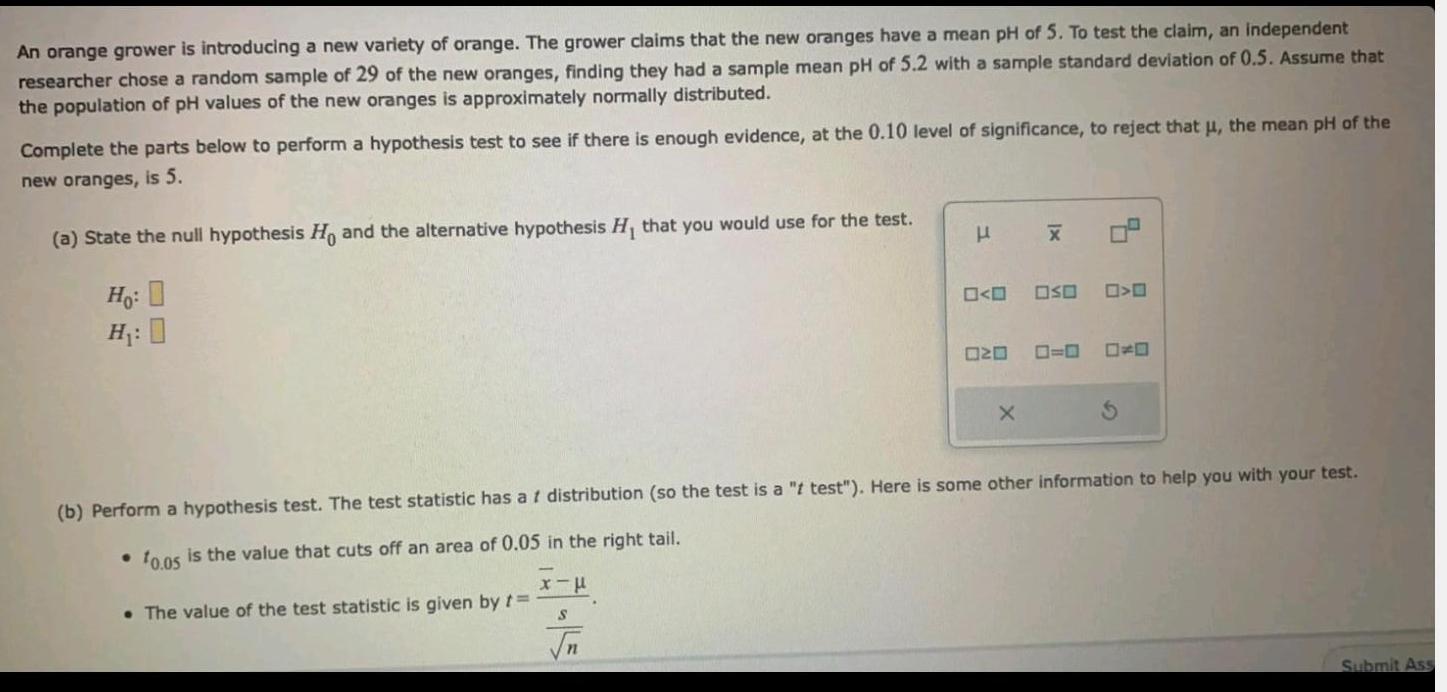
ProbabilityAn orange grower is introducing a new variety of orange. The grower claims that the new oranges have a mean pH of 5. To test the claim, an independent researcher chose a random sample of 29 of the new oranges, finding they had a sample mean pH of 5.2 with a sample standard deviation of 0.5. Assume that the population of pH values of the new oranges is approximately normally distributed. Complete the parts below to perform a hypothesis test to see if there is enough evidence, at the 0.10 level of significance, to reject that μ, the mean pH of the new oranges, is 5.
(a) State the null hypothesis Ho and the alternative hypothesis H₁ that you would use for the test. Ho: O H₁: 0
![Find the experimental probability that only 1 of 4 children in a family is a boy.
The problem has been simulated by tossing 4 coins (one to represent each child). Let "heads" represent a boy and "tails" represent a girl. A sample of 20 coin tosses is shown.
HTHH HTTH TTTT THTT HTHT
HHTT HHHT THHT HTTH TTHH
HTTT HTHT TTHH THTH HTHH
TTHT HTTT HTHT HHHT HHHH
Experimental Probability = [?]%](https://media.kunduz.com/media/sug-question/raw/79024143-1659991202.653712.jpeg?w=256)
Statistics
ProbabilityFind the experimental probability that only 1 of 4 children in a family is a boy.
The problem has been simulated by tossing 4 coins (one to represent each child). Let "heads" represent a boy and "tails" represent a girl. A sample of 20 coin tosses is shown.
HTHH HTTH TTTT THTT HTHT
HHTT HHHT THHT HTTH TTHH
HTTT HTHT TTHH THTH HTHH
TTHT HTTT HTHT HHHT HHHH
Experimental Probability = [?]%
Statistics
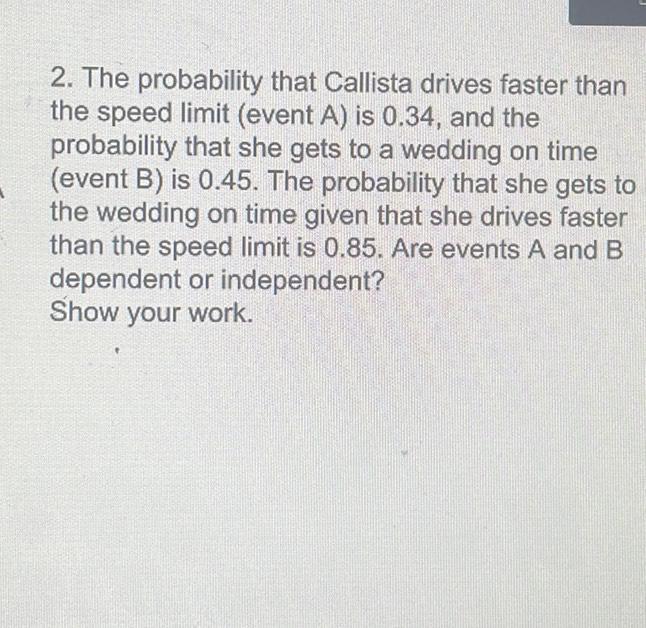
ProbabilityThe probability that Callista drives faster than the speed limit (event A) is 0.34, and the probability that she gets to a wedding on time (event B) is 0.45. The probability that she gets to the wedding on time given that she drives faster
than the speed limit is 0.85. Are events A and B dependent or independent?
Show your work.
Statistics
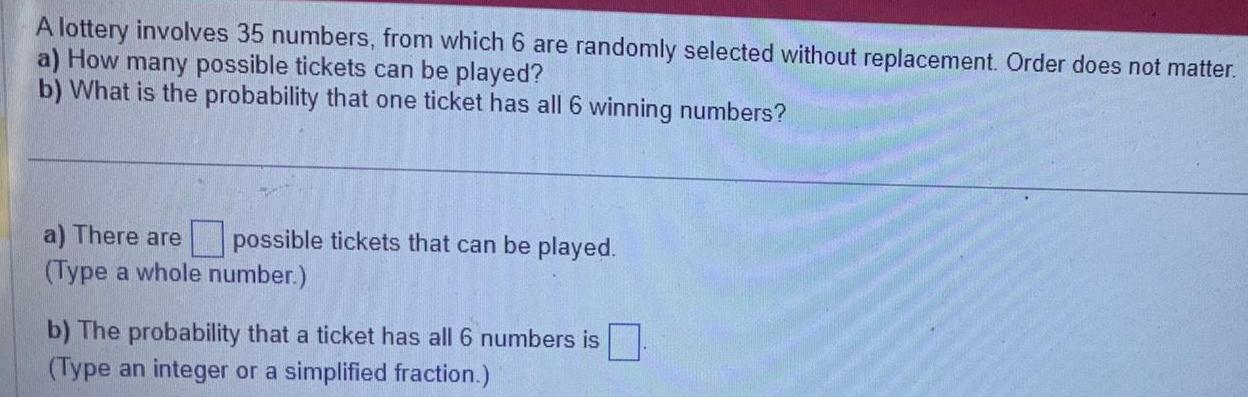
ProbabilityA lottery involves 35 numbers, from which 6 are randomly selected without replacement. Order does not matter.
a) How many possible tickets can be played?
b) What is the probability that one ticket has all 6 winning numbers?
a) There are ___ possible tickets that can be played.
(Type a whole number.)
b) The probability that a ticket has all 6 numbers is ___
(Type an integer or a simplified fraction.)
Statistics
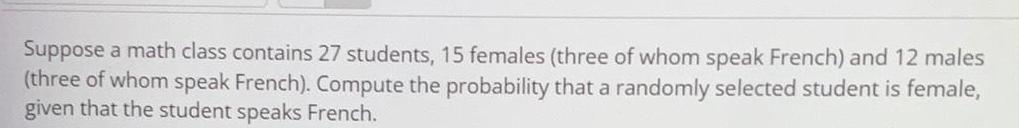
ProbabilitySuppose a math class contains 27 students, 15 females (three of whom speak French) and 12 males (three of whom speak French). Compute the probability that a randomly selected student is female, given that the student speaks French.
Statistics
ProbabilityA jar contains 8 red marbles, numbered 1 to 8, and 11 blue marbles numbered 1 to 11.
a) A marble is chosen at random. If you're told the marble is red, what is the probability that it has the number 7 on it?
b) The first marble is replaced, and another marble is chosen at random. If you're told the marble has the number 1 on it, what is the probability the marble is red?
Statistics
ProbabilityAmber rolls a 6-sided die. On her first roll, she gets a "3". She rolls again.
(a) What is the probability that the second roll is also a "3".
P(3 | 3) =
(b) What is the probability that the second roll is a "4".
P(4 | 3) =
Statistics
ProbabilityYou wish to conduct a hypothesis test to determine if there is a significant linear correlation between two variables.
You have a data set with 14 data pairs. You will conduct the test at a significance level of α = 0.01.
Find the critical value for this test.
Report answers accurate to three decimal places.

Statistics
ProbabilityTwo candy bowls contain red and green candies. The first bowl contains an even mix of red and green candies, while the second bowl contains 10% red and 90% green candies. A bowl is chosen, and a candy from that bowl is randomly selected. Suppose that whenever a red candy is chosen, it came from the first bowl 75.0% of the time. What is the probability that the first bowl is chosen?
The probability is ___
(Type an integer or decimal rounded to three decimal places as needed.)
Statistics
ProbabilityIf a procedure meets all of the conditions of a binomial distribution except the number of trials is not fixed, then the geometric distribution can be used. The probability of getting the first success on the xth trial is given by P(x) = p(1-p)^ X-1 where p is the probability of success on any one trial. Subjects are randomly selected for a health survey. The probability that someone is a universal donor (with group O and type Rh negative blood) is 0.06. Find the probability that the first subject to be a universal blood donor is the seventh person selected.
Statistics
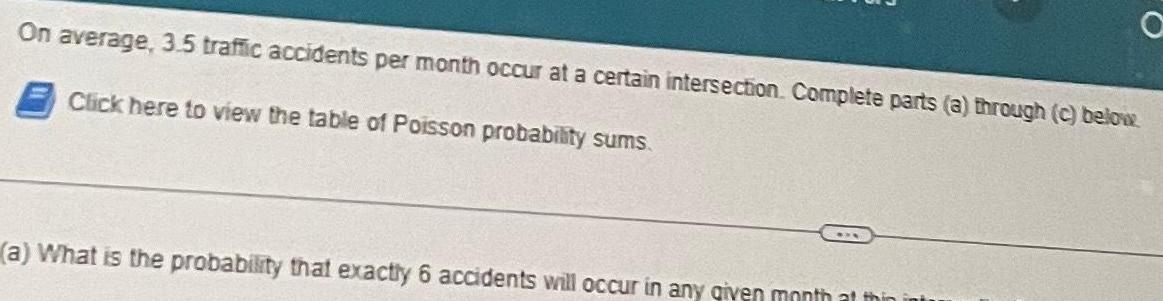
ProbabilityOn average, 3.5 traffic accidents per month occur at a certain intersection. Complete parts (a) through (c) below.
Click here to view the table of Poisson probability sums.
(a) What is the probability that exactly 6 accidents will occur in any given month at thin i
Statistics
ProbabilityFind the probability of a freshman being called on in class if there are 8 sophomores, 4 juniors, 12 seniors and 8 freshmen

Statistics
ProbabilityAssume that random guesses are made for nine multiple choice questions on an SAT test, so that there are n=9 trials, each with probability of success (correct) given by p=0.25 Find the indicated probability for the number of correct answers. Find the probability that the number x of correct answers is fewer than 4.
Statistics
ProbabilitySuppose X follows a continuous uniform distribution from 1 to 9. Determine the conditional probability P(X>2.5 | X≤7).
P(X>2.5|X≤7)=
(Simplify your answer.)
Statistics
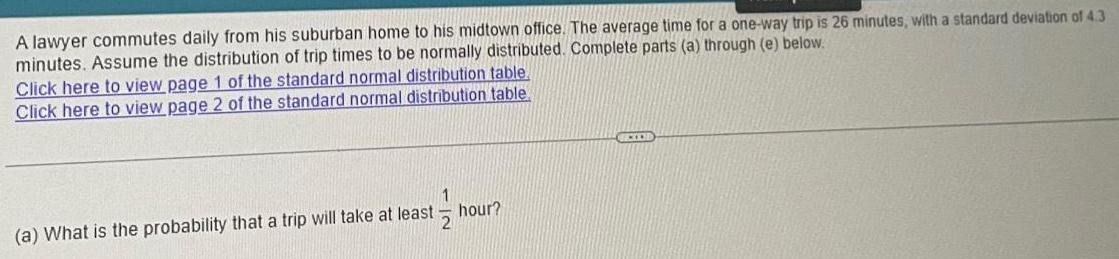
ProbabilityA lawyer commutes daily from his suburban home to his midtown office. The average time for a one-way trip is 26 minutes, with a standard deviation of 4.3 minutes. Assume the distribution of trip times to be normally distributed. Complete parts (a) through (e) below.
Click here to view page 1 of the standard normal distribution table.
Click here to view page 2 of the standard normal distribution table.
(a) What is the probability that a trip will take at least 1/2 hour?
Statistics
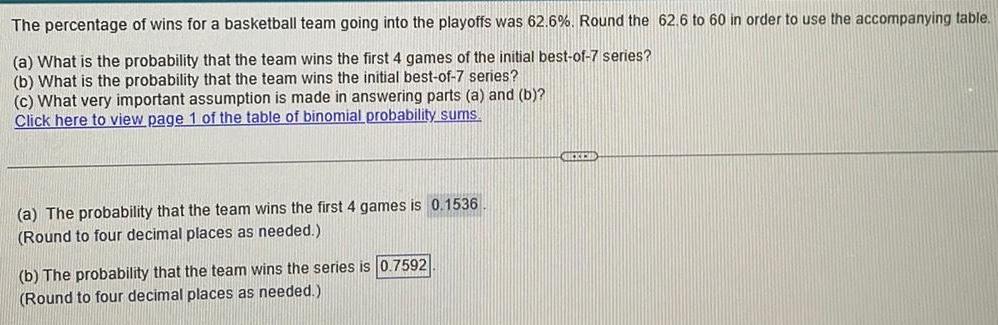
ProbabilityThe percentage of wins for a basketball team going into the playoffs was 62.6%. Round the 62.6 to 60 in order to use the accompanying table.
(a) What is the probability that the team wins the first 4 games of the initial best-of-7 series?
(b) What is the probability that the team wins the initial best-of-7 series?
(c) What very important assumption is made in answering parts (a) and (b)?
Click here to view page 1 of the table of binomial probability sums.
(a) The probability that the team wins the first 4 games is 0.1536
(Round to four decimal places as needed.)
(b) The probability that the team wins the series is 0.7592
(Round to four decimal places as needed.)
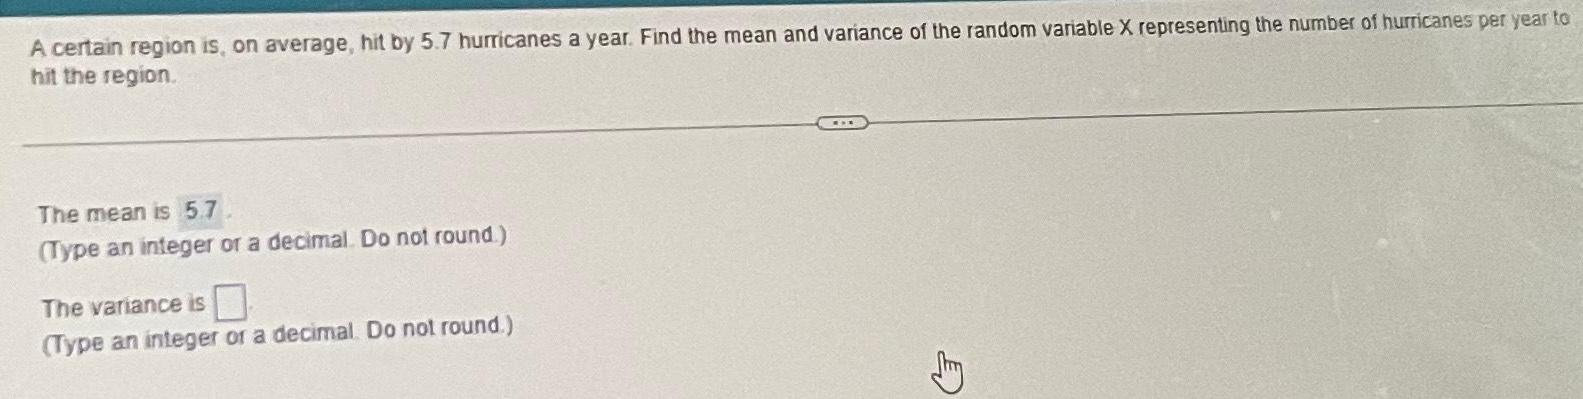
Statistics
ProbabilityA certain region is, on average, hit by 5.7 hurricanes a year. Find the mean and variance of the random variable X representing the number of hurricanes per year to hit the region.
The mean is 5.7
(Type an integer or a decimal. Do not round)
The variance is
(Type an integer or a decimal. Do not round.)
Statistics
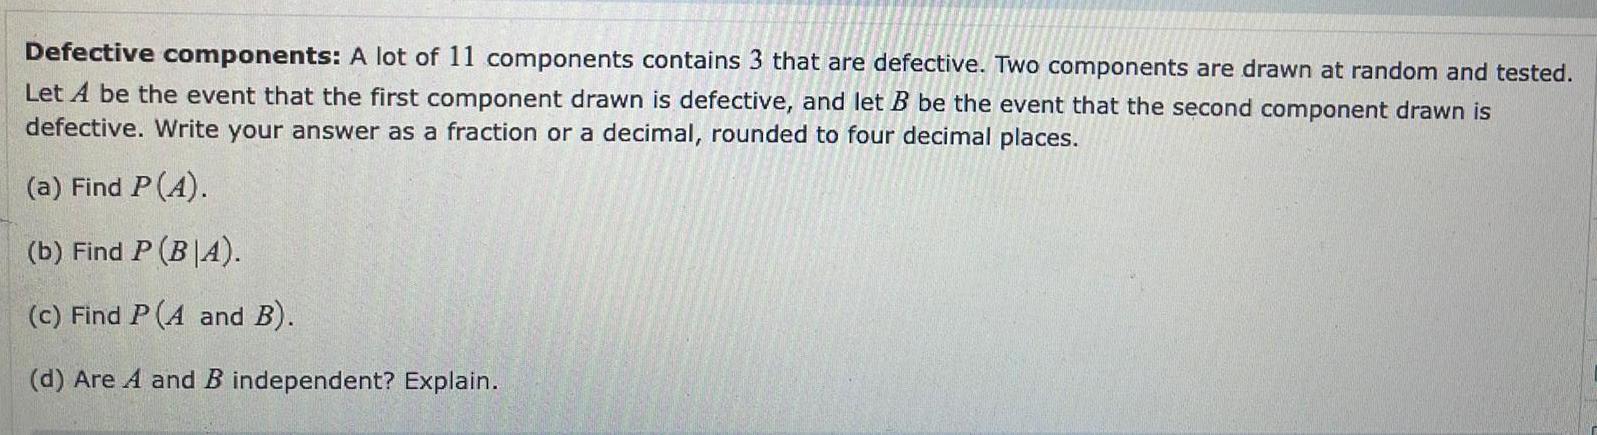
ProbabilityDefective components: A lot of 11 components contains 3 that are defective. Two components are drawn at random and tested.
Let A be the event that the first component drawn is defective, and let B be the event that the second component drawn is defective. Write your answer as a fraction or a decimal, rounded to four decimal places.
(a) Find P (A).
(b) Find P (BIA).
(c) Find P (A and B).
(d) Are A and B independent? Explain.
Statistics
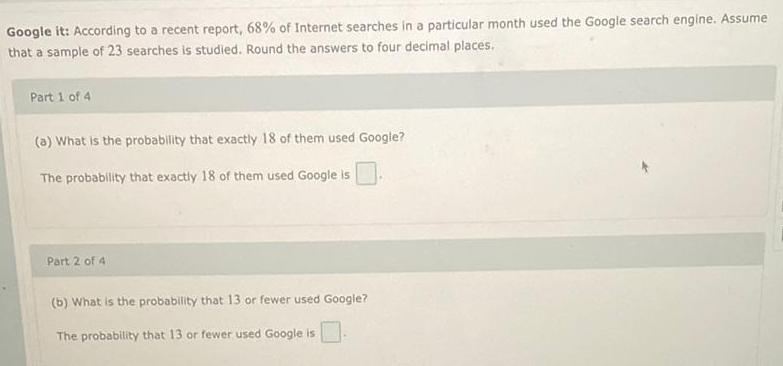
ProbabilityGoogle it: According to a recent report, 68% of Internet searches in a particular month used the Google search engine. Assume that a sample of 23 searches is studied. Round the answers to four decimal places.
Part 1 of 4
(a) What is the probability that exactly 18 of them used Google?
The probability that exactly 18 of them used Google is
Part 2 of 4
(b) What is the probability that 13 or fewer used Google?
The probability that 13 or fewer used Google is
Statistics
ProbabilityThe time needed to complete a math examination is bell-shaped with a mean of 120 minutes and a standard deviation of 10 minutes.
a) What percentage of students will complete the exam in 100 minutes or less? %
b) Assume that the class has 190 students and that the examination period is 140 minutes in length. How many students do you expect will not be able to complete the exam in the allotted time? Round answer to the nearest whole number.
c) A student is classified as extremely "efficient" if the amount of time spent on the exam is the lowest 2.5% for the distribution. What is the upper limit for the time it takes an extremely "efficient" student to finish the exam?
Statistics
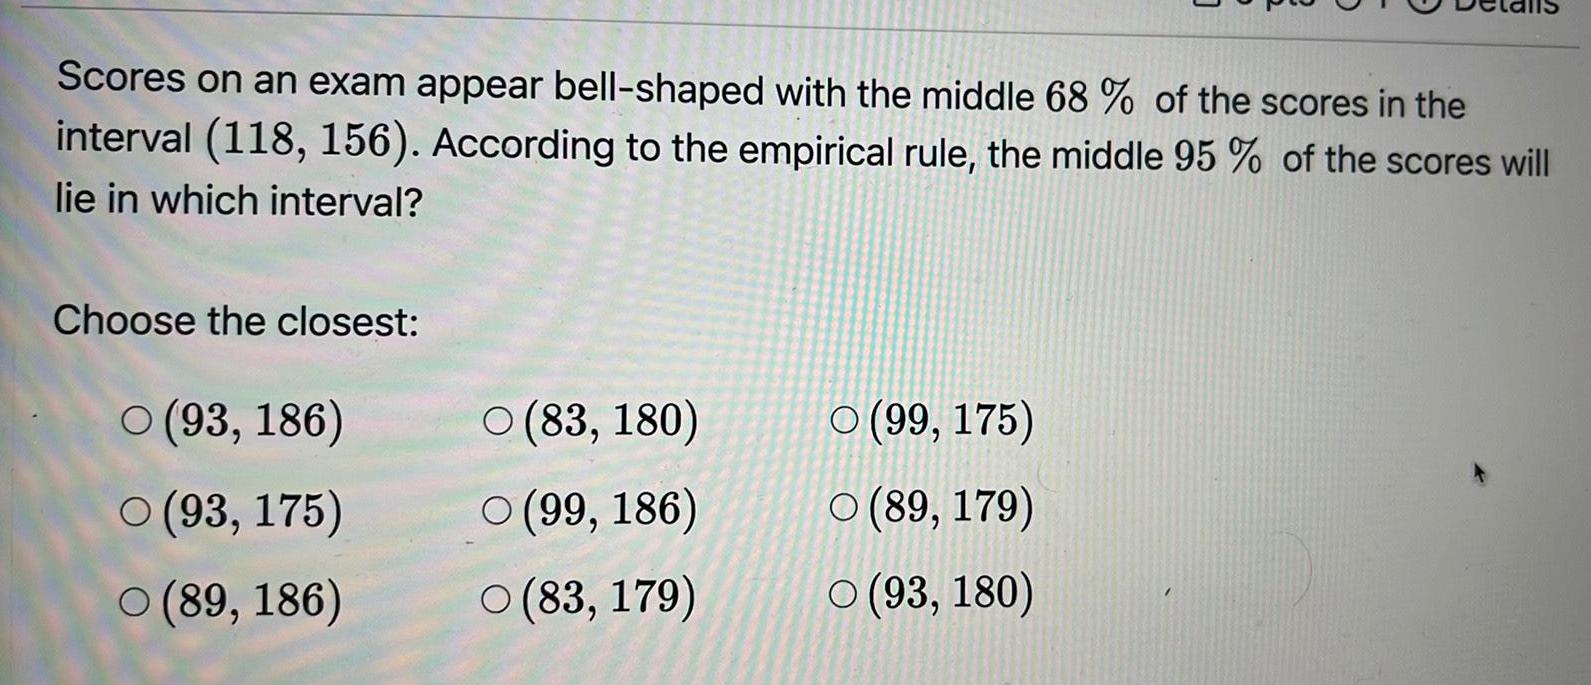
ProbabilityScores on an exam appear bell-shaped with the middle 68 % of the scores in the interval (118, 156). According to the empirical rule, the middle 95% of the scores will lie in which interval?
Choose the closest:
(93, 186)
(93, 175)
(89, 186)
(83, 180)
(99, 186)
(83, 179)
(99, 175)
(89, 179)
(93, 180)
Statistics
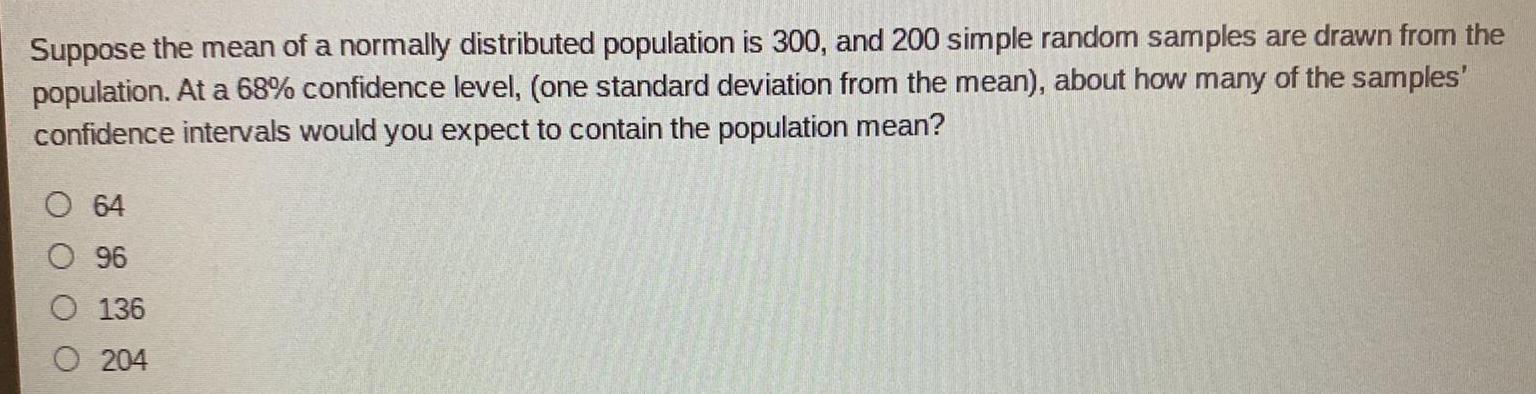
ProbabilitySuppose the mean of a normally distributed population is 300, and 200 simple random samples are drawn from the population. At a 68% confidence level, (one standard deviation from the mean), about how many of the samples' confidence intervals would you expect to contain the population mean?
64
96
136
204
Statistics
ProbabilityConsider the experiment where two, six-faced die are rolled at the same time. There are 36 possible outcomes for the experiment.
1.List all possible outcomes of the experiment. (20pt)
2.What is the probability of getting a sum of 11 in these outcomes? (20pt)
3.What is the probability of getting a sum less than or equal to 4? (20pt)
4.What is the probability of getting a sum of 13 or more? (20pt)
Statistics
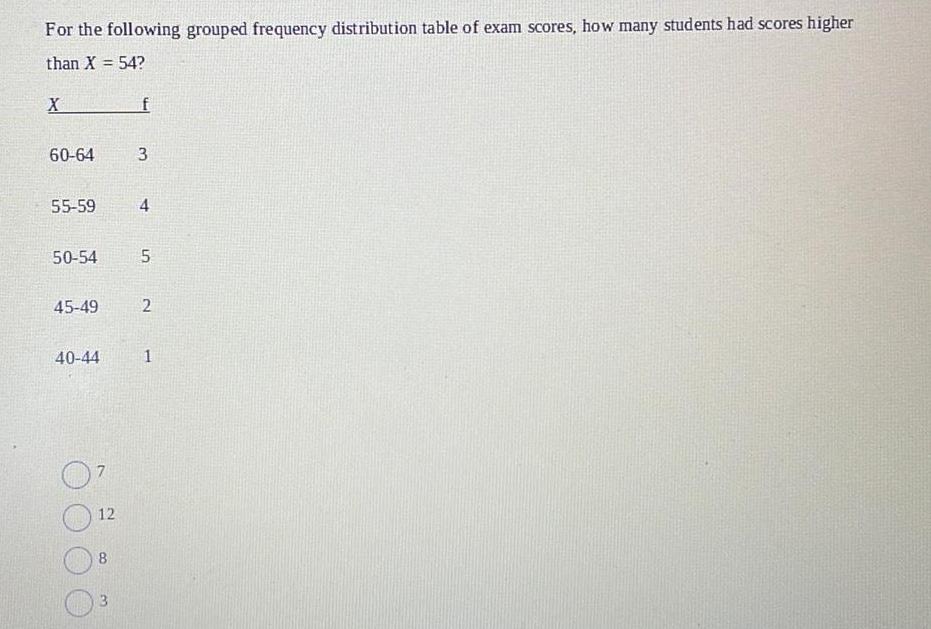
ProbabilityFor the following grouped frequency distribution table of exam scores, how many students had scores higher than X = 54?
X f
60-64 3
55-59 4
50-54 5
45-49 2
40-44 1
7
12
8
3
Statistics
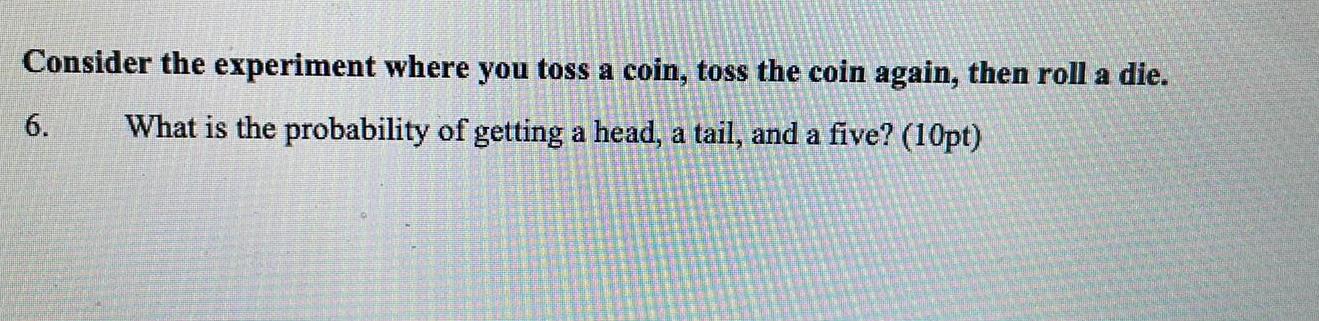
ProbabilityConsider the experiment where you toss a coin, toss the coin again, then roll a die.
6. What is the probability of getting a head, a tail, and a five? (10pt)
Statistics
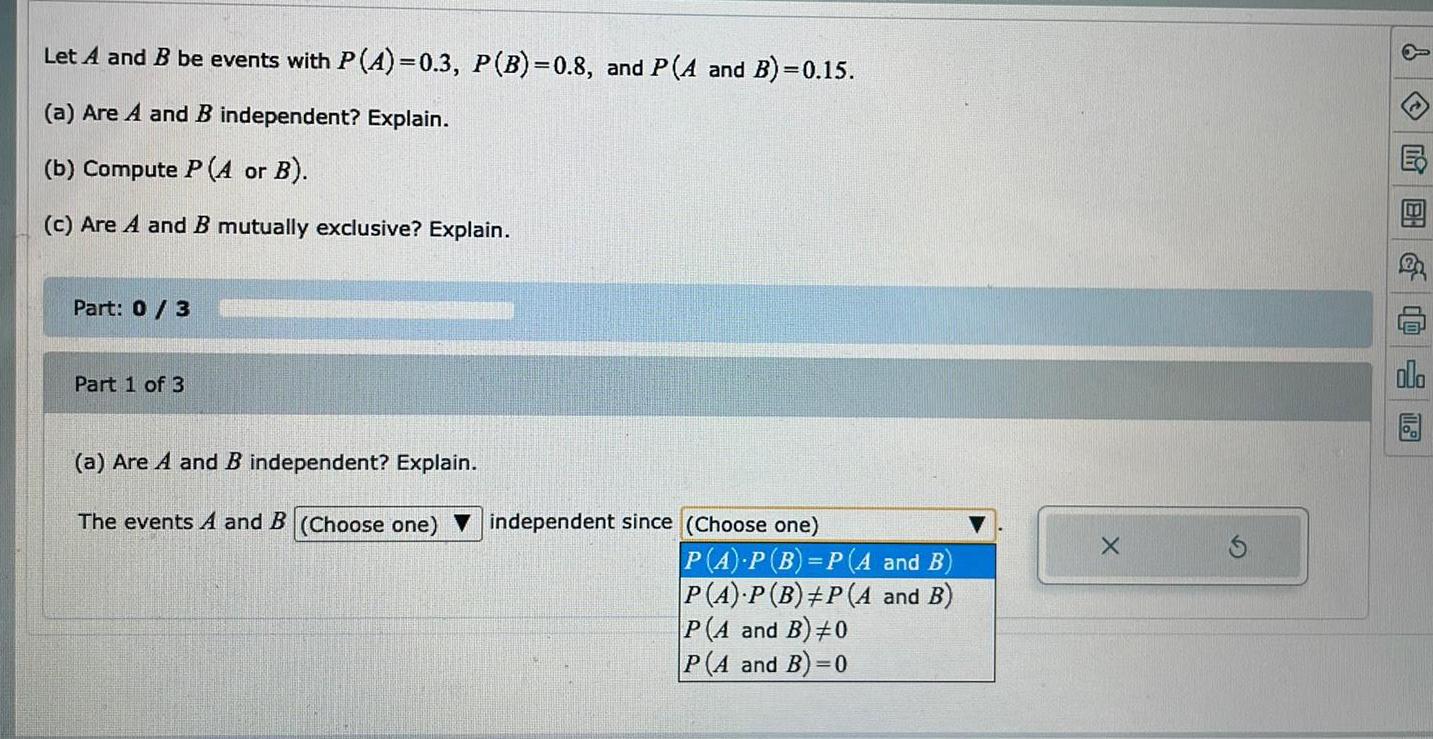
ProbabilityLet A and B be events with P (A)=0.3, P(B)=0.8, and P(A and B)=0.15.
(a) Are A and B independent? Explain.
(b) Compute P (A4 or B).
(c) Are A and B mutually exclusive? Explain.
Part: 0/3
Part 1 of 3
(a) Are A and B independent? Explain.
The events A and B (Choose one) ▼ independent since (Choose one)
PA) P(B)=P(A and B)
P(A) P (B) ≠P(A and B)
P(A and B) ≠0
P(A and B)=0
Statistics
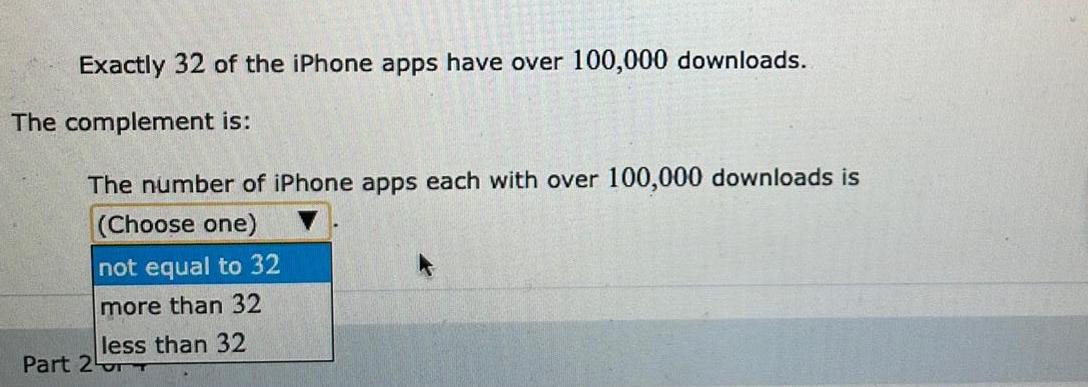
ProbabilityExactly 32 of the iPhone apps have over 100,000 downloads.
The complement is:
The number of iPhone apps each with over 100,000 downloads is
(Choose one)
not equal to 32
more than 32
less than 32
Statistics
ProbabilityBig bables: The National Health Statistics Reports described a study in which a sample of 325 one-year-old baby boys were weighed. Their mean weight was 24.9 pounds with standard deviation 5.3 pounds. A pediatrician claims that the mean weight of one-year-old boys is less than 25 pounds. Do the data provide convincing evidence that the pediatrician's claim is true? Use the a=0.10 level of significance and the P-value method with the TI-84 Plus calculator.
Statistics
ProbabilityBig babies: The National Health Statistics Reports described a study in which a sample of 325 one-year-old baby boys were weighed. Their mean weight was 24.9 pounds with standard deviation 5.3 pounds. A pediatrician claims that the mean weight of one-year-old boys is less than 25 pounds. Do the data provide convincing evidence that the pediatrician's claim is true? Use the a=0.10 level of significance and the P-value method with the TI-84 Plus calculator.
Statistics
ProbabilityFree dessert: In an attempt to increase business on Monday nights, a restaurant offers a free dessert with every dinner order. Before the offer, the mean number of dinner customers on Monday was 150. Following are the numbers of diners on a random sample of 12 days while the offer was in effect. Can you conclude that the mean number of dinners changed while the free dessert offer was in effect? Use the a=0.01 level of significance and the P-value method with the TI-84 Plus calculator.
185 148 170 131 191 118
121 130 153 189 171 131
Statistics
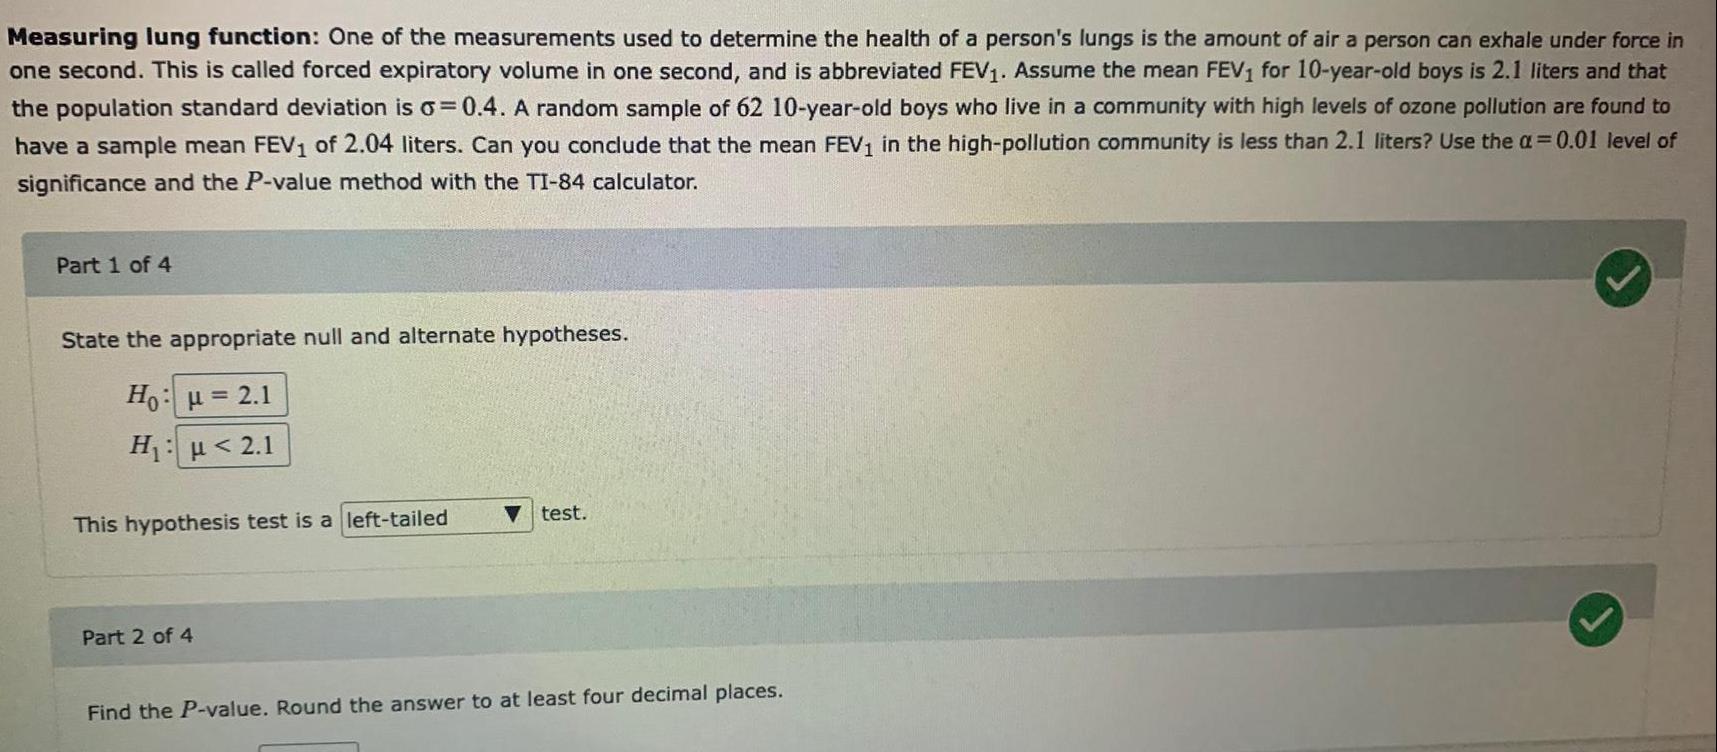
ProbabilityMeasuring lung function: One of the measurements used to determine the health of a person's lungs is the amount of air a person can exhale under force in one second. This is called forced expiratory volume in one second, and is abbreviated FEV₁. Assume the mean FEV₁ for 10-year-old boys is 2.1 liters and that the population standard deviation is o=0.4. A random sample of 62 10-year-old boys who live in a community with high levels of ozone pollution are found to have a sample mean FEV₁ of 2.04 liters. Can you conclude that the mean FEV₁ in the high-pollution community is less than 2.1 liters? Use the a=0.01 level of significance and the P-value method with the TI-84 calculator.
Part 1 of 4
State the appropriate null and alternate hypotheses.
Ho: μ = 2.1
H₁: μ <2.1
This hypothesis test is a left-tailed
Part 2 of 4
Find the P-value. Round the answer to at least four decimal places.
Statistics
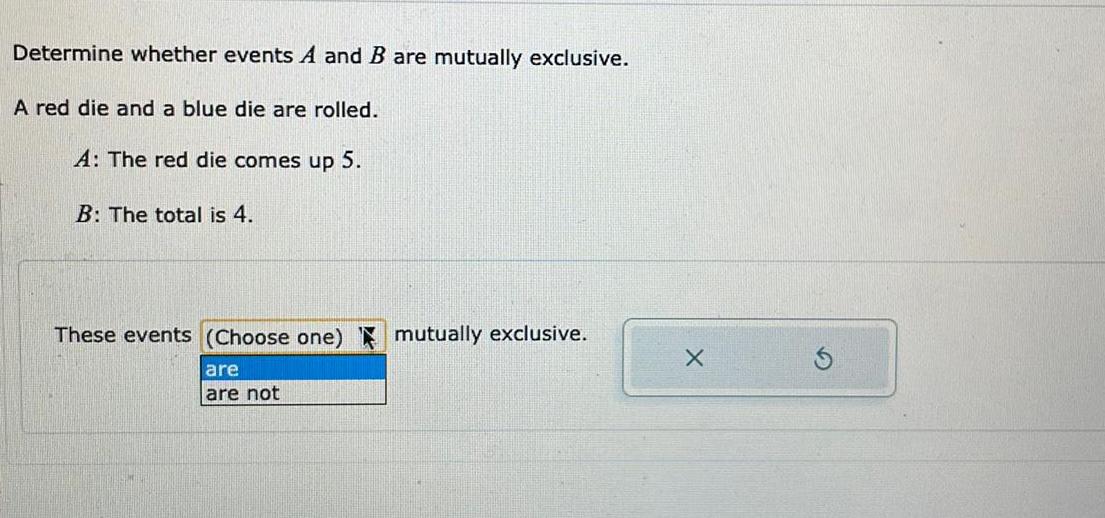
ProbabilityDetermine whether events A and B are mutually exclusive.
A red die and a blue die are rolled.
A: The red die comes up 5.
B: The total is 4.
These events (Choose one) mutually exclusive.
Statistics
ProbabilitySampling and Sampling Distributions (CTL): The College Board reported the following mean scores for the three parts of the Scholastic Aptitude Test (SAT) (The World Almanac): Critical Reading 502; Mathematics 515; Writing 494. Assume that the population standard deviation on each part of the test is sigma = 100. What is the probability that a random sample of 90 test takers will provide a sample mean test score within 10 points of the population mean of 502 on the Critical Reading part of the test?