Probability Questions and Answers

Statistics
ProbabilityIf two dice are rolled one time find the probability that the sum is 10 1 4 1 12 1 2 None of these answers

Statistics
ProbabilityGood credit The Fair Isaac Corporation FICO credit score is used by banks and other lenders to determine whether someone is a good credit risk Scores range from 300 to 850 with a score of 720 or more indicating that a person is a very good credit risk An economist wants to determine whether the mean FICO score is more than the cutoff of 720 She finds that a random sample of 120 people had a mean FICO score of 740 with a standard deviation of 90 Can the economist conclude that the mean FICO score is greater than 720 Use the a 0 05 level of significance and the P value method with the TI 84 Plus calculator Part 1 of 4 State the appropriate null and alternate hypotheses Ho 720 H H 720 This hypothesis test is a right tailed test Part 2 of 4 Compute the P value Round the answer to at least four decimal places P value 0 0075 Part 3 of 4 Determine whether to reject Ho Reject Part 3 4 Part 4 of 4 the null hypothesis Ho State a conclusion than the cutoff of 720

Statistics
ProbabilityCholesterol An article in the Archives of Internal Medicine reported that in a sample of 246 men 71 had elevated total cholesterol levels more than 200 milligrams per deciliter In a sample of 229 women 46 had elevated cholesterol levels Can you conclude that the proportion of men with elevated cholesterol levels is greater than the proportion of women with elevated cholesterol levels Let p denote the proportion of men with elevated cholesterol levels and P denote the proportion of women with elevated cholesterol levels Use the a 0 01 level of significance and the P value method with the TI 84 Plus calculator Part 1 of 4 State the null and alternate hypotheses Ho P P H P P This hypothesis test is a right tailed Part 1 4 Part 2 of 4 test

Statistics
ProbabilityLottery In the New York State Numbers lottery you pay 3 and can bet that the sum of the numbers that come up is 13 The probability of winning is 0 09 and if you win you win 9 50 which is a profit of 6 5 If you lose you lose 3 Part 1 of 2 a What is the expected value of your profit Round the answer to two decimal places The expected value of profit is 2 15 Part 1 2 Part 2 of 2 b Is it an expected gain or an expected loss Round the answer to two decimal places This is an expected Choose one of S

Statistics
ProbabilityFind the total return earned by the given bond Annual Interest Rate 5 9 Face Value 15 000 OA 885 OB 4 425 OC 442 500 OD 88 500 Term to Maturity 5 years

Statistics
Probability5 points Suppose you needed to test the claim that the two samples described below come from populations with the same mean Assume that the samples are independent simple random samples Sample 1 n 18 x 27 3 s 9 05 Sample 2 m 3 x 22 6 sy 8 62 Find a The test statistic is b The estimated degree of freedom is

Statistics
ProbabilityLet M and N be two events such that P M 0 41 and P N 0 48 Do not round your responses a Determine P MUN given that M and N are independent b Determine P MUN given that M and N are mutually exclusive

Statistics
ProbabilityWe have a deck of 8 cards numbered from 1 to 8 Some are grey and some are white The cards numbered 5 6 and 7 are grey The cards numbered 1 2 3 4 and 8 are white A card is drawn at random Let X be the event that the drawn card is grey and let P X be the probability of X Let not X be the event that the drawn card is not grey and let P not X be the probability of not X a For each event in the table check the outcome s that are contained in the event Then in the last column enter the probability of the event Event X not X b Subtract 1 2 3 1 P not X P X Outcomes 00000000 4 5 6 7 8 P not X 3000 c Select the answer that makes the sentence true 1 P not X is the same as Probability P X P not X 1 2 3 4 5 6 7

Statistics
ProbabilityBill wants to find the average height of students in the 11 grade at East High School So he will use the heights of S th students in the 11th grade to find the average height Answer the questions below a Which unit s could be used for the unit of measurement Check all that apply kilograms milligrams centimeters grams millimeters b Which of the procedures below would be the best way to find the average height Ask for 50 volunteers from the 11 grade to state their own heights th Measure the heights of 50 volunteers from the 11 th Randomly pick 50 students from the 11 Randomly pick 50 students from the 11 grade grade and measure their heights grade and have them state their own heights

Statistics
ProbabilityThere are 8 acts in a talent show A comedian a dancer a guitarist a juggler a magician a pianist a singer and a violinist A talent show host randomly schedules the 8 acts Compute the probability of each of the following events Event A The magician is first the violinist is second and the juggler is third Event B The first three acts are the dancer the comedian and the singer in any order Write your answers as fractions in simplest form P A P B

Statistics
ProbabilityA box has 3 blue and 3 green jelly beans A bag has 7 blue and 2 green jelly beans A jelly bean is selected at random from the box and placed in the bag Then a jelly bean is selected at random from the bag If a green jelly bean is selected from the bag what is the probability that the transferred jelly bean was green Round your answer to three decimal places

Statistics
ProbabilityThe mean SAT verbal score is 419 with a standard deviation of 96 Use the Empirical Rule to determine what percent of the scores lie between 227 and 515 Assume the data set has a bell shaped distribution 83 9 68 34 81 5

Statistics
ProbabilityThe mean score of a placement exam for entrance into a math class is 80 with a standard deviation of 10 Use the Empirical Rule to find the percentage of scores that lie between 60 and 80 Assume the data set has a bell shaped distribution O 47 5 95 34 68

Statistics
ProbabilityContaminated water In a sample of 44 water specimens taken from a construction site 27 contained detectable levels of lead Part 0 3 Part 1 of 3 a Construct a 95 confidence interval for the proportion of water specimens that contain detectable levels of lead Round the answer to at least thre decimal places A 95 confidence interval for the proportion of water specimens that contain detectable levels of lead is p

Statistics
ProbabilityInternet service An Internet service provider sampled 550 customers and found that 72 of them experienced an interruption in high speed service during the previous month Part 0 3 Part 1 of 3 a Find a point estimate for the population of all customers who experienced an interruption Round the answer to at least three decimal places The point estimate for the population proportion of all customers who experienced an interruption is

Statistics
Probabilityx P x 0 3 Part 1 of 6 Send data to Excel Part 2 of 6 the Humber of tires with low air pressure on a randomly chosen car The probability distribution of X is as follows 2 3 4 a Find P 2 P 2 0 2 01 Part 5 of 6 0 1 Part 5 6 b Find P Greater than or equal to 2 P Greater than or equal to 2 0 6 Part 6 of 6 0 2 0 2 d Find the probability that no tires have low air pressure The probability that no tires have low air pressure is 0 3 e Compute the mean y x 1 9 0 2

Statistics
ProbabilityCollege bound A national college researcher reported that 67 of students who graduated from high school in 2012 enrolled in college Twenty nine high school graduates are sampled Part 1 of 2 a What is the mean number who enroll in college in a sample of 29 high school graduates Round the answer to two decimal places The mean number who enroll in college in a sample of 29 high school graduates is Part 2 of 2 X b What is the standard deviation of the number who enroll in college in a sample of 29 high school graduates Round the answer to four decimal places The standard deviation of the number who enroll in college in a sample of 29 high school graduates is

Statistics
ProbabilityDefective components A lot of 10 components contains 2 that are defective Two components are drawn at random and tested Let A be the event that the first component drawn is defective and let B be the event that the second component drawn is defective Write your answer as a fraction or a decimal rounded to four decimal places a Find P 4 b Find P BIA c Find P A and B d Are A and B independent Explain

Statistics
ProbabilityThe probability that a certain make of car will need repairs in the first eight months is 0 5 A dealer sells five such cars What is the probability that at least or of them will require repairs in the first eight months Round your final answer to four decimal places P At least one car will require repairs G

Statistics
ProbabilityComputer purchases Out of 775 large purchases made at a computer retailer 329 were personal computers 389 were laptop computers and 57 wen printers As a part of an audit one purchase record is sampled at random Round the answers to four decimal places as needed a What is the probability that it is a laptop computer b What is the probability that it is not a printer Part 1 of 2 a What is the probability that it is a laptop computer The probability that it is a laptop computer is Part 2 of 2 b What is the probability that it is not a printer 5


Statistics
ProbabilityA Question 12 1 point Retake question Your sock drawer has six white socks six brown socks and six black socks You randomly pick a sock and put it on your left foot and then pick another sock and put it on your right foot You leave the house with a white sock on your left foot and a brown sock on your right foot 02 0 118 17 16 64 169 0 063 49 225 0 379 0 218

Statistics
ProbabilityA bag contains eight red marbles and three blue marbles You randomly pick a marble and then return it to the bag before picking another marble Both the first and second marbles are red 4 15 0 267 210 529 120 083 49 169 0 29

Statistics
ProbabilityA Question 11 1 point Retake question You flip a coin and then roll a fair six sided die The coin lands tails up and the die shows an odd number 15 64 9 100 0 234 56 225 0 09 0 249

Statistics
ProbabilityThere are seven nickels and six dimes in your pocket You randomly pick a coin out of your pocket and then return it to your pocket Then you randomly pick another coin The first coin is a nickel and the second coin is a dime Independent Dependent

Statistics
ProbabilityA Question 9 1 point Retake question You flip a coin twice The first flip lands heads up and the second flip also lands heads up 17 0 059 05 0 278 18 00 25 0 182

Statistics
ProbabilityIf A and B are any two events resulting from some chance process P A or B P A multiplication rule for independent events P B P A and B True False

Statistics
ProbabilityStudents at a university are classified according to major The administration randomly selects five majors All students majoring in those five areas are surveyed What type of sample is this

Statistics
ProbabilityThe Soft Landing video game company is about to release a new flight simulator game If the game is more likely to sell to more than 10 of all video game buyers the company will make 500 000 copies If it is less than 10 the company will make 200 000 copies Soft Landing sends an e mails survey to everyone who bought their previous flight simulator game Of 400 people who responded to the survey 80 said they were very likely to buy the new game Based on the results of the survey the Soft Landing company makes 500 000 copies of the game Was this a good decision Explain why it is a good decision or if not suggest a better way to gather information

Statistics
ProbabilityIn Tony s cooler there are 6 bottles of soda and 8 bottles of water Tony is going to choose 8 bottles at random from the cooler to give to his friends What is the probability that he will choose 3 sodas and 5 waters Round your answer to three decimal places

Statistics
Probability4 At Choo Choo Mike s toy store there are 100 toys that are randomly selected Out of those 100 12 of them are defective What is the probability if you randomly choose three toys that two of them are defective Show your work

Statistics
ProbabilityFind the APR true annual interest rate to the nearest 0 01 for the loan given below Purchase Add On Interest Rate Price 4150 4 0 Down Payment 320 Number of Payments 12 The APR for the loan amount is Type an integer or decimal rounded to the nearest hundredth as needed

Statistics
ProbabilityIn the US 44 of households subscribe to a cable service Assume that 200 homes are randomly surveyed Let x the number that subscribe to a cable service Assume that households are independent What is the probability that fewer than 75 of the households subscribe to a cable service Round your answer to 4 decimal places

Statistics
ProbabilityGiven a random measurement process (X) with a population mean u of 12 and population standard deviation o of 1.5, perform the following calculations while assuming that the underlying random process is Gaussian:
a. Give the probability that the next measurement x; is between 8 and 10 (i.e., P(8<X<10))
b. Give the probability that the next measurement x; is greater than 13 (i.e., P(X>12))
c. What is the precision error of this measurement process? Another way to ask this is question is "what interval would you expect the next measurement, or prediction interval, with a 95% confidence?"

Statistics
ProbabilityPlastic parts produced by an injection-molding operation are checked for conformance to specifications. Each tool contains 11 cavities in which parts are produced, and these parts fall into a conveyor when the press opens. An inspector chooses 1 part(s) from among the 11 at random. Three cavities are affected by a temperature malfunction that results in parts that do not conform to specifications. Round your answers to four decimal places.
(a) What is the probability that the inspector finds exactly one nonconforming part?
(b) What is the probability that the inspector finds at least one nonconforming part?

Statistics
ProbabilityIn a manufacturing operation, a part is produced by machining, polishing, and painting. If there are four machine tools, four polishing tools, and three painting tools, how many different routings (consisting of machining, followed by polishing, and followed by painting) for a part are possible?

Statistics
ProbabilityA credit card contains 16 digits between 0 and 9. However, only 100 million numbers are valid. If a
number is entered randomly, what is the probability that it is a valid number?
Probability = 1/10k, where k =

Statistics
ProbabilityLet p and q represent the following simple statements.
p: You are human.
q: You have a tail.
Write the following compound statement in symbolic form.
Being human is necessary for not having a tail.
The compound statement written in symbolic form is

Statistics
ProbabilityThere are 8 acts in a talent show.
An acrobat, a comedian, a dancer, a magician, a pianist, a singer, a violinist, and a whistler.
A talent show host randomly schedules the 8 acts.
Compute the probability of each of the following events.
Event A: The first three acts are the dancer, the magician, and the acrobat, in any order.
Event B: The acrobat is first, the violinist is second, and the dancer is third.
Write your answers as fractions in simplest form.

Statistics
ProbabilityThere are 7 streets to be named after 7 tree types.
Ash, Birch, Cedar, Oak, Pine, Spruce, and Willow.
A city planner randomly selects the street names from the list of 7 tree types.
Compute the probability of each of the following events.
Event A: The first four streets are Ash, Spruce, Oak, and Birch, without regard to order.
Event B: The first street is Spruce, followed by Birch then Pine, and then Ash.
Write your answers as fractions in simplest form.

Statistics
ProbabilityA number from 1-72 is chosen at random. Find each probability as a fraction (in simplest form). decimal, and percent.
a) P(multiple of 9)
b) P(odd or at most 16)
c) P(factor of 72 and even)
d) P(not a perfect square)

Statistics
ProbabilityMary noticed 5 ants in her pantry on Monday. On Tuesday she counted 15 ants in the pantry. On Wednesday she counted 45 ants in the pantry.
Does this problem situation follow a mathematical model of exponential growth or decay?
GROWTH, because the a value is more than
GROWTH/ because the b value is more than 1
DECAY, because the a value is less than 1
DECAY because the b value is less than 1

Statistics
ProbabilityUse the graph above to answer the following questions:
How is the data in the graph distributed? Symmetrically, skewed left, or skewed right?
Approximate the total number of people polled using the graph.
Estimate the probability that person chosen at random from this poll is under 60 years of age. Write your answer as a whole percentage.

Statistics
ProbabilityA colony of wasps is growing at a rate of 32% each week. If the colony started with just 4 wasps, which of the following models would approximate the number of wasps in the
colony for any given week?
4x + 1.32
4(1.32)x
4(0.32)x
0.32x + 4
none of these

Statistics
ProbabilityIf np≥5 and nq≥5, estimate P(more than 7) with n= 13 and p=0.3 by using the normal distribution as an approximation to the binomial distribution; if np < 5 or nq <5, then state that the normal approximation is not suitable.
Select the correct choice below and, if necessary, fill in the answer box to complete your choice.
A. P(more than 7) =
(Round to four decimal places as needed.)
B. The normal distribution cannot be used.

Statistics
ProbabilityIf np 25 and nq 25, estimate P(fewer than 4) with n = 13 and p = 0.5 by using the normal distribution as an approximation to the binomial distribution; if np <5 or nq <5, then state that the normal approximation is not suitable.
Select the correct choice below and, if necessary, fill in the answer box to complete your choice.
A. P(fewer than 4) =
(Round to four decimal places as needed.)
B. The normal approximation is not suitable.

Statistics
ProbabilityFind the indicated z score. The graph depicts the standard normal distribution with
mean 0 and standard deviation 1.
The indicated z score is
(Round to two decimal places as needed.)
Statistics
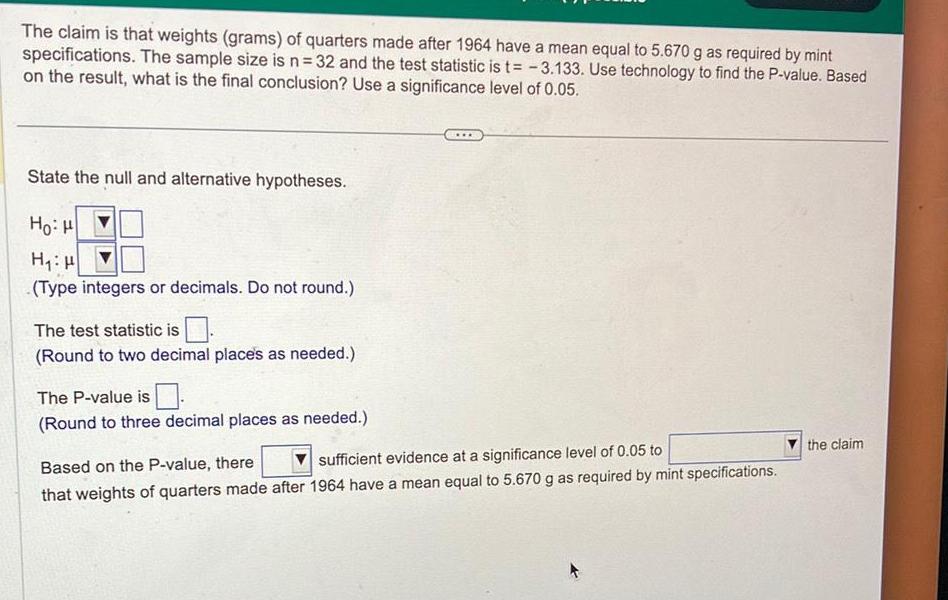
ProbabilityThe claim is that weights (grams) of quarters made after 1964 have a mean equal to 5.670 g as required by mint specifications. The sample size is n=32 and the test statistic is t= -3.133. Use technology to find the P-value. Based on the result, what is the final conclusion? Use a significance level of 0.05.
State the null and alternative hypotheses.
The test statistic is
The P-value is
Based on the P-value, there ___ sufficient evidence at a significance level of 0.05 to ___ the claim that weights of quarters made after 1964 have a mean equal to 5.670 g as required by mint specifications.
Statistics
ProbabilityThe waiting times between a subway departure schedule and the arrival of a passenger are uniformly distributed between 0 and 5 minutes. Find the probability that a randomly selected passenger has a waiting time less than 1.75 minutes.
Statistics
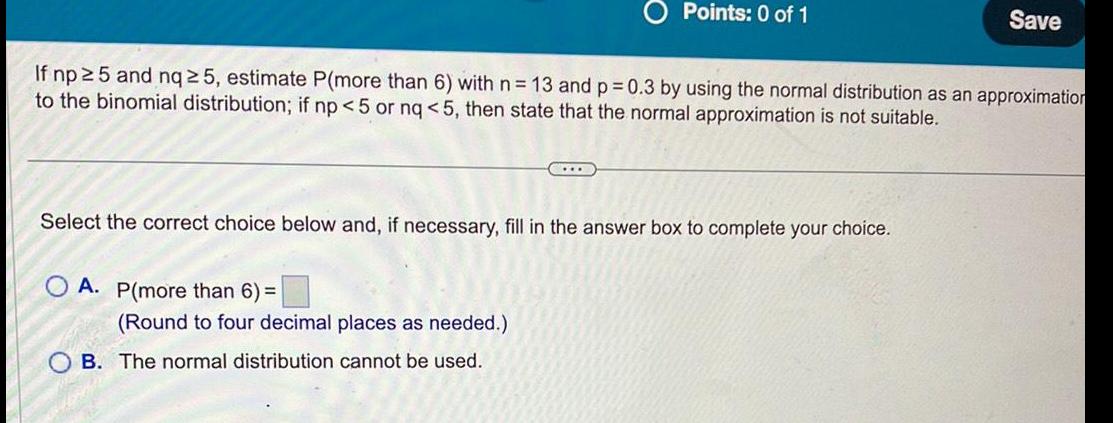
ProbabilityIf np ≥ 25 and nq ≥ 25, estimate P(more than 6) with n = 13 and p=0.3 by using the normal distribution as an approximation to the binomial distribution; if np < 5 or nq < 5, then state that the normal approximation is not suitable.