Probability Questions and Answers
Statistics
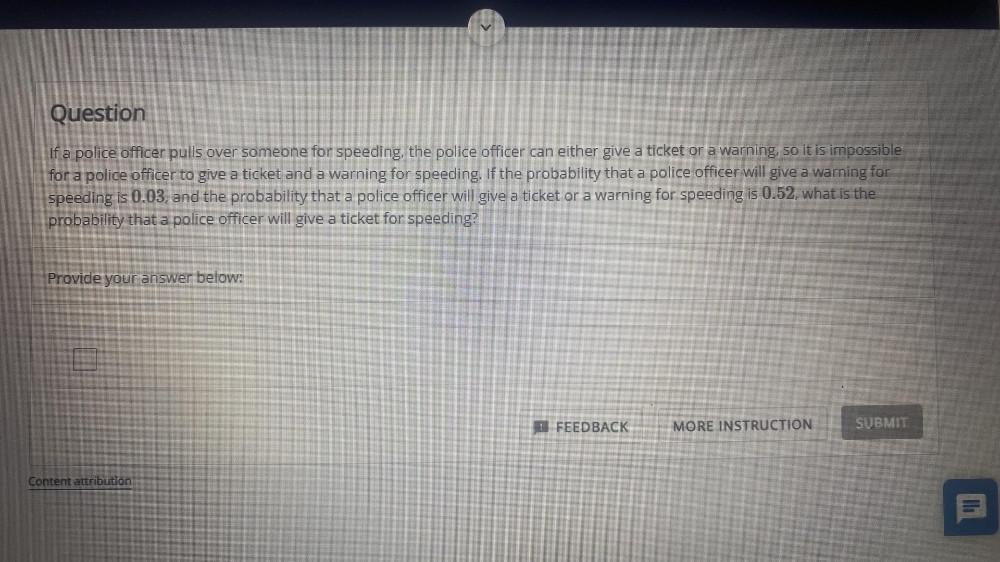
ProbabilityIf a police officer pulls over someone for speeding, the police officer can either give a ticket or a warning, so it is impossible for a police officer to give a ticket and a warning for speeding. If the probability that a police officer will give a warning for speeding is 0.03, and the probability that a police officer will give a ticket or a warning for speeding is 0.52, what is the probability that a police officer will give a ticket for speeding?
Provide your answer below:
Statistics
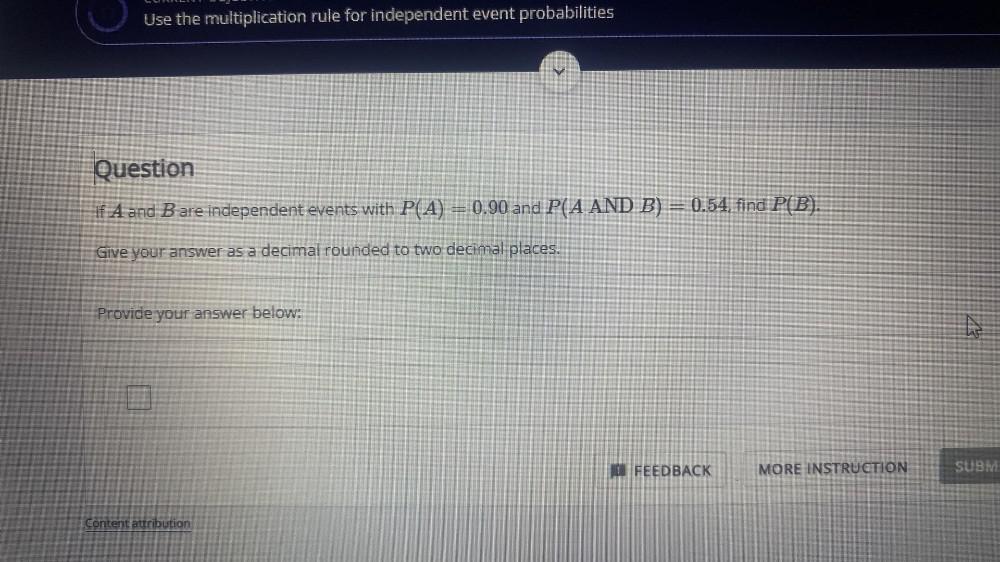
ProbabilityIf A and B are independent events with P(A) = 0.90 and P(A AND B) = 0.54, find P(B). Give your answer as a decimal rounded to two decimal places.
Provide your answer below:
Statistics
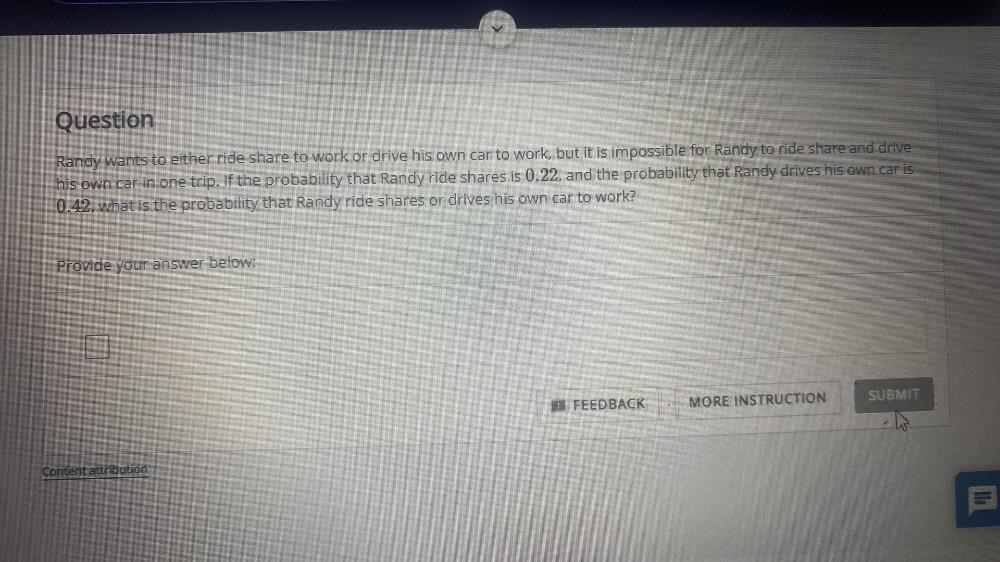
ProbabilityRandy wants to either ride share to work or drive his own car to work, but it is impossible for Randy to ride share and drive his own car in one trip. If the probability that Randy ride shares is 0.22, and the probability that Randy drives his own car is 0.42, what is the probability that Randy ride shares or drives his own car to work?
Statistics
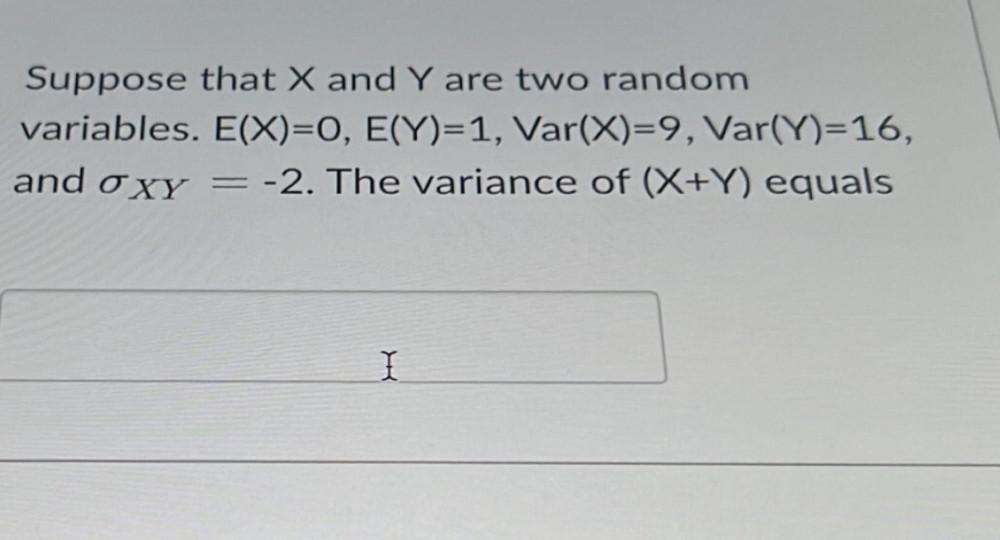
ProbabilitySuppose that X and Y are two random variables. E(X) = 0, E(Y) = 1, Var(X) =9, Var(Y) = 16, and σXY = -2. The variance of (X + Y) equals
Statistics
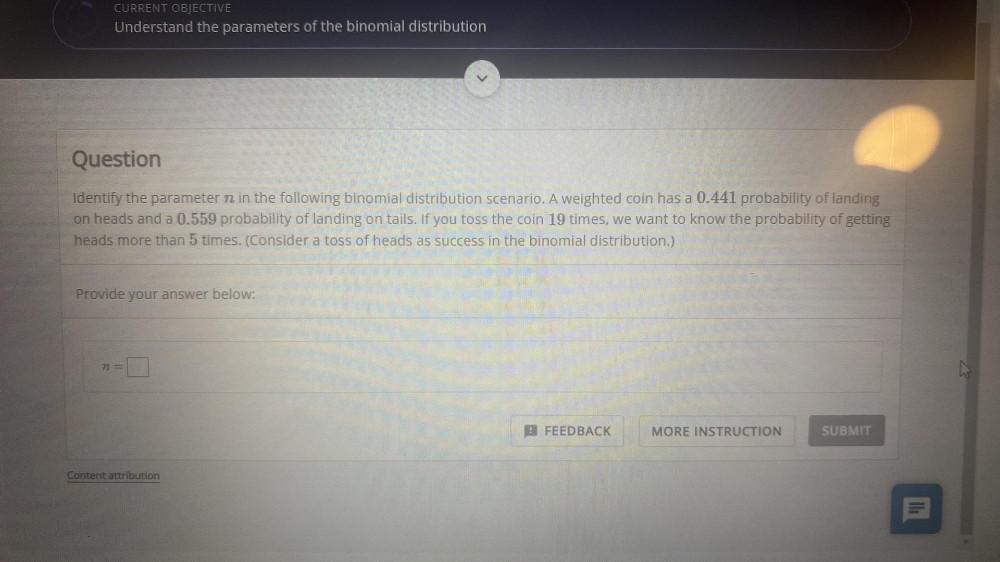
ProbabilityIdentify the parameter n in the following binomial distribution scenario. A weighted coin has a 0.441 probability of landing on heads and a 0.559 probability of landing on tails. If you toss the coin 19 times, we want to know the probability of getting heads more than 5 times. (Consider a toss of heads as success in the binomial distribution.)
Provide your answer below:
n=
Statistics
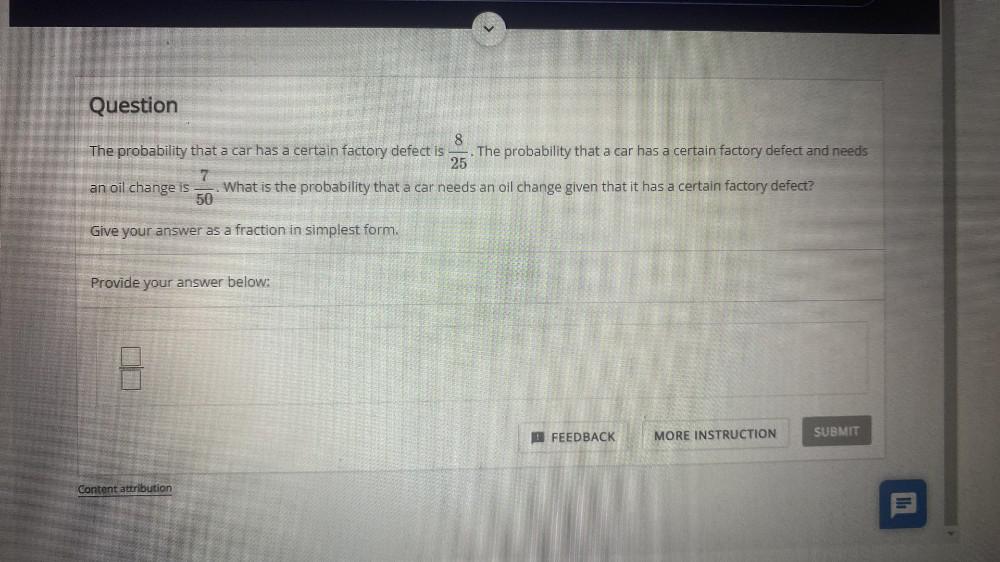
ProbabilityThe probability that a car has a certain factory defect is 8/25 The probability that a car has a certain factory defect and needs an oil change is 7/50 What is the probability that a car needs an oil change given that it has a certain factory defect?
Give your answer as a fraction in simplest form.
Provide your answer below:
Statistics
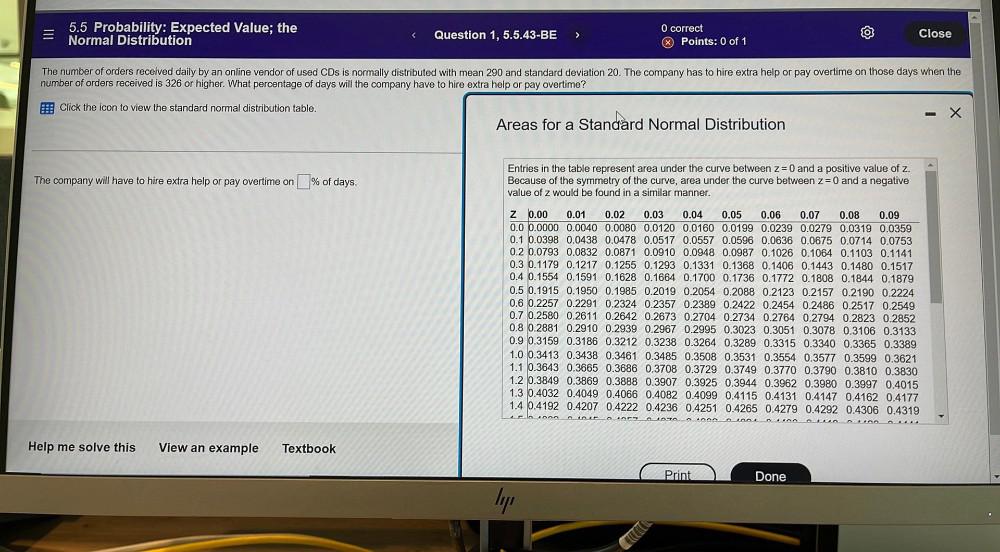
ProbabilityThe number of orders received daily by an online vendor of used CDs is normally distributed with mean 290 and standard deviation 20. The company has to hire extra help or pay overtime on those days when the number of orders received is 326 or higher. What percentage of days will the company have to hire extra help or pay overtime?
The company will have to hire extra help or pay overtime on ______% of days.
![Recently, the bowling scores of a certain bowler were normally distributed with mean 202 and standard deviation 19.
(a) Find the probability that a score is from 185 to 210.
(b) Find the probability that a score is from 165 to 175.
(c) Find the probability that a score is greater than 200.
(d) The best score is 299. Find the percentile that corresponds to this score, and explain what that number represents.
(a) The probability that a score is from 185 to 210 is
(Round to four decimal places as needed.)
(b) The probability that a score is from 165 to 175 is
(Round to four decimal places as needed.)
(c) The probability that a score is greater than 200 is
(Round to four decimal places as needed.)
(d) The []th percentile corresponds to this score, which means that 299 is[]than% of all his other scores.
(Round to five decimal places as needed.)](https://media.kunduz.com/media/sug-question/raw/82900253-1658659225.3887324.jpeg?w=256)
Statistics
ProbabilityRecently, the bowling scores of a certain bowler were normally distributed with mean 202 and standard deviation 19.
(a) Find the probability that a score is from 185 to 210.
(b) Find the probability that a score is from 165 to 175.
(c) Find the probability that a score is greater than 200.
(d) The best score is 299. Find the percentile that corresponds to this score, and explain what that number represents.
(a) The probability that a score is from 185 to 210 is
(Round to four decimal places as needed.)
(b) The probability that a score is from 165 to 175 is
(Round to four decimal places as needed.)
(c) The probability that a score is greater than 200 is
(Round to four decimal places as needed.)
(d) The []th percentile corresponds to this score, which means that 299 is[]than% of all his other scores.
(Round to five decimal places as needed.)

Statistics
ProbabilityDescribe the intervals on which the function f(x) = ln |x| is continuous. Are they removable? Graph the function.
Statistics
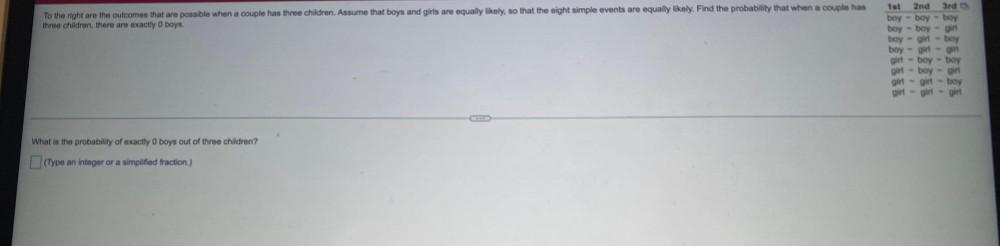
ProbabilityTo the right are the outcomes that are possible when a couple has three children. Assume that boys and girls are equally likely, so that the eight simple events are equally likely. Find the probability that when a couple has three children, there are exactly 0 boys.
1st 2nd 3rd
boy-boy-boy
boy-boy-girl
boy-girl-boy
boy - girl-girl
girl-boy-boy
girl-boy-girl
girl-girl-boy
girt-girl-girl
What is the probability of exactly 0 boys out of three children?
(Type an integer or a simplified fraction.)
Statistics
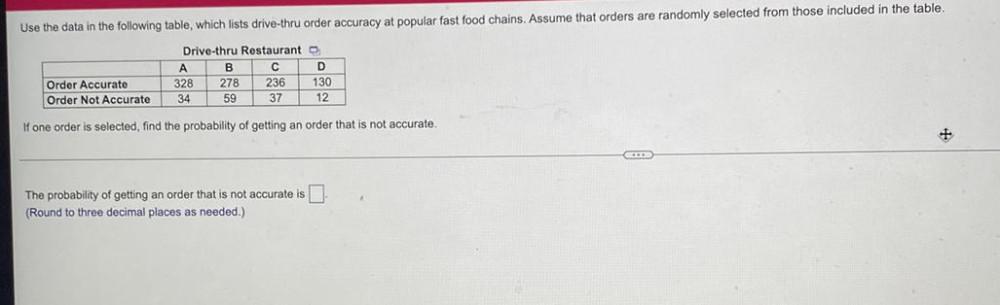
ProbabilityUse the data in the following table, which lists drive-thru order accuracy at popular fast food chains. Assume that orders are randomly selected from those included in the table.
Drive-thru Restaurant
A B C D
Order Accurate 328 278 236 130
Order Not Accurate 34 59 37 12
If one order is selected, find the probability of getting an order that is not accurate.
The probability of getting an order that is not accurate is ________
(Round to three decimal places as needed.)
Statistics
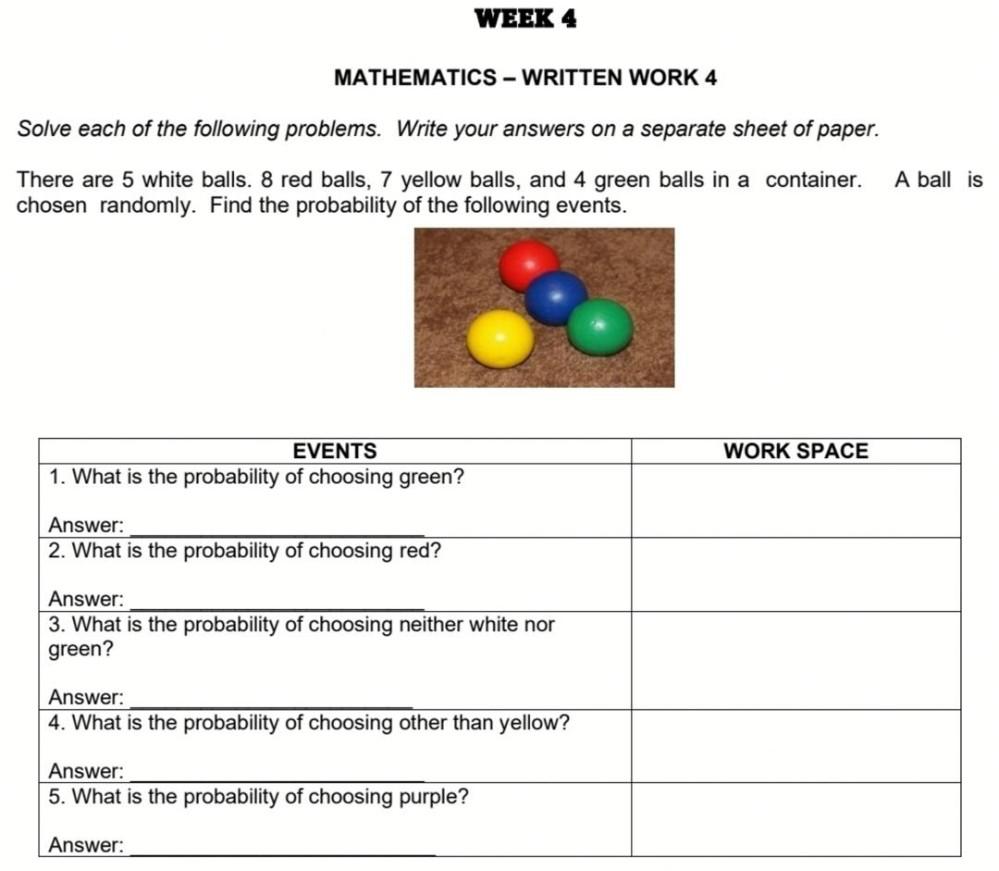
ProbabilityThere are 5 white balls. 8 red balls, 7 yellow balls, and 4 green balls in a container. A ball is chosen randomly. Find the probability of the following events.
EVENTS WORK SPACE
1. What is the probability of choosing green?
Answer:
2. What is the probability of choosing red?
Answer:
3. What is the probability of choosing neither white nor
green?
Answer:
4. What is the probability of choosing other than yellow?
Answer:
5. What is the probability of choosing purple?
Answer:
Statistics
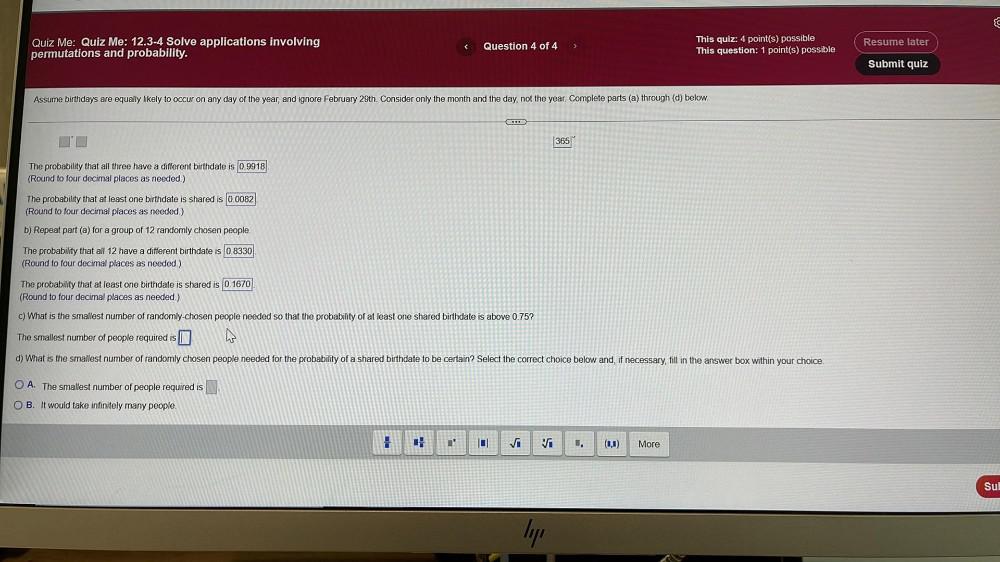
ProbabilityAssume birthdays are equally likely to occur on any day of the year, and ignore February 29th. Consider only the month and the day, not the year. Complete parts (a) through (d) below.
The probability that all three have a different birthdate is 0.9918
(Round to four decimal places as needed.)
The probability that at least one birthdate is shared is 0.0082
(Round to four decimal places as needed.)
b) Repeat part (a) for a group of 12 randomly chosen people.
The probability that all 12 have a different birthdate is 0.8330
(Round to four decimal places as needed.)
The probability that at least one birthdate is shared is 0.1670
(Round to four decimal places as needed.)
c) What is the smallest number of randomly-chosen people needed so that the probability of at least one shared birthdate is above 0.75?
The smallest number of people required is
d) What is the smallest number of randomly chosen people needed for the probability of a shared birthdate to be certain? Select the correct choice below and, if necessary, fill in the answer box within your choice.
A. The smallest number of people required is
B. It would take infinitely many people.
Statistics
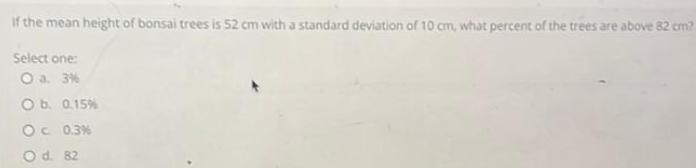
ProbabilityIf the mean height of bonsai trees is 52 cm with a standard deviation of 10 cm, what percent of the trees are above 82 cm?
Select one:
a. 3%
b. 0.15%
C. 0.3%
d. 82
Statistics
ProbabilityConsider a 2 x 2 factorial. How many replications are required to estimate the interaction beta to within two units with a 90% confidence interval? Assume that the standard error of the estimate of the interacton beta is approximatedly 3. Please directly enter your number (no steps are required, no text, just enter the number).
Statistics
ProbabilityVerify that there exists a function g: R²->R² such that u = (u, v) = g(x) for the system
5xu²+ 3yv^4 = 8
2xy(u² - v²) = 0
near the point (1,1,-1,-1) by calculating det(D(u, v)F(1, 1,-1,-1)) where F: R^4->R² is a C¹ function satisfying F(1, 1,-1,-1) = 0
Statistics
ProbabilityA high school baseball player has a 0.317 batting average. In one game, he gets 8 at bats. What is the probability he will get at least 2 hits in the game?
Statistics
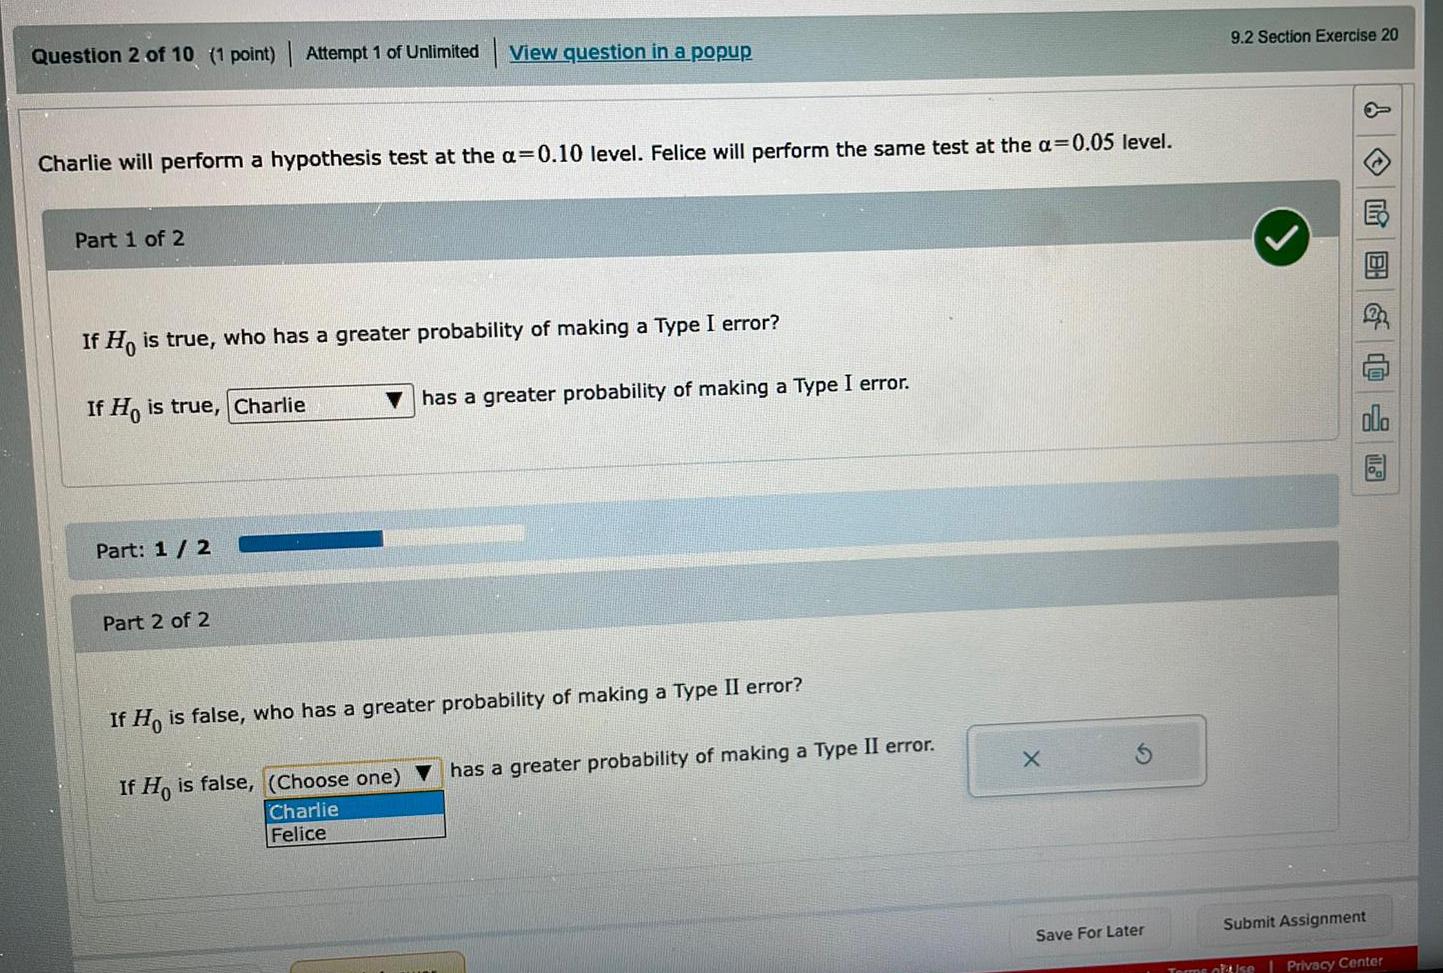
ProbabilityCharlie will perform a hypothesis test at the a=0.10 level. Felice will perform the same test at the a=0.05 level.
Part 1 of 2
If Ho is true, who has a greater probability of making a Type I error?
Part: 1 / 2
Part 2 of 2
If Ho is false, who has a greater probability of making a Type II error?
Statistics
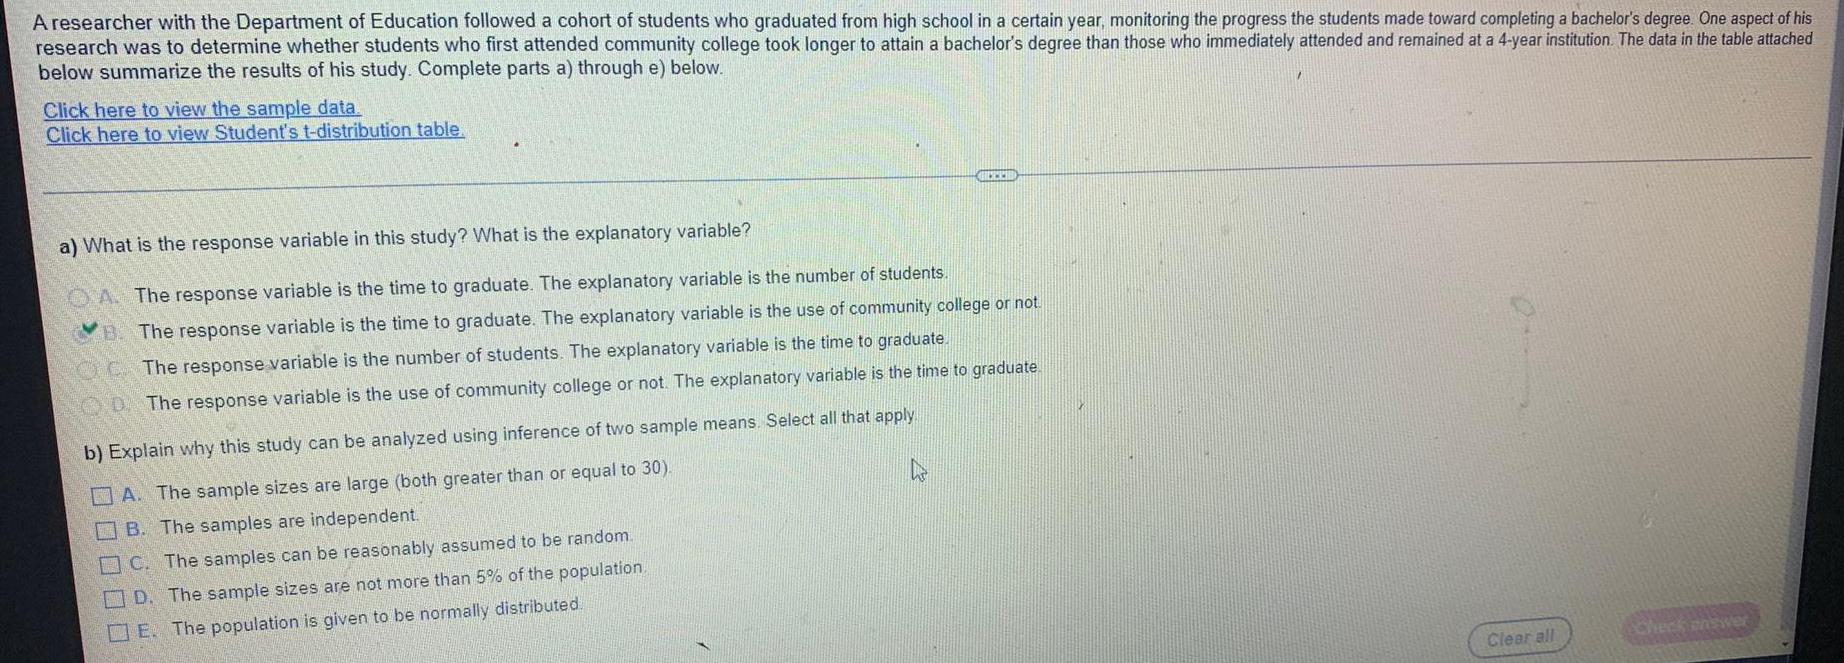
ProbabilityA researcher with the Department of Education followed a cohort of students who graduated from high school in a certain year, monitoring the progress the students made toward completing a bachelor's degree. One aspect of his research was to determine whether students who first attended community college took longer to attain a bachelor's degree than those who immediately attended and remained at a 4-year institution. The data in the table attached below summarize the results of his study. Complete parts a) through e) below.
Click here to view the sample data.
Click here to view Student's t-distribution table.
a) What is the response variable in this study? What is the explanatory variable?
A. The response variable is the time to graduate. The explanatory variable is the number of students.
B. The response variable is the time to graduate. The explanatory variable is the use of community college or not.
The response variable is the number of students. The explanatory variable is the time to graduate.
D. The response variable is the use of community college or not. The explanatory variable is the time to graduate
b) Explain why this study can be analyzed using inference of two sample means. Select all that apply.
A. The sample sizes are large (both greater than or equal to 30).
B. The samples are independent.
C. The samples can be reasonably assumed to be random.
D. The sample sizes are not more than 5% of the population
E. The population is given to be normally distributed.
Statistics
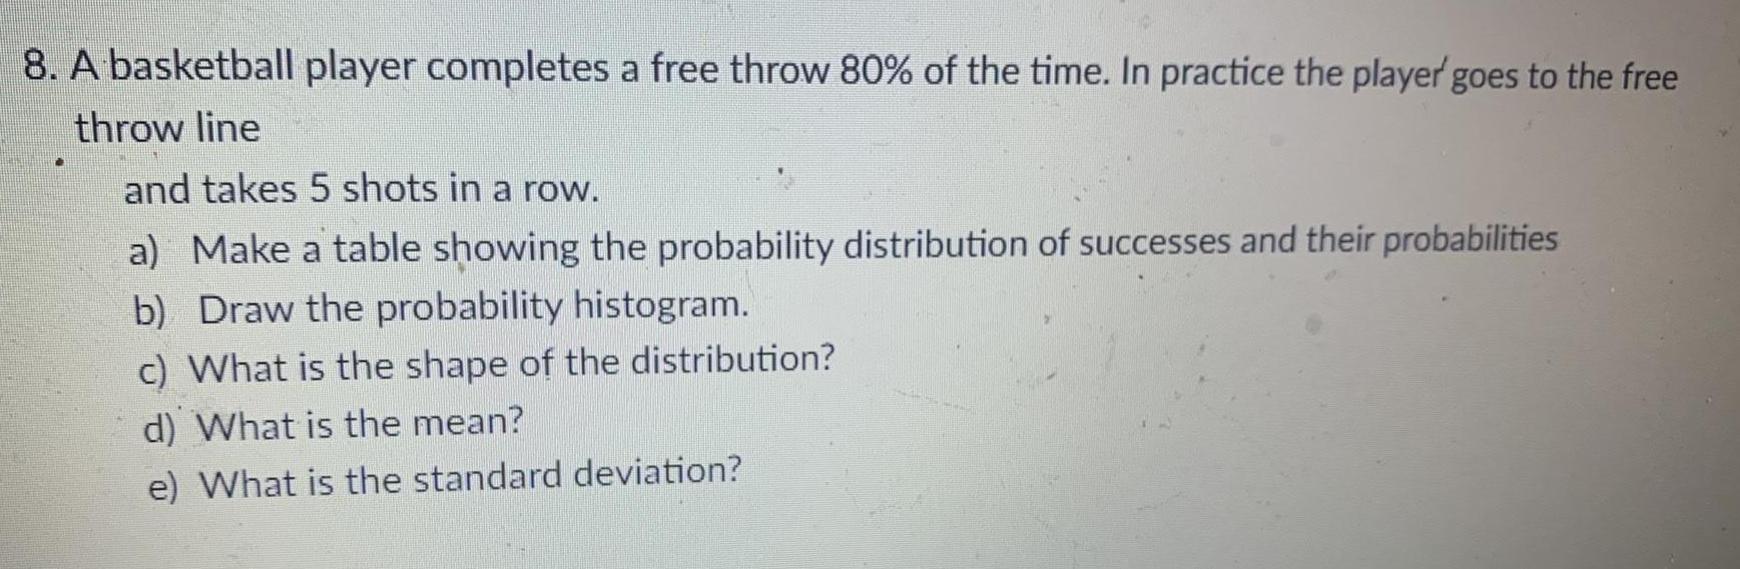
ProbabilityA basketball player completes a free throw 80% of the time. In practice the player goes to the free throw line
and takes 5 shots in a row.
a) Make a table showing the probability distribution of successes and their probabilities
b) Draw the probability histogram.
c) What is the shape of the distribution?
d) What is the mean?
e) What is the standard deviation?
Statistics
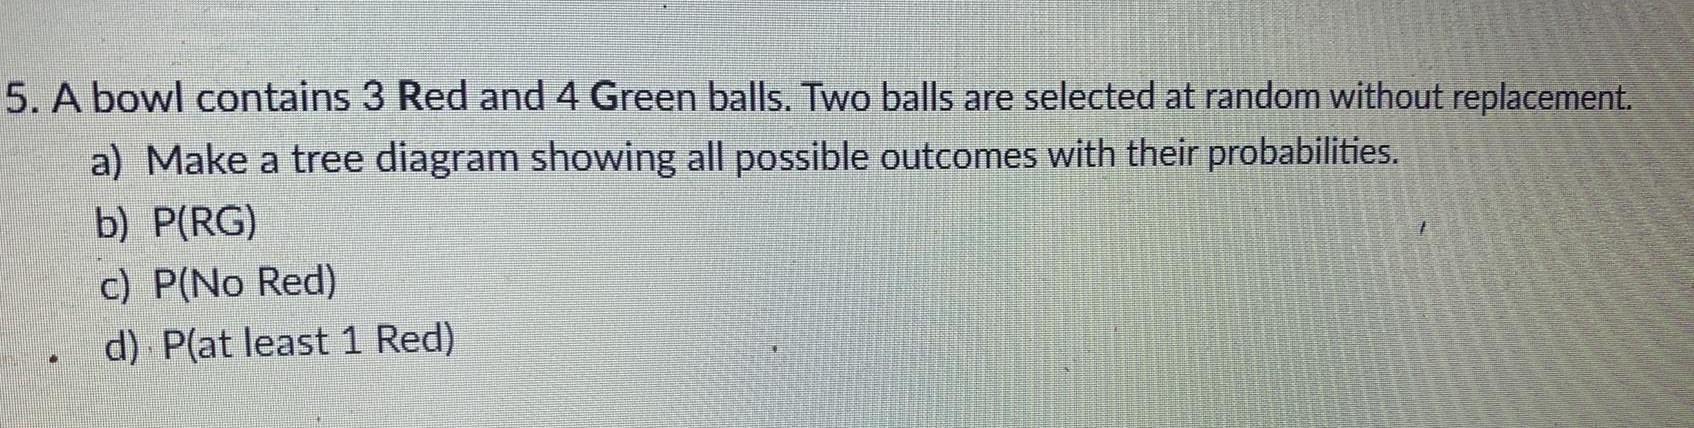
ProbabilityA bowl contains 3 Red and 4 Green balls. Two balls are selected at random without replacement.
a) Make a tree diagram showing all possible outcomes with their probabilities.
b) P(RG)
c) P(No Red)
d) P(at least 1 Red)
Statistics
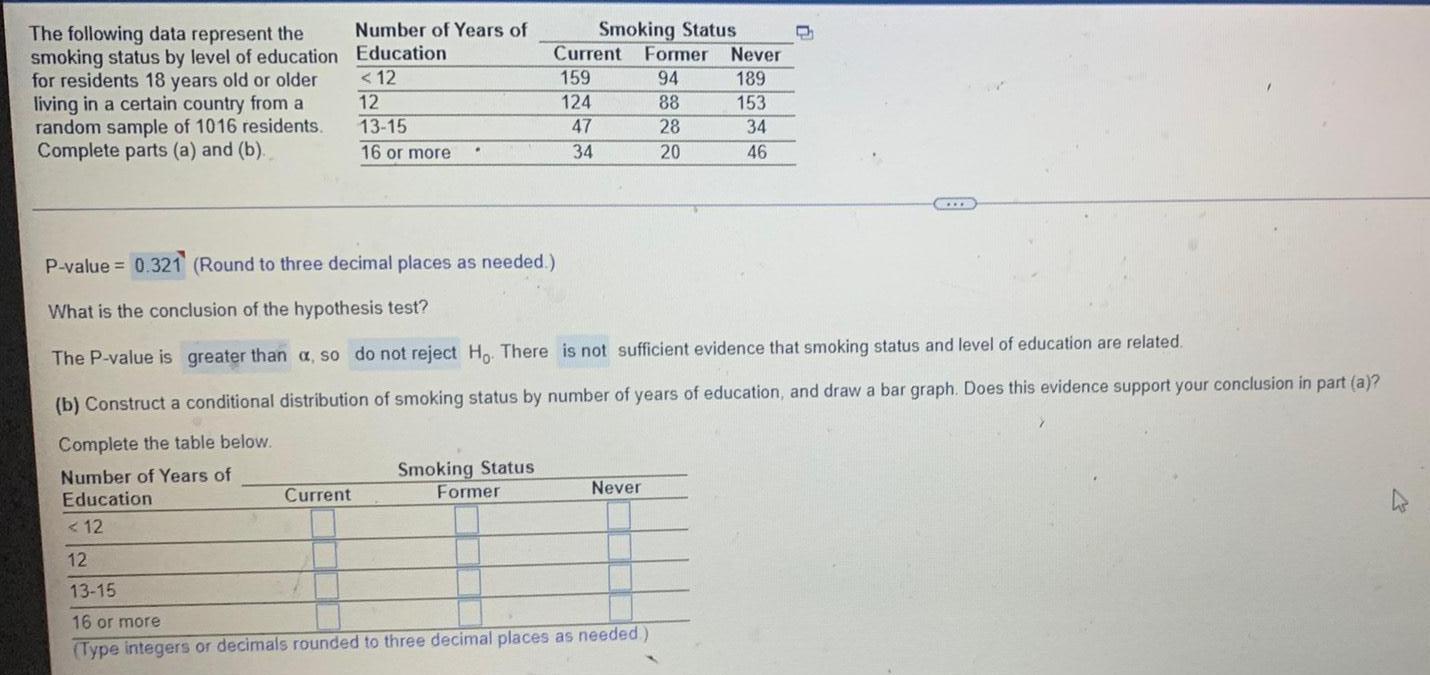
ProbabilityThe following data represent the smoking status by level of education for residents 18 years old or older living in a certain country from a random sample of 1016 residents.
Complete parts (a) and (b)..
Number of Years of Smoking Status
Education Current Former Never
< 12 159 94 189
12 124 88 153
13-15 47 28 34
16 or more 34 20 46
P-value = (Round to three decimal places as needed.)
What is the conclusion of the hypothesis test?
The P-value is α, so Ho. There sufficient evidence that smoking status and level of education are related.
(b) Construct a conditional distribution of smoking status by number of years of education, and draw a bar graph. Does this evidence support your conclusion in part (a)?
Complete the table below.
Number of Years of Smoking Status
Education Current Former Never
< 12
12
13-15
16 or more
(Type integers or decimals rounded to three decimal places as needed)
Statistics
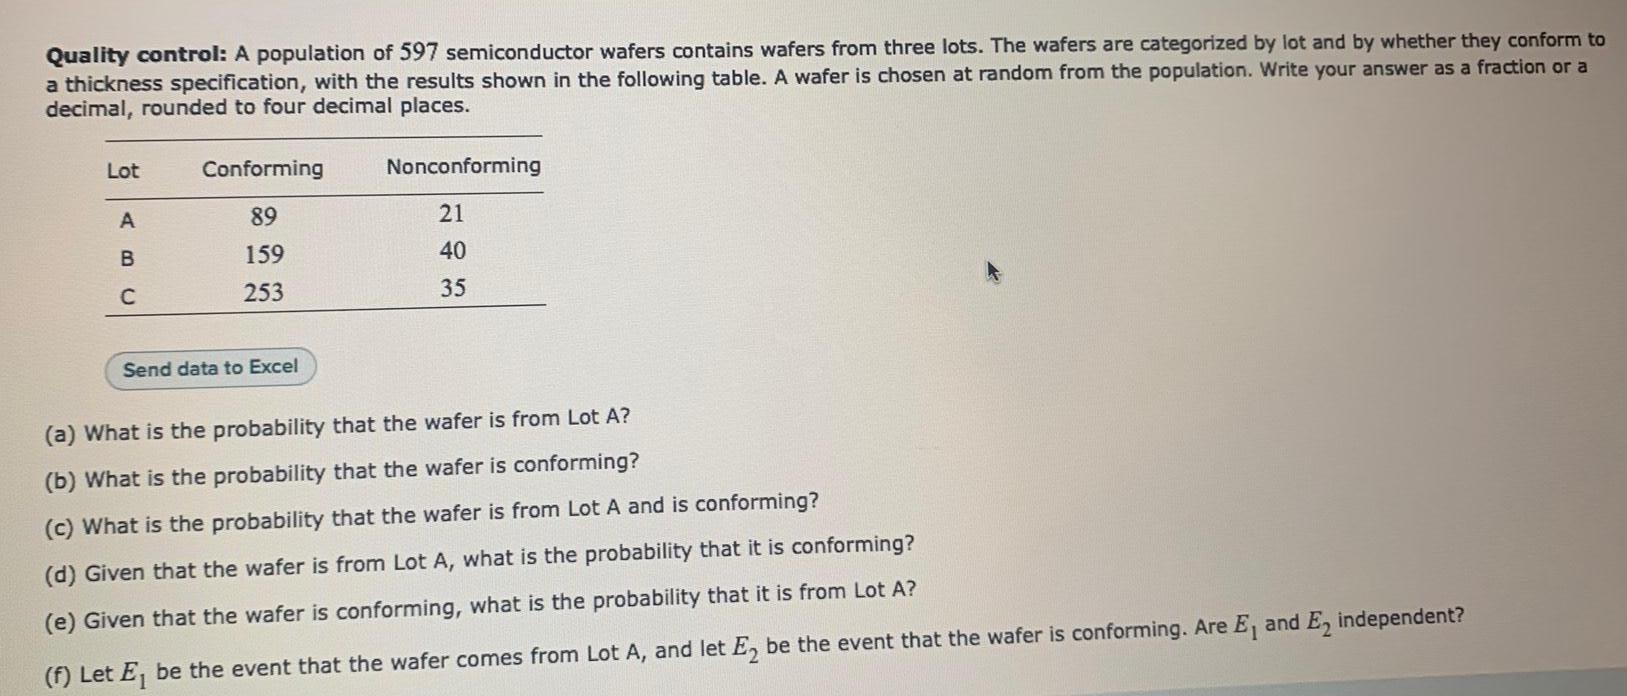
ProbabilityQuality control: A population of 597 semiconductor wafers contains wafers from three lots. The wafers are categorized by lot and by whether they conform to a thickness specification, with the results shown in the following table. A wafer is chosen at random from the population. Write your answer as a fraction or a decimal, rounded to four decimal places.
Lot Conforming Nonconforming
A 89 21
B 159 40
C 253 35
(a) What is the probability that the wafer is from Lot A?
(b) What is the probability that the wafer is conforming?
(c) What is the probability that the wafer is from Lot A and is conforming?
(d) Given that the wafer is from Lot A, what is the probability that it is conforming?
(e) Given that the wafer is conforming, what is the probability that it is from Lot A?
(f) Let E₁ be the event that the wafer comes from Lot A, and let E₂ be the event that the wafer is conforming. Are E1 and E₂ independent?
Statistics
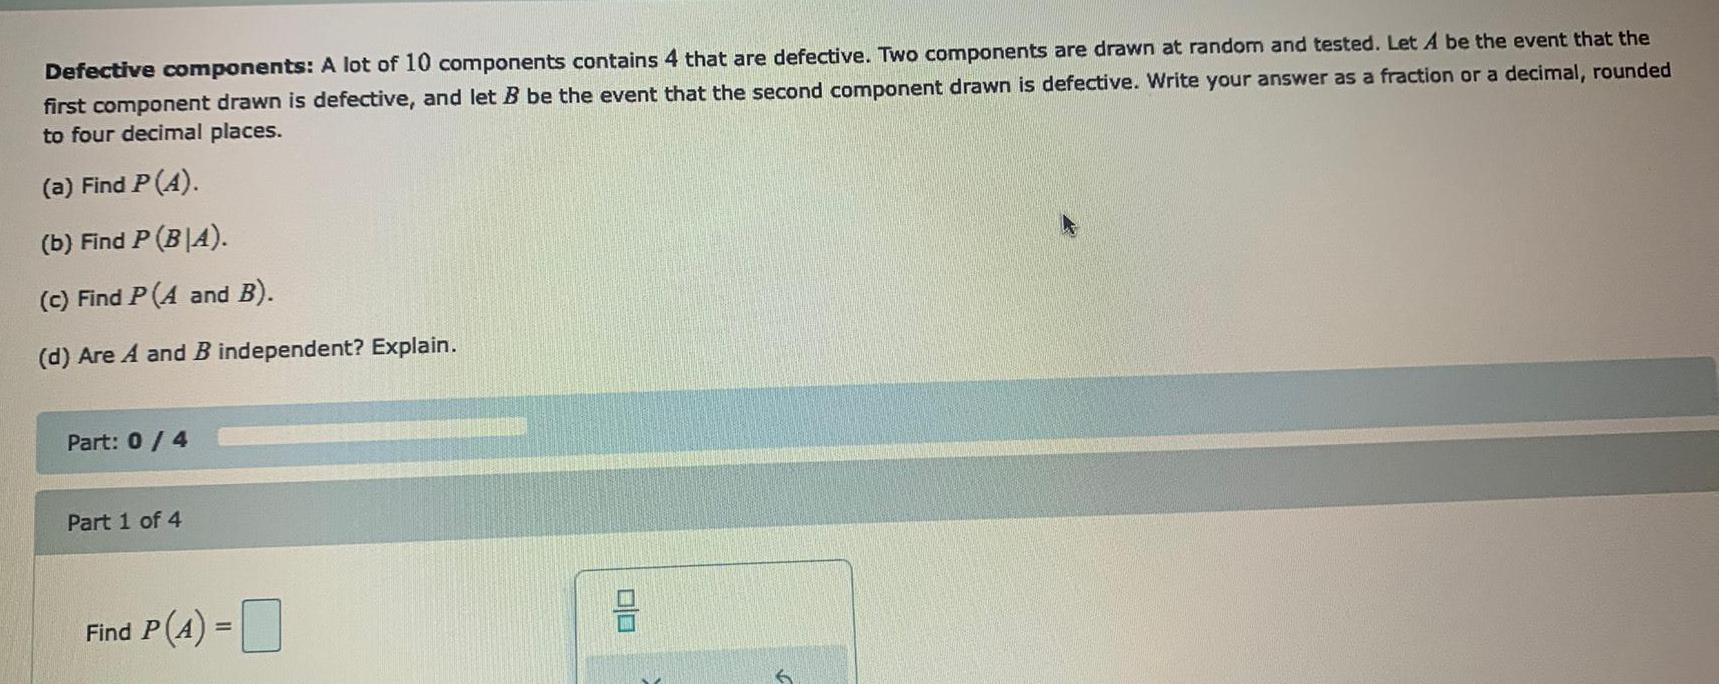
ProbabilityDefective components: A lot of 10 components contains 4 that are defective. Two components are drawn at random and tested. Let A be the event that the first component drawn is defective, and let B be the event that the second component drawn is defective. Write your answer as a fraction or a decimal, rounded to four decimal places.
(a) Find P (A).
(b) Find P (B|A).
(c) Find P (A and B).
(d) Are A and B independent? Explain.
Find P(4) =
Statistics
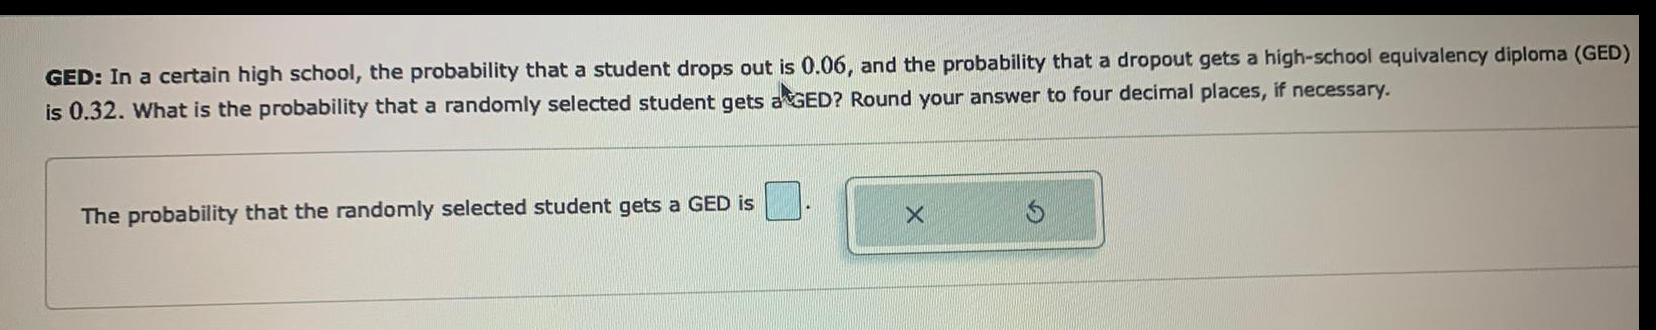
ProbabilityGED: In a certain high school, the probability that a student drops out is 0.06, and the probability that a dropout gets a high-school equivalency diploma (GED) is 0.32. What is the probability that a randomly selected student gets a GED? Round your answer to four decimal places, if necessary.
The probability that the randomly selected student gets a GED is
Statistics
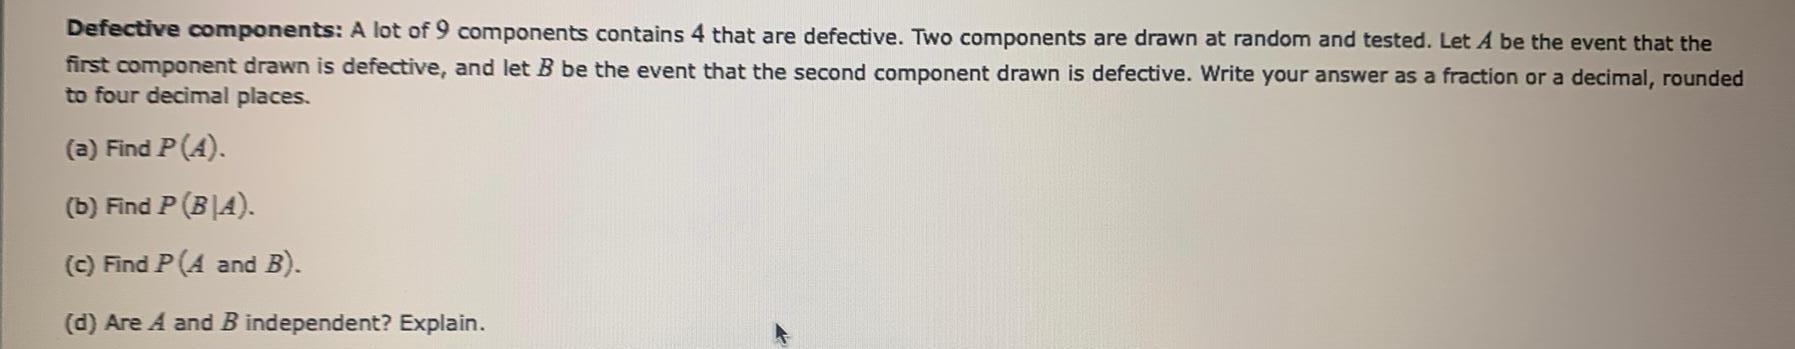
ProbabilityDefective components: A lot of 9 components contains 4 that are defective. Two components are drawn at random and tested. Let A be the event that the first component drawn is defective, and let B be the event that the second component drawn is defective. Write your answer as a fraction or a decimal, rounded to four decimal places.
(a) Find P (4).
(b) Find P (B|A).
(c) Find P (A and B).
(d) Are A and B independent? Explain.
Statistics
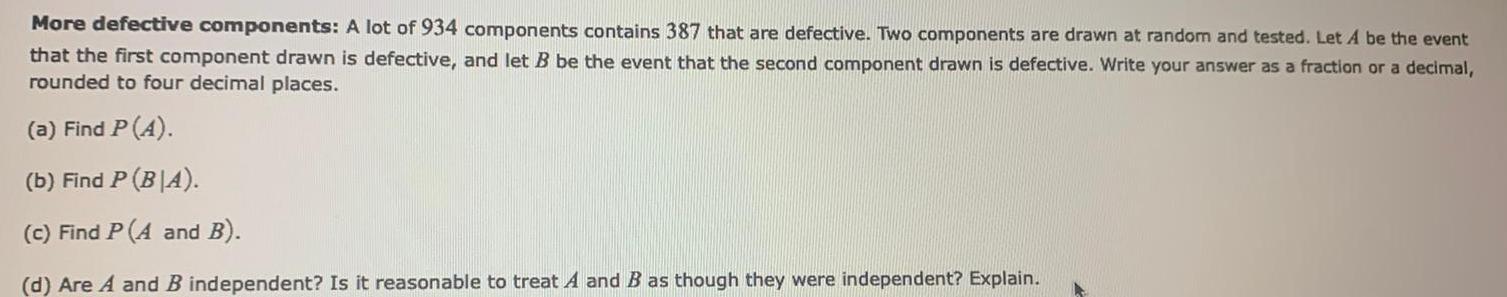
ProbabilityMore defective components: A lot of 934 components contains 387 that are defective. Two components are drawn at random and tested. Let A be the event that the first component drawn is defective, and let B be the event that the second component drawn is defective. Write your answer as a fraction or a decimal, rounded to four decimal places.
(a) Find P (A).
(b) Find P (B|A).
(c) Find P (A and B).
(d) Are A and B independent? Is it reasonable to treat A and B as though they were independent? Explain.
Statistics
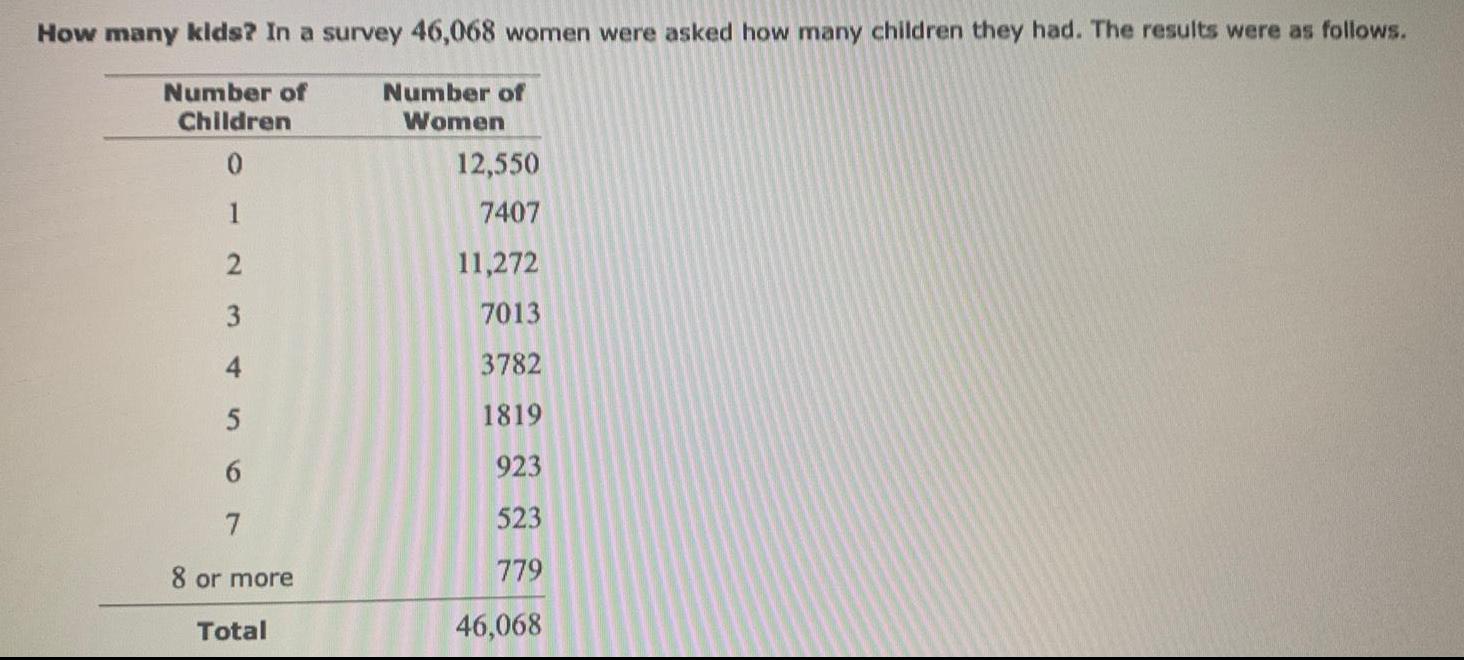
ProbabilityHow many kids? In a survey 46,068 women were asked how many children they had. The results were as follows.
Number of Children Number of Women
0 12,550
1 7407
2 11,272
3 7013
4 3782
5 1819
6 923
7 523
8 or more 779
Total 46,068
Statistics
ProbabilityChoosing officers: A committee consists of twelve women and eleven men. Four committee members will be chosen as officers.
How many different choices are possible?
There are different possible choices.
Statistics
ProbabilityA computer password consists of ten characters. Replications are allowed.
(a) How many different passwords are possible if each character may be any lowercase letter or digit? Enter your answer in scientific notation with two digit of accuracy after the decimal point.
The possible number of different passwords is
Statistics
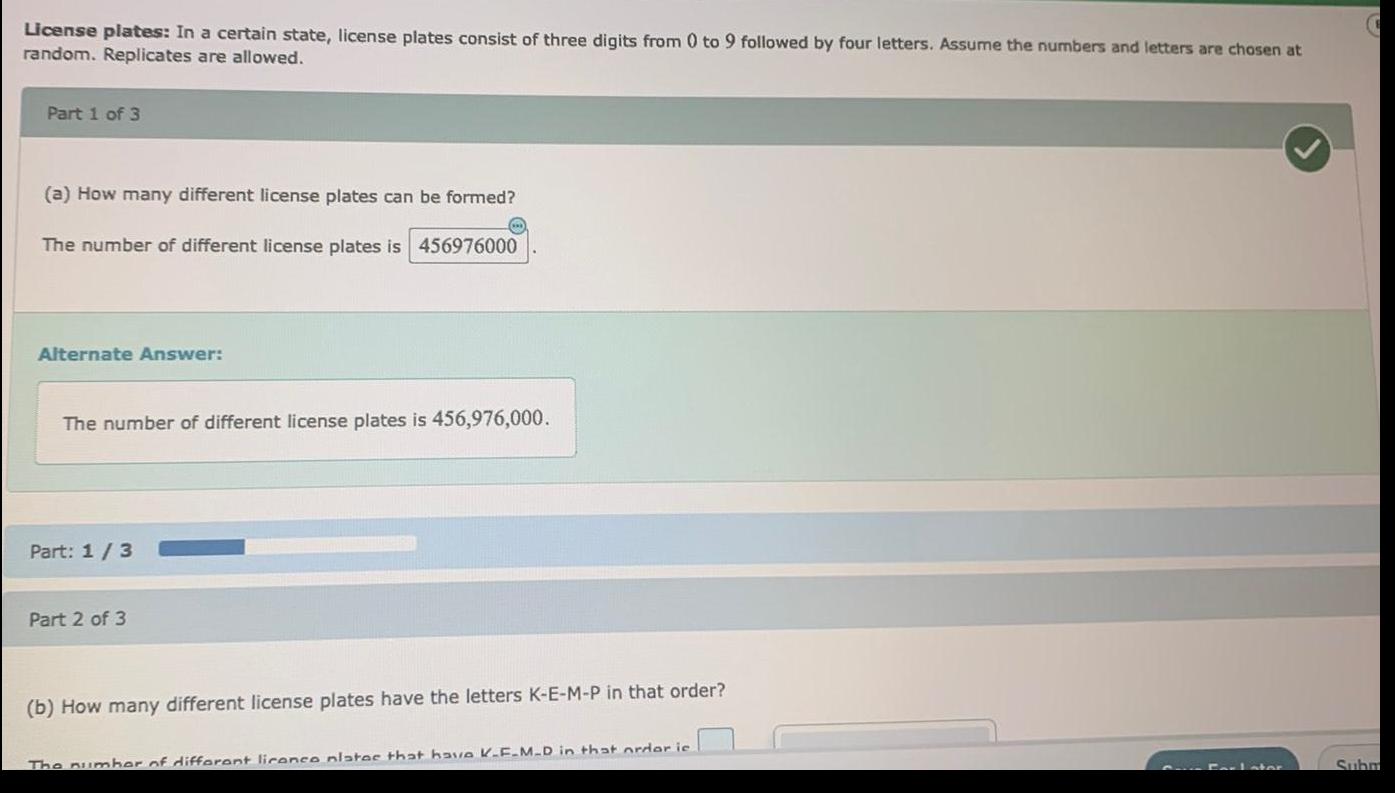
ProbabilityLicense plates: In a certain state, license plates consist of three digits from 0 to 9 followed by four letters. Assume the numbers and letters are chosen at random. Replicates are allowed.
(a) How many different license plates can be formed?
The number of different license plates is
(b) How many different license plates have the letters K-E-M-P in that order?
Statistics
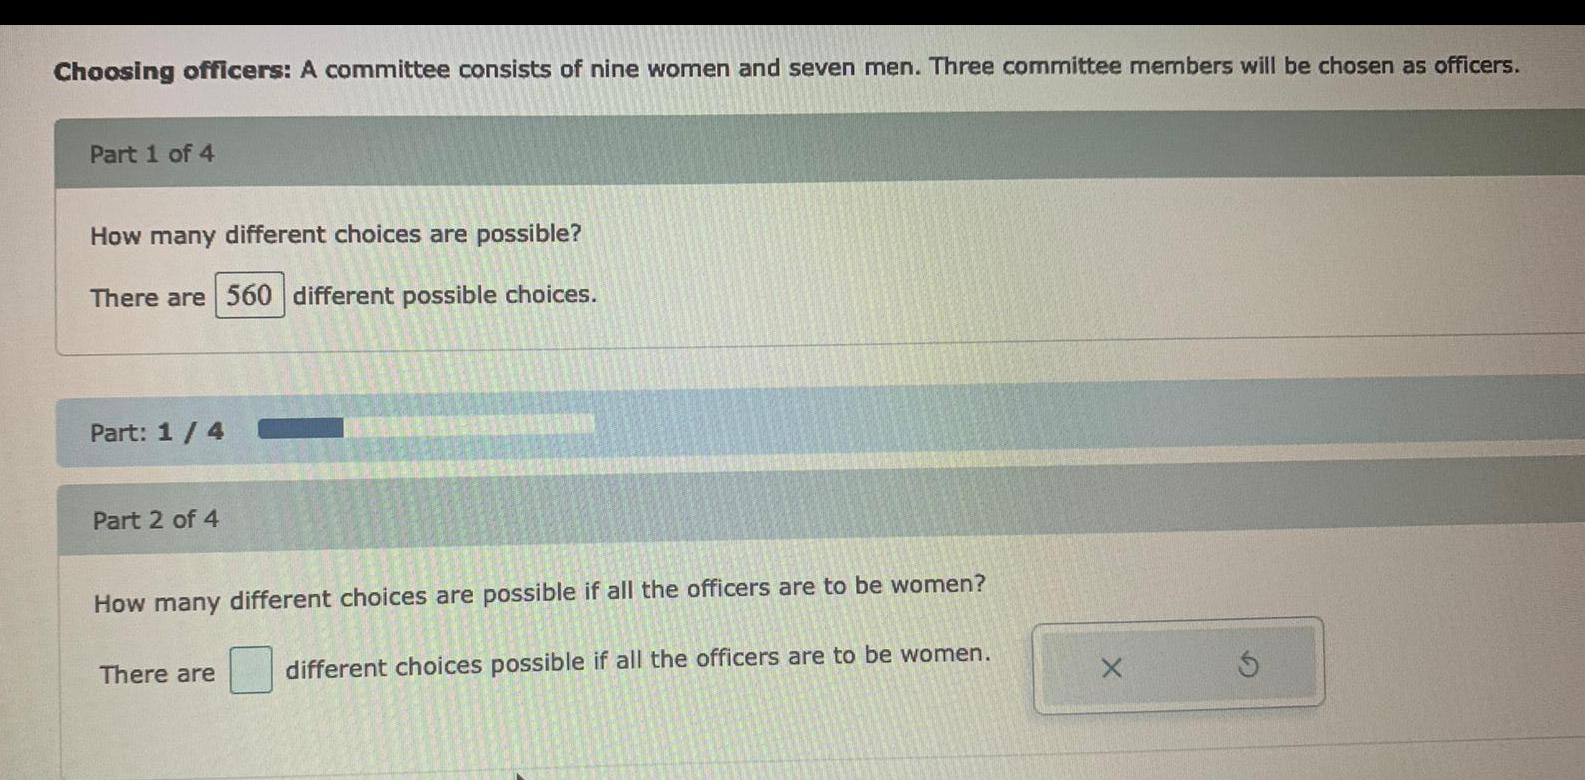
ProbabilityChoosing officers: A committee consists of nine women and seven men. Three committee members will be chosen as officers.
How many different choices are possible?
There are different possible choices.
How many different choices are possible if all the officers are to be women?
There are different choices possible if all the officers are to be women.
Statistics
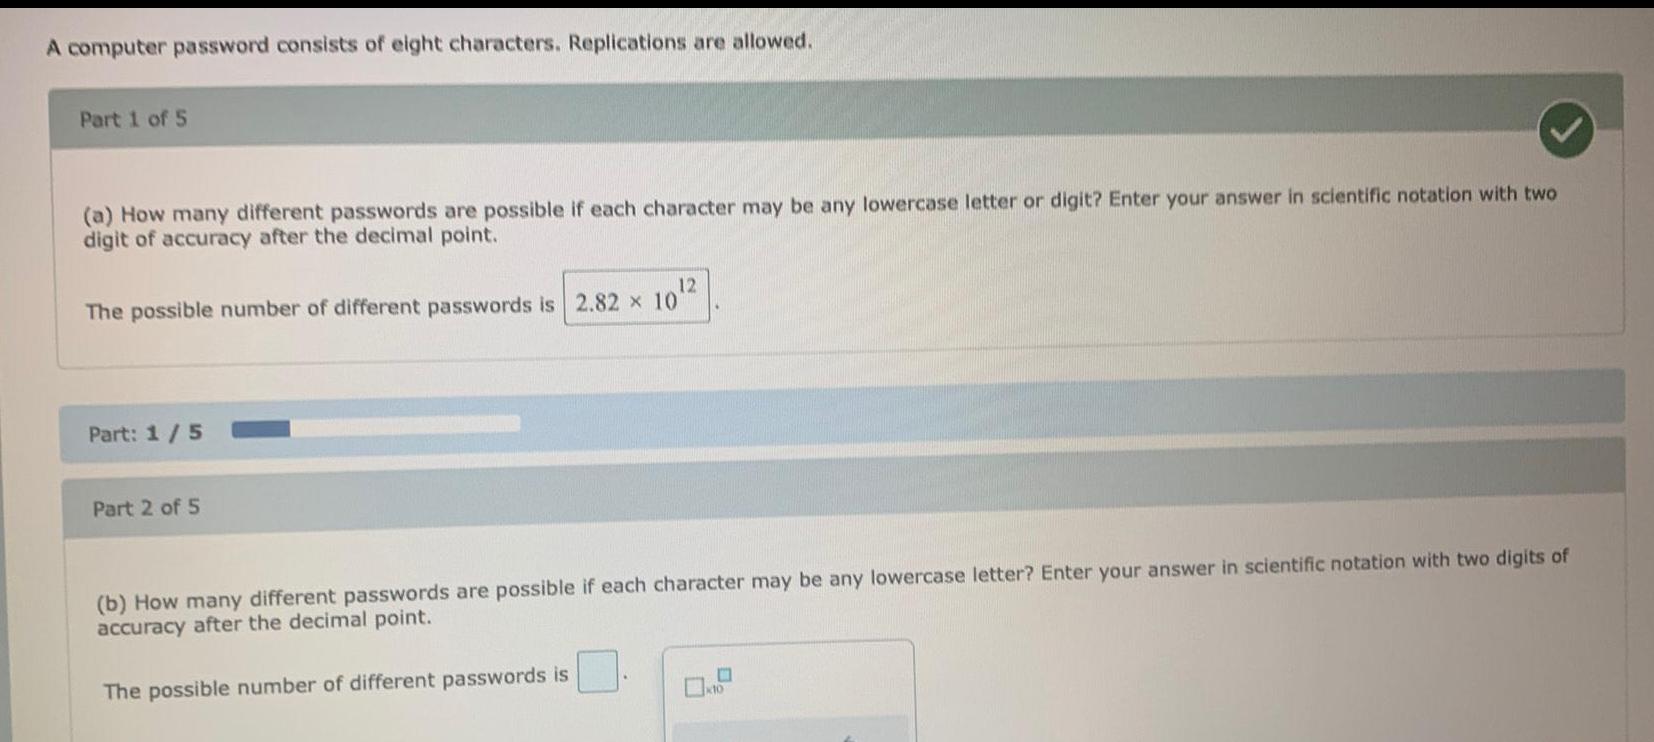
ProbabilityA computer password consists of eight characters. Replications are allowed.
(a) How many different passwords are possible if each character may be any lowercase letter or digit? Enter your answer in scientific notation with two digit of accuracy after the decimal point.
The possible number of different passwords is
(b) How many different passwords are possible if each character may be any lowercase letter? Enter your answer in scientific notation with two digits of accuracy after the decimal point.
The possible number of different passwords is
Statistics
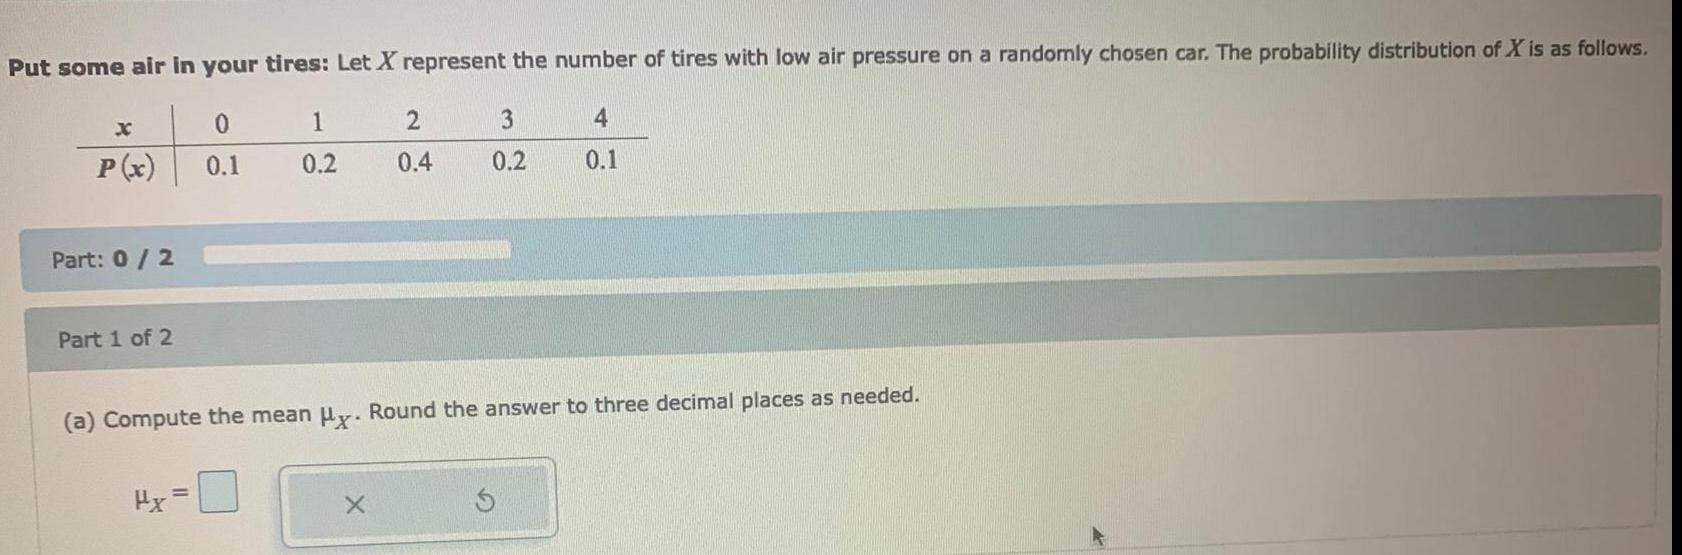
ProbabilityPut some air in your tires: Let X represent the number of tires with low air pressure on a randomly chosen car. The probability distribution of X is as follows.
x 0 1 2 3 4
P(x) 0.1 0.2 0.4 0.2 0.1
(a) Compute the mean μx. Round the answer to three decimal places as needed.
Statistics
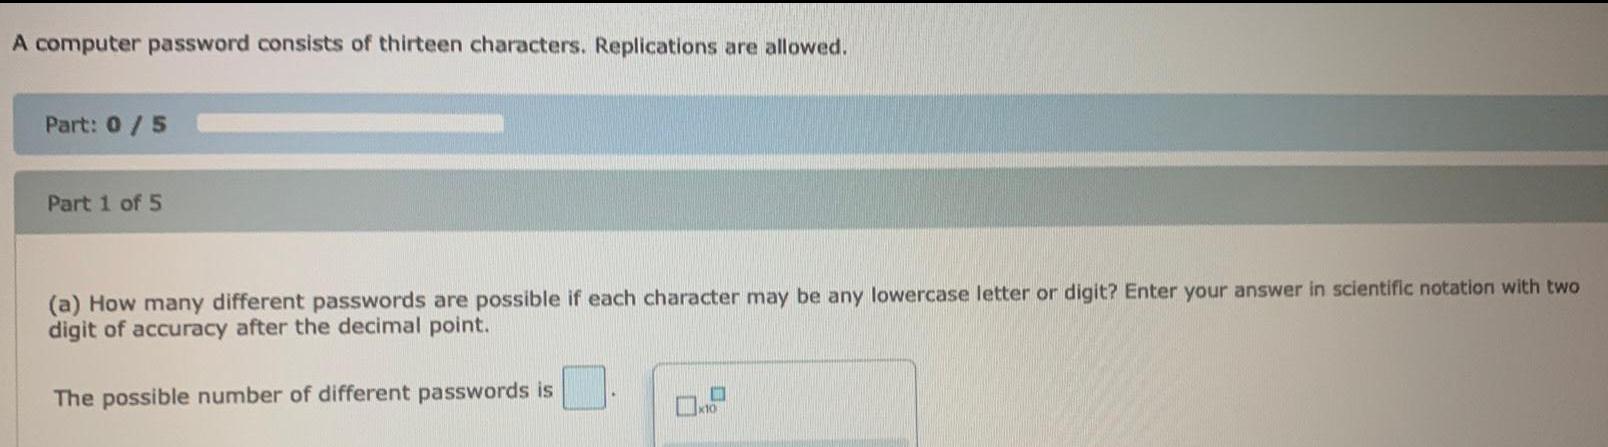
ProbabilityA computer password consists of thirteen characters. Replications are allowed.
(a) How many different passwords are possible if each character may be any lowercase letter or digit? Enter your answer in scientific notation with two digit of accuracy after the decimal point.
The possible number of different passwords is
Statistics
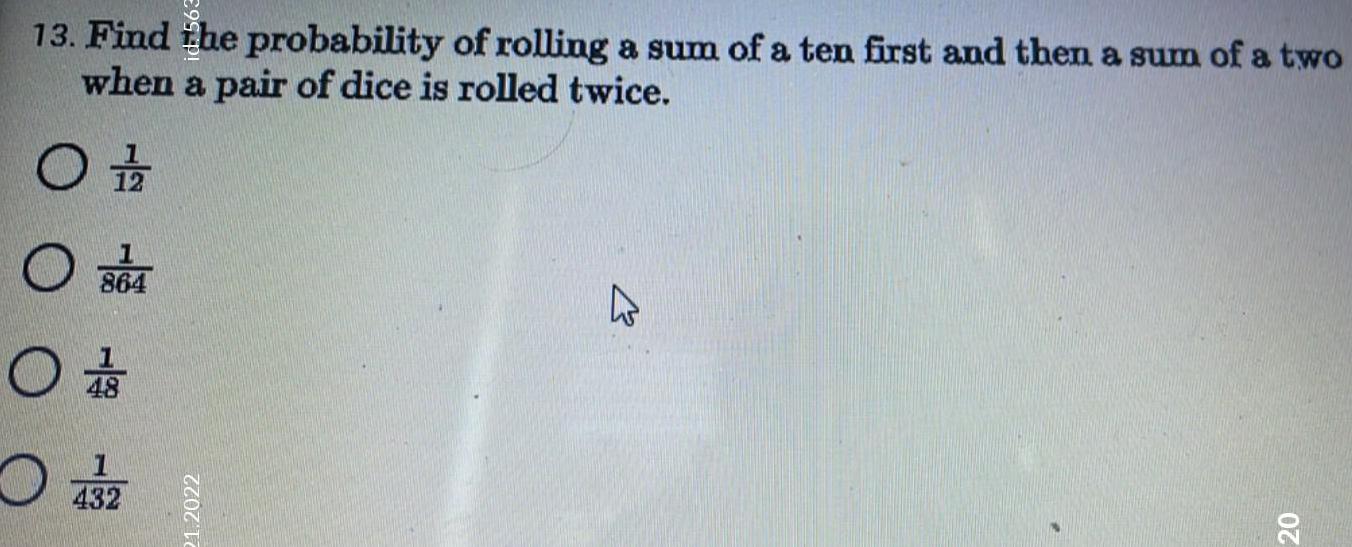
ProbabilityFind the probability of rolling a sum of a ten first and then a sum of a two when a pair of dice is rolled twice.
1/12
1/864
1/48
1/432
Statistics
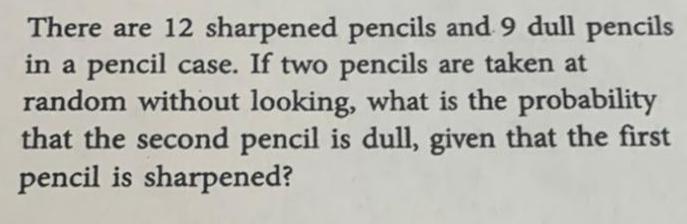
ProbabilityThere are 12 sharpened pencils and 9 dull pencils in a pencil case. If two pencils are taken at random without looking, what is the probability that the second pencil is dull, given that the first pencil is sharpened?
Statistics
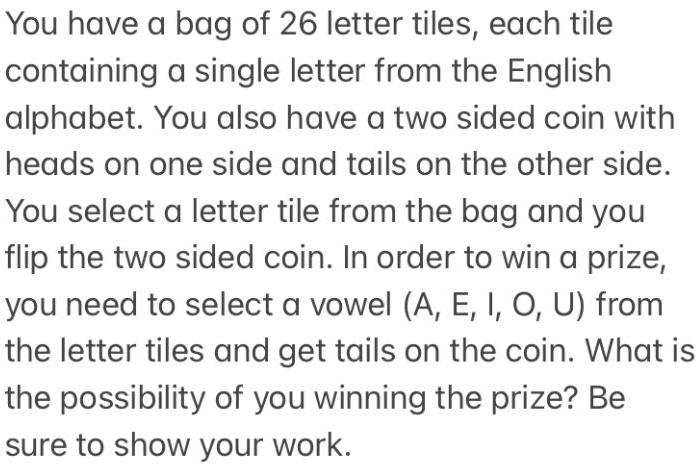
ProbabilityYou have a bag of 26 letter tiles, each tile containing a single letter from the English alphabet. You also have a two sided coin with heads on one side and tails on the other side. You select a letter tile from the bag and you flip the two sided coin. In order to win a prize, you need to select a vowel (A, E, I, O, U) from the letter tiles and get tails on the coin. What is the possibility of you winning the prize? Be sure to show your work.

Statistics
ProbabilityInsurance: An insurance company sells a 1-year term life insurance policy to an 77-year-old woman. The woman pays a premium of $1200. If she dies within 1 year, the company will pay $26,000 to her beneficiary. According to the U.S. Centers for Disease Control and Prevention, the probability that an 77-year-old woman will be alive 1 year later is 0.9561. Let X be the profit made by the insurance company.
Statistics
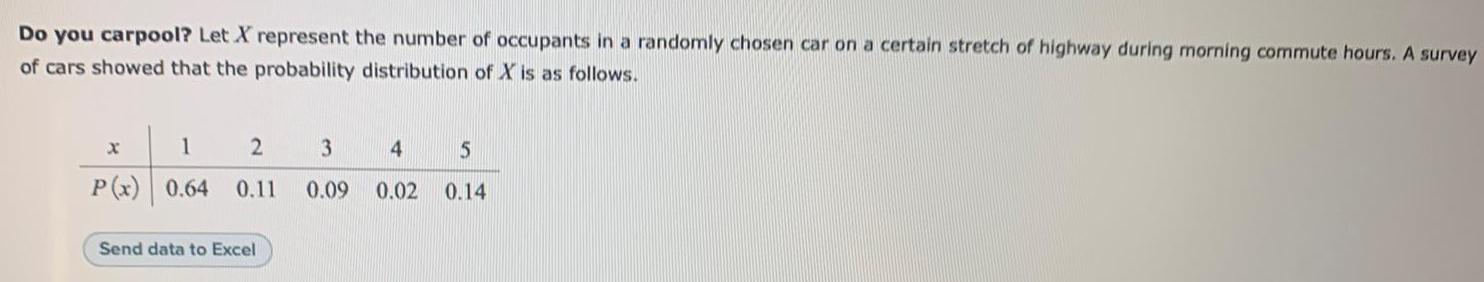
ProbabilityDo you carpool? Let X represent the number of occupants in a randomly chosen car on a certain stretch of highway during morning commute hours. A survey of cars showed that the probability distribution of X is as follows.
x 1 2 3 4 5
P(x) 0.64 0.11 0.09 0.02 0.14
Statistics
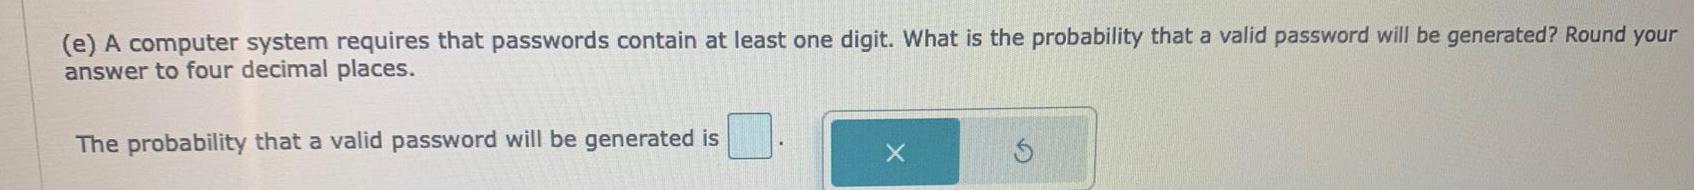
Probability(e) A computer system requires that passwords contain at least one digit. What is the probability that a valid password will be generated? Round your answer to four decimal places.
The probability that a valid password will be generated is
Statistics
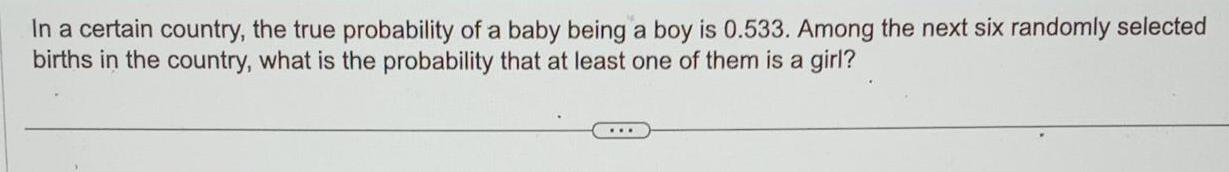
ProbabilityIn a certain country, the true probability of a baby being a boy is 0.533. Among the next six randomly selected births in the country, what is the probability that at least one of them is a girl?
Statistics
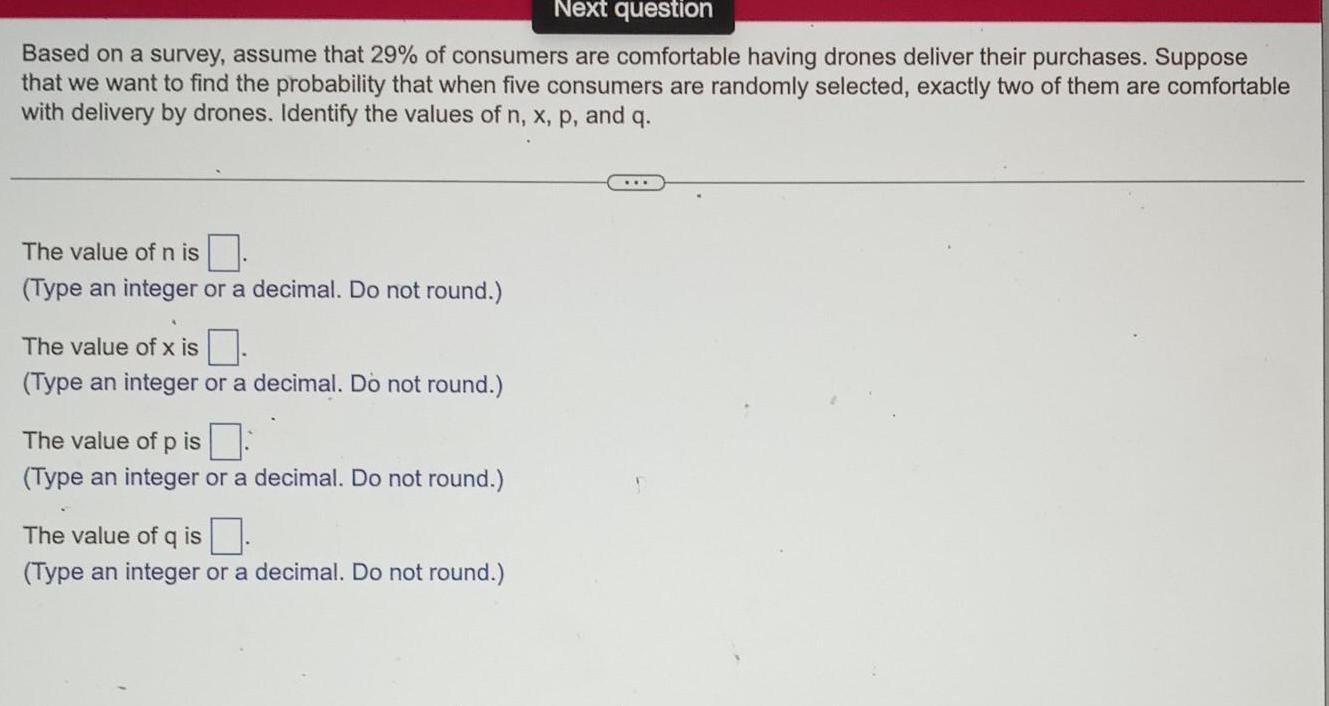
ProbabilityBased on a survey, assume that 29% of consumers are comfortable having drones deliver their purchases. Suppose that we want to find the probability that when five consumers are randomly selected, exactly two of them are comfortable with delivery by drones. Identify the values of n, x, p, and q.
The value of n is.
The value of x is
The value of p is
The value of q is.
Statistics
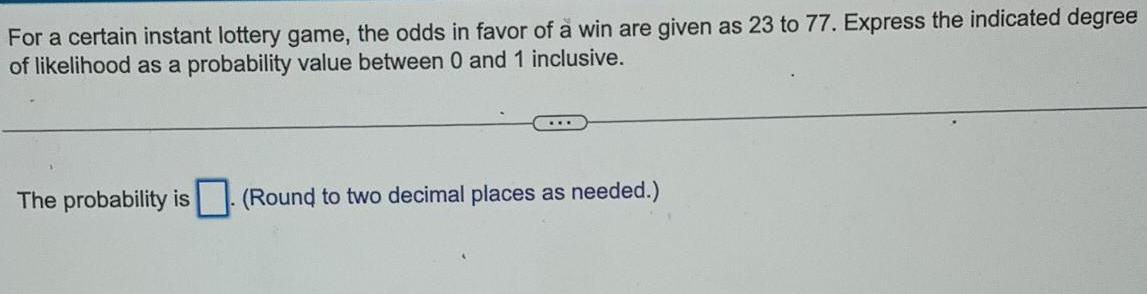
ProbabilityFor a certain instant lottery game, the odds in favor of a win are given as 23 to 77. Express the indicated degree of likelihood as a probability value between 0 and 1 inclusive.
The probability is
Statistics
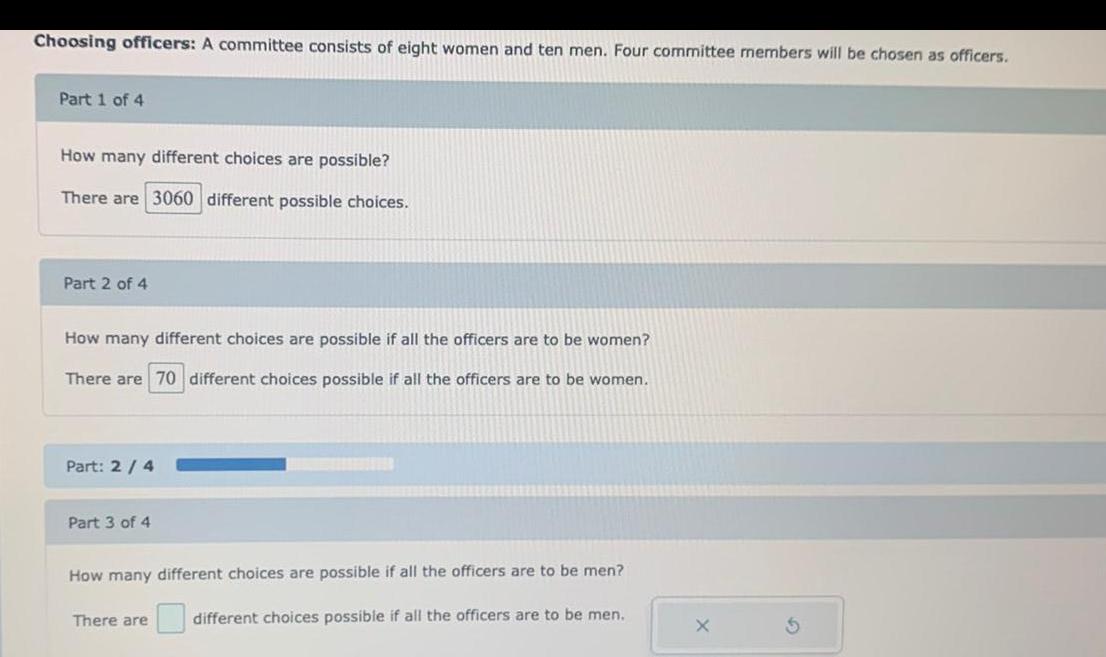
ProbabilityChoosing officers: A committee consists of eight women and ten men. Four committee members will be chosen as officers.
How many different choices are possible?
There are different possible choices.
How many different choices are possible if all the officers are to be women?
There are different choices possible if all the officers are to be women.
How many different choices are possible if all the officers are to be men?
There are different choices possible if all the officers are to be men.
Statistics
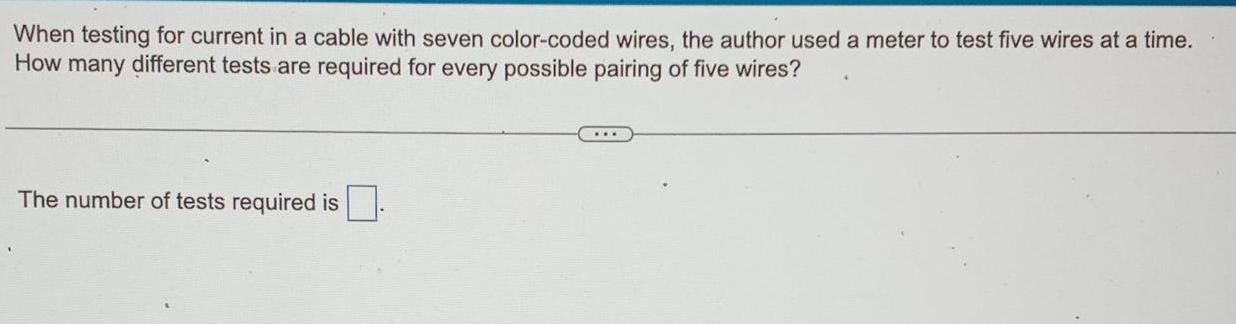
ProbabilityWhen testing for current in a cable with seven color-coded wires, the author used a meter to test five wires at a time. How many different tests are required for every possible pairing of five wires?
The number of tests required is.

Statistics
ProbabilityWhen testing for current in a cable with eleven color-coded wires, the author used a meter to test three wires at a time. How many different tests are required for every possible pairing of three wires?

Statistics
ProbabilityGoogle it: According to a report of the Nielsen Company, 60% of internet searches used the Google search engine. Assume that a sample of 23 searches is studied. Round the answers to at least four decimal places.
(a) What is the probability that exactly 18 of them used Google?
The probability that exactly 18 of them used Google is

Statistics
ProbabilityCar inspection: Of all the registered automobiles in Colorado, 5% fail the state emissions test. Twelve automobiles are selected at random to undergo emissions test. Round the answers to at least four decimal places.
(a) Find the probability that exactly three of them fail the test.
The probability that exactly three of them fail the test is
(b) Find the probability that fewer than three of them fail the test.
The probability that fewer than three of them fail the test is
(c) Find the probability that more than two of them fail the test.
The probability that more than two of them fail the test is

Statistics
ProbabilityEach of two parents has the genotype green/brown, which consists of the pair of alleles that determine
eye color, and each parent contributes one of those alleles to a child. Assume that if the child has at least one green allele, that color will dominate and the child's eye color will be green.
a. List the different possible outcomes. Assume that these outcomes are equally likely.
b. What is the probability that a child of these parents will have the brown/brown genotype?
c. What is the probability that the child will have green eye color?
***
a. List the possible outcomes.
A. green/green, green/brown, and brown/brown
B. green/brown and brown/green
C. green/green, green/brown, brown/green, and brown/brown
D. green/green and brown/brown
b. The probability that a child of these parents will have the brown/brown genotype is 0.25
(Round to two decimal places as needed.)
c. The probability that the child will have green eye color is.
(Round to two decimal places as needed.)