Probability Questions and Answers

Statistics
ProbabilityA fish story: The mean length of one-year-old spotted flounder, in millimeters, is 133 with a standard deviation of 19, and the mean length of two-year-old spotted flounder is 168 with a standard deviation of 32. The distribution of flounder lengths is approximately bell-shaped.
(a) Anna caught a one-year-old flounder that was 150 millimeters in length. What is the z-score for this length? Round the answer to at least two decimal places.
Anna's z-score is

Statistics
ProbabilityA binomial experiment consists of 18 trials. The probability of success on trial 11 is 0.41.
What is the probability of success on trial 15?
0.41
0.64
0.72
0.52
0.86
0.3

Statistics
ProbabilityIn a survey of 777 homeowners with high-speed Internet, the average monthly cost of a high-speed Internet plan was $64.88 with standard deviation $11.14. Assume the plan costs to be approximately bell-shaped. Estimate the number of plans that cost between $53.74 and $76.02. Round to the nearest whole number.

Statistics
ProbabilityLunch break: In a recent survey of 655 working Americans ages 25-34, the average weekly amount spent on lunch was $43.99 with standard deviation $2.65. The weekly amounts are approximately bell-shaped.

Statistics
ProbabilityInternet providers: In a survey of 805 homeowners with high-speed Internet, the average monthly cost of a high-speed Internet plan was $71.98 with standard deviation $12.66. Assume the plan costs to be approximately bell-shaped. Estimate the number of plans that cost between $59.32 and $84.64. Round to the nearest whole number.

Statistics
ProbabilityIn a hybrid corn research project, 200 seeds were planted, and 110 of them germinated. Find the empirical probability that any particular seed of this type will germinate.
The empirical probability is.
(Type an integer or decimal rounded to three decimal places as needed.)

Statistics
ProbabilityInternet providers: In a survey of 831 homeowners with high-speed Internet, the average monthly cost of a high-speed Internet plan was $55.82 with standard deviation $11.82. Assume the plan costs to be approximately bell-shaped. Estimate the number of plans that cost between $44 and $67.64. Round to the nearest whole number.
The number of plans that cost between $44 and $67.64 is

Statistics
ProbabilityIn a study, 61 people were given 25 dollars and told to place bets on a coin flip which they were told was biased. The coin would flip heads 60% of the time. They were allowed to bet for a total

Statistics
ProbabilityVolunteering: The General Social Survey asked 1298 people whether they performed any volunteer work during the past year. A total of 529 people said they did.
(a) Find a point estimate for the proportion of people who performed volunteer work during the past year. Round the answer to at least three decimal places.
The point estimate for the proportion of people who performed volunteer work during the past year is
(b) Construct a 98% confidence interval for the proportion of people who performed volunteer work during the past year. Round the answer to at least three decimal places.
A 98% confidence interval for the proportion of people who performed volunteer work during
the past year is

Statistics
ProbabilityConceptually, the independent samples t test equation assesses the ratio of the actual difference between two sample means relative to standard error--namely, how much difference should exist, on average, between two sample means when the null hypothesis is true.
True
False

Statistics
ProbabilityContaminated water: In a sample of 43 water specimens taken from a construction site, 27 contained detectable levels of lead.
(a) Construct a 99.8% confidence interval for the proportion of water specimens that contain detectable levels of lead. Round the answer to at least three decimal places.
A 99.8% confidence interval for the proportion of water specimens that contain detectable levels of lead is
(b) Construct an 80% confidence interval for the proportion of water specimens that contain detectable levels of lead. Round the answer to at least three decimal places.
An 80% confidence interval for the proportion of water specimens that contain detectable
levels of lead is

Statistics
ProbabilityA researcher expects that a newly developed shoe used by a sample of n = 6 individuals will reduce running speeds compared to a sample of n = 11 individuals using a control condition shoe. The critical region for the one-tailed hypothesis test with α = .05 is t = +1.753.
True
False

Statistics
ProbabilityAlthough t tests are affected by sample size, sample size does not influence measures of effect size, such as Cohen's d
True
False

Statistics
ProbabilityLacy draws a heart from a standard deck of 52 cards. Without replacing the first card, she then proceeds to draw a second card and gets a diamond.
Are these events independent? Input Yes or No:
Determine the probability of drawing a heart and then a diamond without replacement. Write your answer in decimal form, rounded to four decimal places as needed. Answer = Linda draws a heart from a standard deck of 52 cards. She returns the heart to the deck, then draws a second card. Her second card is a diamond.
Are these events independent? Input Yes or No:
Determine the probability of drawing a heart and then a diamond with replacement. Write your answer in decimal form, rounded to four decimal places as needed. Answer =

Statistics
ProbabilityAn American roulette wheel has 38 slots: 18 red, 18 black, and 2 green.
What are the odds for the ball landing in a green slot?
to
What are the odds aganst the ball landing in a green slot?
to

Statistics
ProbabilityIf the odds for a certain event are 7 to 5, what is the probability of the event occurring? Write your answer as a simplified fraction.

Statistics
ProbabilityThe probability that event A will occur is P(A) = 0.42.
What is the probability (in decimal form) that event A will not occur? P(A) =
What are the odds for event A?
What are the odds against event A?
to
to

Statistics
ProbabilitySuppose the probability of an event is 40/41
What are the odds for the event happening?
to
What are the odds against the event happening?
to

Statistics
ProbabilityIn Alex's drawer she has 9 pairs of socks, 7 of which are white, and 12 tee shirts, 4 of which are white.
The probability of choosing a white pair of socks is
The probability of choosing a white tee shirt is
The probability of both being white is

Statistics
ProbabilityBailey borrowed $4000 at prime plus 1.5% on January 5th of a non-leap year. The loan requires fixed monthly payments of $1000 on the first day of each month. The prime rate was 13.5% on January 5th and increased to 14. 25% effective February 15th, and 14.75% effective April 23rd. Construct the loan repayment schedule.

Statistics
ProbabilityIf the odds against a certain event are 15 to 8, what is the probability of the event occuring? Write your answer as a simplified fraction.

Statistics
ProbabilityThe letters in the word ARIZONA are scrambled.
Write your answers in decimal form. Round to the nearest thousandth as needed.
What is the probability that the first letter is A?
What is the probability that the first letter is Z?
What is the probability that the first letter is a vowel?
What is the probability that the first letter is H?

Statistics
ProbabilityMelissa a number cube 1000 times and got the following results.
Outcome Rolled 1 2 3 4 5 6
Number of Rolls 166 164 182 153 182 153
Fill in the table below. Round your answers to the nearest thousandth.
(a) From Melissa's results, compute the experimental probability of rolling a 3 or 4.
(b) Assuming that the cube is fair, compute the theoretical probability of rolling a 3 or 4.
(c) Assuming that the cube is fair, choose the statement below that is true:
The larger the number of rolls, the greater the likelihood that the experimental
probability will be close to the theoretical probability.
The smaller the number of rolls, the greater the likelihood that the experimental
probability will be close to the theoretical probability.
The experimental probability will never be very close to the theoretical probability, no
matter the number of rolls.

Statistics
ProbabilityAccording to a survey, 61% of murders committed last year were cleared by arrest or exceptional means. Fifty murders committed last year are randomly selected, and the number cleared by arrest or exceptional means is recorded.
(a) Find the probability that exactly 40 of the murders were cleared.
(b) Find the probability that between 36 and 38 of the murders, inclusive, were cleared.
(c) Would it be unusual if fewer than 20 of the murders were cleared? Why or why not?
(a) The probability that exactly 40 of the murders were cleared is
(Round to four decimal places as needed.)
(b) The probability that between 36 and 38 of the murders, inclusive, were cleared is
(Round to four decimal places as needed.)

Statistics
ProbabilityA scout leader is going to pair a new member with one of the existing 15 troop members. Five of the boys love to go camping, ten like to fish, three enjoy archery, twelve like to go hiking, and one boy enjoys carving. What is the probability the new boy will be paired with a boy who loves camping?

Statistics
ProbabilityA bag of M&M's has 5 red, 4 green, 8 blue, and 3 yellow M&M's. What is the probability of randomly picking: (give answer as a reduced fraction)
1) a yellow?
2) a blue or green?
3) an orange?

Statistics
ProbabilityRoller coaster ride: A roller coaster is being designed that will accommodate 60 riders. The maximum weight the coaster can hold safely is 12,000 pounds. According to the National Health Statistics Reports, the weights of adult U.S. men have mean 194
pounds and standard deviation 68 pounds, and the weights of adult U.S. women have mean 164 pounds and standard deviation 77 pounds. Use the TI-84 Plus calculator.
(a) If 60 people are riding the coaster, and their total weight is 12,000 pounds, what is their average weight?
The age weight is 200 pounds.
(b) If a random sample of 60 adult men ride the coaster, what is the probability that the maximum safe weight will be exceeded? Round the answer to at least four decimal places.
If a random sample 60 adult men ride the coaster, the probability that the maximum safe
weight will be exceeded is 11,640

Statistics
ProbabilityAn experiment done in such a way that neither the subjects nor the researchers know which subjects are in the treatments group and which are in the control group is called:
Double negative.
Double blind.
Double sided.
Double jeopardy.
Single blind.

Statistics
ProbabilityA study found that college students who live off-campus are significantly more likely to drink alcohol than those who live on-campus. Which of the following conclusions is correct?
There seems to be an association between where a college student lives and whether or not they drink alcohol.
This is clear evidence to suggest students need to live on-campus.
The results are statistically significant and hence of practical importance to require students to live on-campus especially if they are underage.
It is appropriate to conclude that being a drinker causes a student to more likely to live off-campus.
It is appropriate to conclude that living off-campus causes a student to be more likely to drink alcohol.

Statistics
ProbabilityTo determine the effectiveness of a new pain reliever, a randomly chosen group of pain sufferers is assigned to take the new drug, and another randomly chosen group is assigned to take a placebo. The subjects taking the new drug experienced substantially more pain relief than those taking the placebo. The research team concluded that the new drug is effective in relieving pain. Which of following is correct?
Since this study was confounded with a new pain reliever no conclusions should be drawn.
There is a positive association between pain and the new drug.
This is a matched paired design that showed pain sufferers' improvement after taking the medication.
Since this study was a randomized experiment the conclusion by the research team is well justified.
Since this was an observational study the conclusion by the research team is not well justified.

Statistics
ProbabilityA die is rolled. Find the probability of the given event.
Write your answers as whole numbers or reduced fractions.
(a) The number showing is a 4
P(4) =
(b) The number showing is an even number
P(even) =
(c) The number showing is greater than 5
P(greater than 5) =

Statistics
ProbabilityA ball is drawn randomly from a jar that contains 8 red balls, 4 white balls, and 6 yellow balls. Find the probability of the given event. Write your answers as reduced fractions or whole numbers.
(a) P(A red ball is drawn) =
(b) P(A white ball is drawn) =
(c) P(A yellow ball is drawn) =
(d) P(A green ball is drawn) =

Statistics
ProbabilityA jar contains 8 red marbles numbered 1 to 8, 10 blue marbles numbered 1 to 10, and 4 white marbles numbered 1 to 4. A marble is drawn at random from the jar. Find the probability of the given event. Write your answers as integers or reduced fractions.
(a) The marble is red.
(b) The marble is not red.
(c) The marble has the number 3 written on it.
(d) The marble is blue with the number 2 written on it.
(e) The marble has the number 18 written on it.

Statistics
ProbabilityIf the probability of an event is 33/59 what is the probability of the event not happening?
Write your answer as a simplified fraction.

Statistics
ProbabilityIf the probability of an event not happening is 36/43 what is the probability of the event happening?
Write your answer as a simplified fraction.

Statistics
ProbabilityData on pulse rates was collected from a random sample of 100 students from ETSU.
We find a 95% confidence interval for mean pulse rate to be (65, 72). Which of the
following is the correct interpretation of this interval?
The probability is .95 that the mean is in this interval.
We are 95% sure that the mean pulse rate for all US college students is between
65 and 72 beats per minute.
We are 95% confident that the mean pulse rate for this sample of students will
fall between 65 and 72 beats per minute.
We are 95% confident that the mean pulse rate of all ETSU students is between
65 and 72 beats per minute.
We are 95% sure that all students will have pulse rates between 65 and 72 beats
per minute.

Statistics
ProbabilityA researcher investigating whether people who got a COVID-19 vaccination are less
likely to get COVID than people who didn't get the vaccine found a P-value of 3%.
This means that
3% of the vaccinated people got COVID.
the differences observed would occur only 3% of the time if vaccinations had no
effect on getting COVID.
Othere's a 3% chance that vaccinated people don't get fewer COVID symptoms.
vaccinated people get 3% fewer COVID symptoms than non-vaxxers.
there's a 3% chance that vaccinated people get fewer COVID symptoms.

Statistics
ProbabilityA friend of yours claims that they are a 75% free-throw shooter in basketball. You
don't think she is that good and want to test her to gather evidence that she makes
less than 75% of her free throws in the long run. You have her shoot 40 free throws
and she makes 26 (or 65%) of them. You run your hypothesis test and find a p-value
of 0.1150. Which of the following is the best way to state the conclusion? Use x =
0.05.
Because your p-value is not small enough, there is not strong evidence that your
friend is less than 75% free-throw shooter in the long run.
Because the p-value is large, there is strong evidence that your friend is a 75%
free-throw shooter in the long run.
Because the p-value is small, there is strong evidence that your friend is a 75%
free-throw shooter in the long run.
Because the p-value is large, there is strong evidence that your friend is a 65%
free-throw shooter in the long run.

Statistics
ProbabilityThe most important condition for sound conclusions from statistical inference is
usually that
the population distribution is exactly Normal.
O the data contain no outliers.
the sample size is as large as possible.
the standard deviation is known.
the data can be thought of as a random sample from the population of interest.

Statistics
ProbabilityA 2019 study collected by eMarketer asked 800 US smartphone users whether they
had used a food delivery app at least once in the last month. The survey also asked
which food delivery app, if any, was used. The survey showed that 16.5% of the
respondents had used a food delivery app in the last month. Of those that used one,
27.6% used DoorDash, 26.7% used Grubhub, 25.2% used UberEats, while the rest
used another. To display this data you should use a
stem-and-leaf plot.
histogram.
time-plot.
bar graph.
five-number summary.

Statistics
ProbabilityThirty small communities in Connecticut (population near 10,000 each) gave an average of x= 139.4 reported cases of larceny per year. Assume that o is known to be 42.7 cases per year.
(a) Find a 90% confidence interval for the population mean annual number of reported larceny cases in such communities. What is the margin of error? (Round your answers to one decimal place.)
lower limit
upper limit
margin of error
(b) Find a 95% confidence interval for the population mean annual number of reported larceny cases in such communities. What is the margin of error? (Round your answers to one decimal place.)
lower limit
upper limit
margin of error
(c) Find a 99% confidence interval for the population mean annual number of reported larceny cases in such communities. What is the margin of error? (Round your answers to one decimal place.)
lower limit
upper limit
margin of error
(d) Compare the margins of error for parts (a) through (c). As the confidence levels increase, do the margins of error increase?
As the confidence level increases, the margin of error increases.
O As the confidence level increases, the margin of error decreases.
As the confidence level increases, the margin of error remains the same.
(e) Compare the lengths of the confidence intervals for parts (a) through (c). As the confidence levels increase, do the confidence intervals increase in length?
O As the confidence level increases, the confidence interval remains the same length.
O As the confidence level increases, the confidence interval increases in length.
O As the confidence level increases, the confidence interval decreases in length.

Statistics
ProbabilityThe alpha level is a probability value that defines the sample means that will be classified as very unlikely in a
hypothesis test.
True
False

Statistics
ProbabilityElevator ride: Engineers are designing a large elevator that will accommodate 47 people. The maximum weight the elevator can
hold safely is 9165 pounds. According to the National Health Statistics Reports, the weights of adult U.S. men have mean 173
pounds and standard deviation 69 pounds, and the weights of adult U.S. women have mean 165 pounds and standard deviation
78 pounds. Use the TI-84 Plus calculator.
Part 1 of 3
(a) If 47 people are on the elevator, and their total weight is 9165 pounds, what is their average weight?
The average weight is
Part 2 of 3
pounds.
(b) If a random sample of 47 adult men ride the elevator, what is the probability that the maximum safe weight will be
exceeded? Round the answer to at least four decimal places.
The probability that the maximum safe weight will be exceeded is

Statistics
ProbabilityHigh-rent district: The mean monthly rent for a one-bedroom apartment without a doorman in Manhattan is $2676. Assume the
standard deviation is $509. A real estate firm samples 108 apartments. Use the TI-84 Plus calculator.
Part 1 of 5
(a) What is the probability that the sample mean rent is greater than $2746? Round the answer to at least four decimal
places.
The probability that the sample mean rent is greater than $2746 is
Part 2 of 5
(b) What is the probability that the sample mean rent is between $2550 and $2555? Round the answer to at least four
decimal places.
The probability that the sample mean rent is between $2550 and $2555 is

Statistics
ProbabilityA sample of size 31 will be drawn from a population with mean 39 and standard deviation 9. Use the TI-84 Plus calculator.
(a) Is it appropriate to use the normal distribution to find probabilities for x?
(b) Find the probability that x will be between 40 and 41. Round the answer to at least four decimal places.
rd
(c) Find the 33 percentile of x. Round the answer to at least two decimal places.
It is appropriate to use the normal distribution to find probabilities for x.
The probability that x will be between 40 and 41 is
The 33rd percentile of x is
It is not appropriate to use the normal distribution to find probabilities for x.

Statistics
ProbabilitySAT scores: Assume that in a given year the mean mathematics SAT score was 522, and the standard deviation was 116. A
sample of 66 scores is chosen. Use the TI-84 Plus calculator.
Part 1 of 5
(a) What is the probability that the sample mean score is less than 509? Round the answer to at least four decimal places.
The probability that the sample mean score is less than 509 is
Part 2 of 5
(b) What is the probability that the sample mean score is between 486 and 525? Round the answer to at least four decimal
places.
The probability that the sample mean score is between 486 and 525 is
Part 3 of 5
(c) Find the 90th percentile of the sample mean. Round the answer to at least two decimal places.
The 90th percentile of the sample mean is

Statistics
ProbabilityExit polling is a popular technique used to determine the outcome of an election prior to results being tallied. Suppose a referendum to increase funding for
education is on the ballot in a large town (voting population over 100,000). An exit poll of 400 voters finds that 204 voted for the referendum. How likely are the
results of your sample if the population proportion of voters in the town in favor of the referendum is 0.49? Based on your result, comment on the dangers of using
exit polling to call elections.
The probability that more than 204 people voted for the referendum is 0.2118
(Round to four decimal places as needed.)
Comment on the dangers of using exit polling to call elections. Choose the correct answer below.
A. The result is not unusual because the probability that p is equal to or more extreme than the sample proportion is greater than 5%. Thus, it is not unusual for a wrong call to be made in an election if exit polling alone is considered.
B. The result is unusual because the probability that is equal to or more extreme than the sample proportion is less than 5%. Thus, it is unusual for a wrong call to be made in an election if exit polling alone is considered.
C. The result is not unusual because the probability that p is equal to or more extreme than the sample proportion is less than 5%. Thus, it is unusual for a wrong call to be made in an election if exit polling alone is considered.
D. The result is unusual because the probability that p is equal to or more extreme than the sample proportion is greater than 5%. Thus, it is not unusual for a wrong call to be made in an election if exit polling alone is considered.
Statistics
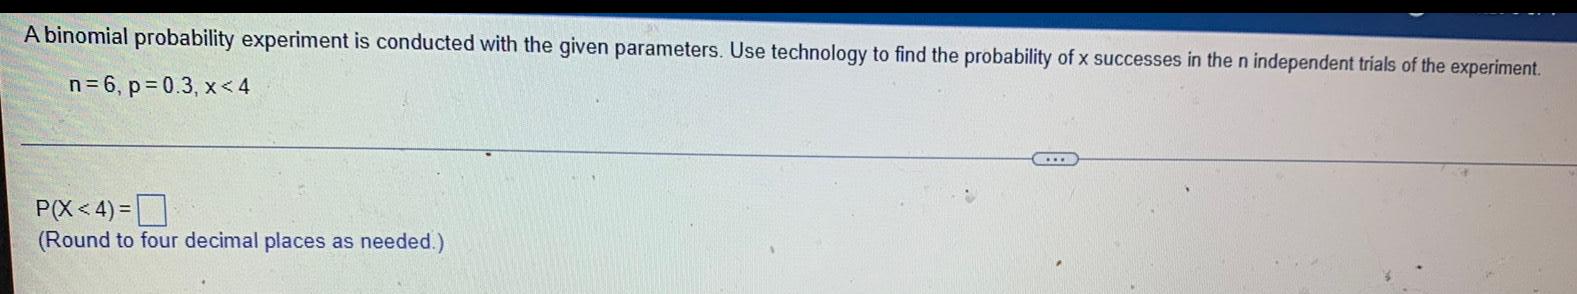
ProbabilityA binomial probability experiment is conducted with the given parameters. Use technology to find the probability of x successes in the n independent trials of the experiment.
n=6, p=0.3, x<4
P(X<4)=
(Round to four decimal places as needed.)
Statistics
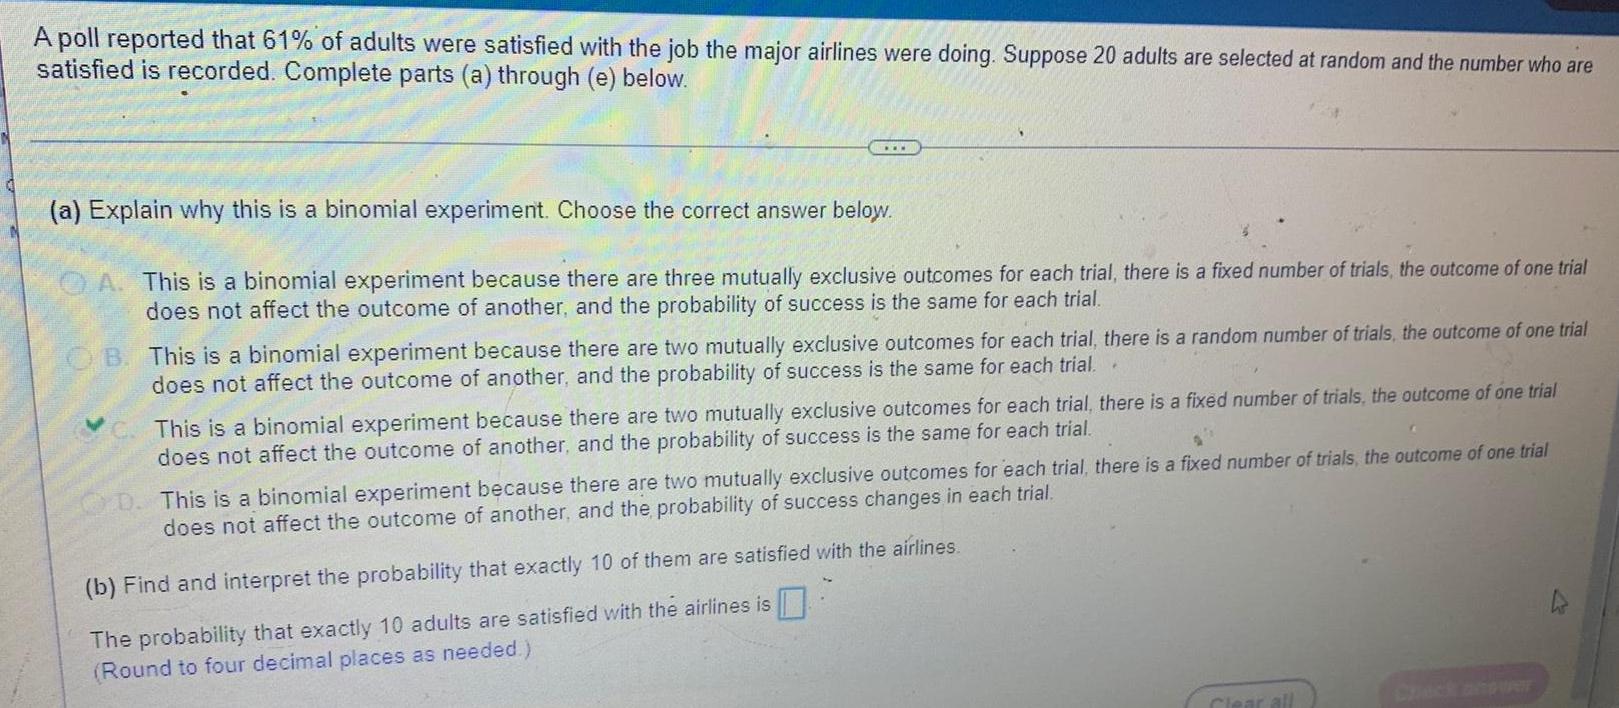
ProbabilityA poll reported that 61% of adults were satisfied with the job the major airlines were doing. Suppose 20 adults are selected at random and the number who are satisfied is recorded. Complete parts (a) through (e) below.
(a) Explain why this is a binomial experiment. Choose the correct answer below.
A. This is a binomial experiment because there are three mutually exclusive outcomes for each trial, there is a fixed number of trials, the outcome of one trial does not affect the outcome of another, and the probability of success is the same for each trial.
B. This is a binomial experiment because there are two mutually exclusive outcomes for each trial, there is a random number of trials, the outcome of one trial does not affect the outcome of another, and the probability of success is the same for each trial..
This is a binomial experiment because there are two mutually exclusive outcomes for each trial, there is a fixed number of trials, the outcome of one trial does not affect the outcome of another, and the probability of success is the same for each trial.
D. This is a binomial experiment because there are two mutually exclusive outcomes for each trial, there is a does not affect the outcome of another, and the probability of success changes in each trial.
(b) Find and interpret the probability that exactly 10 of them are satisfied with the airlines.
The probability that exactly 10 adults are satisfied with the airlines is
(Round to four decimal places as needed.)
Statistics
ProbabilityAccording to an almanac, 70% of adult smokers started smoking before turning 18 years old.
(a) If 200 adult smokers are randomly selected, how many would we expect to have started smoking before turning 18 years old?
(b) Would it be unusual to observe 180 smokers who started smoking before turning 18 years old in a random sample of 200 adult smokers? Why?