Statistics Questions
The best high school and college tutors are just a click away, 24×7! Pick a subject, ask a question, and get a detailed, handwritten solution personalized for you in minutes. We cover Math, Physics, Chemistry & Biology.

Statistics
StatisticsSuppose I want to test whether students textbook costs for this semester are higher on average than the average cost of 450 in 2000 What would be an appropriate alternative hypothesis Choose the correct answer below OA 450 OB 450 OC 450 OD x 450
Statistics
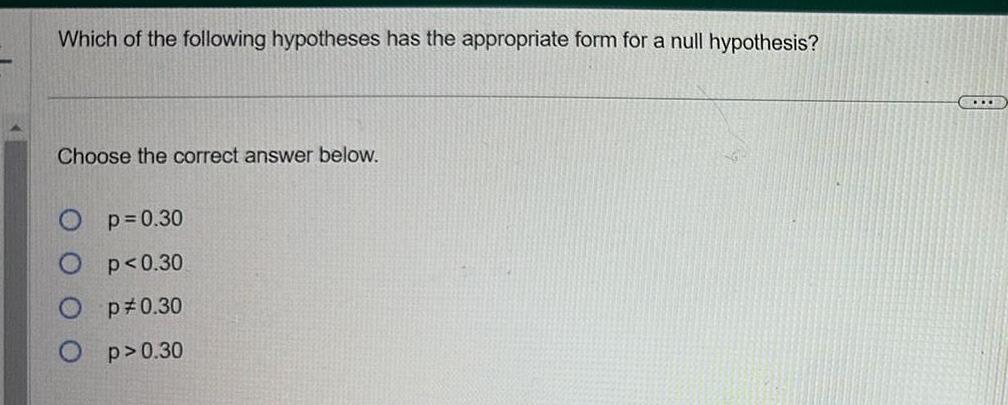
ProbabilityWhich of the following hypotheses has the appropriate form for a null hypothesis Choose the correct answer below Op 0 30 O p 0 30 Op 0 30 O p 0 30

Statistics
Statisticse are several scatterplots The calculated correlations are 0 021 0 951 0 736 and 0 923 ch is which MY tch each scatterplot with its calculated correlation a c b d

Statistics
StatisticsDescribe how the shape center and spread of t models change as the number of degrees of freedom increases Choose the correct answer below O A Shape becomes farther from Normal center does not change spread becomes wider OB Shape becomes farther from Normal center does not change spread becomes narrower OC Shape becomes closer to Normal center does not change spread becomes wider O D Shape becomes closer to Normal center does not change spread becomes narrower

Statistics
StatisticsA very large study showed that aspirin reduced the rate of first heart attacks by 50 A pharmaceutical company thinks it has a drug that will be more effective than aspirin and plans to do a randomized clinical trial to test the new drug Complete parts a through d below b What is their alternative hypothesis OA The new drug is less effective than aspirin OB The new drug is not more effective than aspirin OC The new drug is more effective than aspirin OD The new drug is as effective as aspirin COLLE c The company conducted the study and found that the group using the new drug had somewhat fewer heart attacks than those in the aspirin group The P value from the hypothesis test was 0 29 What do you conclude OA There is evidence to conclude that the alternative hypothesis is true because the P value was so small OB There is not sufficient evidence to conclude that the alternative hypothesis is true because the P value was so small OC There is not sufficient evidence to conclude that the alternative hypothesis is true because the P value was so large OD There is evidence to conclude that the alternative hypothesis is true because the P value was so large d What would you have concluded if the P value had been 0 015 A There is evidence to conclude that the alternative hypothesis is true because the P value was so small OB There is evidence to conclude that the alternative hypothesis is true because the P value was so large OC There is not sufficient evidence to conclude that the alternative hypothesis is true because the P value was so small P There is not sufficient evidence to conclude that the alternative hypothesis is true because the P value was so large
Statistics
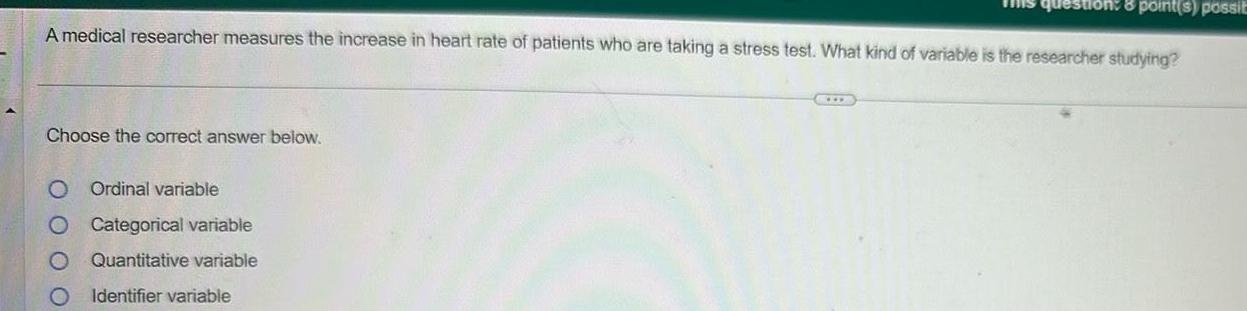
ProbabilityA medical researcher measures the increase in heart rate of patients who are taking a stress test What kind of variable is the researcher studying Choose the correct answer below O O O O 8 point s possit Ordinal variable Categorical variable Quantitative variable Identifier variable

Statistics
StatisticsFor many people breakfast cereal is an important source of fiber in their diets Cereals also contain potassium a mineral shown to be associated with maintaining a healthy blood pressure An analysis of the amount of fiber in grams and the potassium content in milligrams in servings of 77 breakfast cereals produced the regression model Potassium 27 27Fiber If your cereal provides 9 grams of fiber per serving how much potassium does the model estimate you will get milligrams of potassium

Statistics
StatisticsIt the 1980s it was generally believed that congenital abnormalities affected about 8 of a large nation s children Some people believe that the increase in the number of chemicals in the environment has led to an increase in the incidence of abnormalities A recent study examined 351 randomly selected children and found that 37 of them showed signs of an abnormality Is this strong evidence that the risk has increased We consider a P value of around 5 to represent reasonable evidence Complete parts a through f Assume the independence assumption is met a Write appropriate hypotheses Let p be the proportion of children with genetic abnormalities Choose the correct answer below OA Ho p 0 08 vs HA p 0 08 O C Ho p 0 08 vs HA p 0 08 OB Ho p 0 1054 vs HA p 0 1054 O D Ho p 0 1054 vs HA p 0 1054 OF Ho p 0 1054 vs HA p 0 1054 O E Ho p 0 08 vs HA P 0 08 b Check the necessary assumptions Which of the following are satisfied Select all that apply A There are more than 10 successes and 10 failures B Less than 10 of the population was sampled C The sample is random D The independence assumption is satisfied c Perform the mechanics of the test What is the P value Round to three decimal places as needed d Explain carefully what the P value means in this context Choose the correct answer below P value O A The P value is the chance of observing 37 or more children with genetic abnormalities in a random sample of 351 children OB The P value is the chance of observing 37 or more children with genetic abnormalities in a random sample of 351 children if 8 of children actually have genetic abnormalities The P value is the actual percentage of children who have genetic abnormalities OS

Statistics
StatisticsThe actual volumes of quart size bottles of Heinz Ketchup are uniformly distributed from 31 44 to 32 5 fluid ounces Find the standard deviation in volumes of quart size Heinz Ketchup bottles in fluid ounces NOTE There are 32 fluid ounces in a quart 0 2968 0 3152 0 3366 0 2754 0 3060 0 3274

Statistics
Statistics10 pts In September 2007 only 48 of working class households said their incomes were falling behind the cost of living A survey of 50 random working class households in early February 2008 found that 32 of them now felt their incomes were falling behind Do these data provide sufficient evidence at the 0 01 level of significance to conclude that the proportion of working class households who say their incomes are falling behind the cost of living is higher in February 2008 than it was in September 2007 a What type of test are we using Since we have a single sample working class households and are comparing the proportions for the same at two differe times this is a paired sample test Since we re interested in whether the proportion in February 2008 is higher than in September 2007 this is a right tailed test b Do we meet the assumptions for normality for this type of test justify your response Since the sample size is 50 and therefore greater than 30 we can reasonably assume normality is present c Write the hypotheses for this test symbolically H 48 Ha 48 d Find the sample statistic test statistic and p value Sketch a distribution that shows your p value either with your sample statistic or your test statistic

Statistics
StatisticsConsider the density curve plotted below 0 055 0 05 0 045 0 04 0 035 PDF X 1 Q3 0 03 0 025 0 02 0 015 ODI 0 005 10 12 Find P X 26 Find P X 28 14 16 Calculate the following Q1 median Density Curve 18 20 22 X 24 26 28 30 Q

Statistics
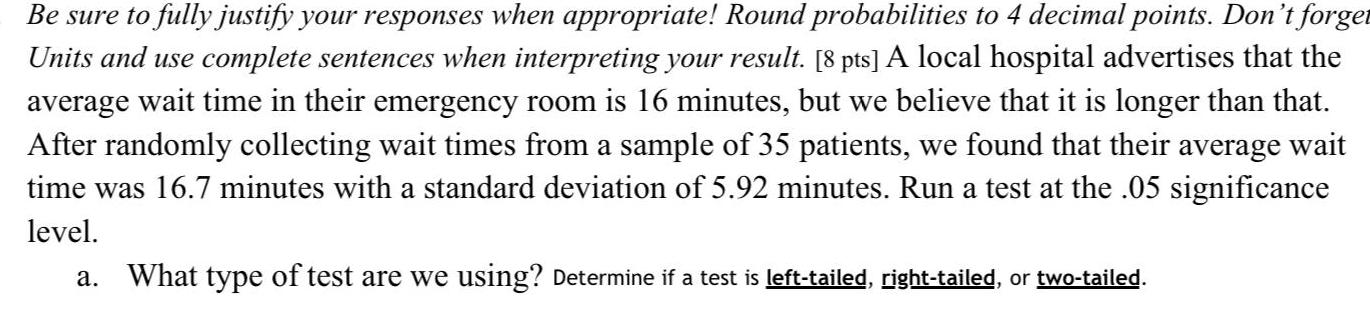
StatisticsUnits and use complete sentences when interpreting your result 8 pts A local hospital advertises that the average wait time in their emergency room is 16 minutes but we believe that it is longer than that After randomly collecting wait times from a sample of 35 patients we found that their average wait time was 16 7 minutes with a standard deviation of 5 92 minutes Run a test at the 05 significance level a What type of test are we using We are using a one sample test as this is appropriate for when we have a sample and want to compare the sample mean to a known population mean Since we re interested in whether the average wait time is significantly less than or greater than 16 minutes this is a two tailed test b Do we meet the assumptions for normality for this type of test justify your response Our sample size of 35 patients is greater than 30 With the central limit theore suggesting that the distribution of the sample mean tends to approach normalit as the sample size increases it is reasonable to assume normality is present c Write the hypotheses for this test symbolically Ho H 16 minutes Ha 16 minutes d Find the sample statistic test statistic and p value You may need to use an online calculator to find your p value https www socscistatistics com pvalues tdistribution aspx or if you have use the TI 84 hypothesis test feature that is also allowed

Statistics
Statistics12 pts I work for a pharmaceutical company and I want to show that our new pill lowers cholesterol I know that by not taking a pill there is a 0 milligram per deciliter mg dl drop in blood cholesterol with a standard deviation of o 13 mg dl Assume that cholesterol is normally distributed In a random sample of 80 men taking the new cholesterol drug I find a drop in the blood cholesterol of 3 mg dl x 3 I need to find out if this is a statistically significant drop Test at the 0 05 significance level a What type of test are we using We are using a one sample test as this is appropriate for when we have a sample and want to compare the sample mean to a known population mean This is a left tailed test since we re interested in whether the new pill lowers cholesterol b Do we meet the assumptions for normality for this type of test justify your response
Statistics
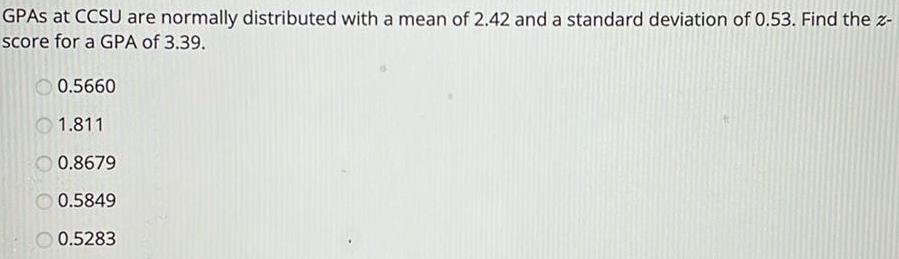
ProbabilityGPAS at CCSU are normally distributed with a mean of 2 42 and a standard deviation of 0 53 Find the z score for a GPA of 3 39 0 5660 1 811 0 8679 0 5849 0 5283
Statistics
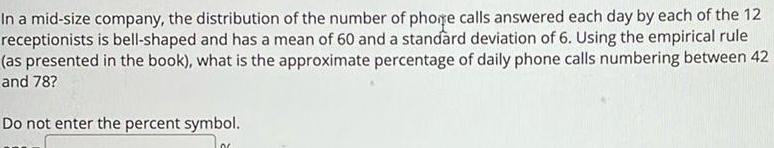
ProbabilityIn a mid size company the distribution of the number of phone calls answered each day by each of the 12 receptionists is bell shaped and has a mean of 60 and a standard deviation of 6 Using the empirical rule as presented in the book what is the approximate percentage of daily phone calls numbering between 42 and 78 Do not enter the percent symbol

Statistics
Statistics10 pts In September 2007 only 48 of working class households said their incomes were falling behind the cost of living A survey of 50 random working class households in early February 2008 found that 32 of them now felt their incomes were falling behind Do these data provide sufficient evidence at the 0 01 level of significance to conclude that the proportion of working class households who say their incomes are falling behind the cost of living is higher in February 2008 than it was in September 2007 a What type of test are we using Since we have a single sample working class households and are comparing the proportions for the same at two differe times this is a paired sample test Since we re interested in whether the proportion in February 2008 is higher than in September 2007 this is a right tailed test b Do we meet the assumptions for normality for this type of test justify your response Since the sample size is 50 and therefore greater than 30 we can reasonably assume normality is present c Write the hypotheses for this test symbolically

Statistics
StatisticsSuppose that the value of a stock varies each day from 12 82 to 26 17 with a uniform distribution Find the upper quartile 25 of all days the stock is above what value Enter your answer to the nearest cent

Statistics
Statistics1 Given the probability density function f x 5 mean the variance and the standard deviation Expected value Mean Variance Standard Deviation over the interval 1 6 find the expected value the
Statistics
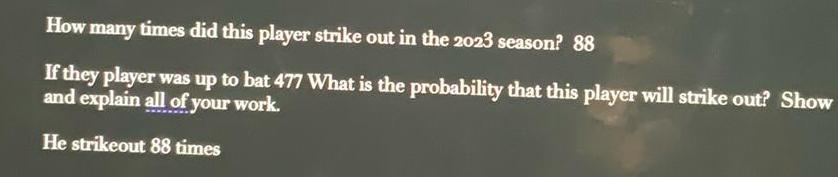
ProbabilityHow many times did this player strike out in the 2023 season 88 If they player was up to bat 477 What is the probability that this player will strike out Show and explain all of your work He strikeout 88 times

Statistics
StatisticsNumber of At Bats for the 2023 season 477 Number of Hits for the 2023 season 156 MATH 153 Statistics Fall 2023 Professor Cotay Baseball Statistics Pro Based on his performance this year what is the probability that this player wo when at bat Show all work Express your answer as a decimal rounded to the thousandth 0 327 1

Statistics
Statisticsou may need to enter an inequality or draw the solution to one on a numberline If you he interval notation for these problems will be easily learned ype in the following inequality 1 From the numberline buttons click the type of point closed or open to represent the inequality symbol solid for or and open for or Then click the corresponding value on the numberline you may add as many points as you d like Now click the line arrow button Click on the point you placed and drag the line to your desired ending point If you would like it to go on indefinitely drag it to the end of the numberline and an arrow will be added Please practice this until you are comfortable with the drawing Features 7 6 5 4 3 2 1 0 1 2 3 4 5 6 7

Statistics
StatisticsSometimes questions ask for fractions reduced fraction or mixed number answers Enter fractions as 2 4 2 for The preview will show you how the computer is interpreting what you typed 4 4 Enter 12 However you should assume the question always wants a reduced fraction as the answer So in the 2 4 2 1 the same as example you should enter 1 2 Some questions will consider 4 2 but you should get in the habit of always reducing your fractions to lowest terms 3 Enter in reduced form 15 Only enter a mixed number if prompted to do so You will enter your mixed number answer like 5 1 3 for 1 5 Notice the space that exists between the 5 and the 1 3 and is needed when typing in your 3 answer Improper fractions will not be accepted Also be sure to reduce the fractional portion of the mixed number to lowest terms Enter 4 as a mixed number 8 15 If the fraction contains more complex terms in the numerator or denominator you will need to use parentheses to create the correct notation for that fraction For example the fraction x 3y 2 z x need to type in x 3y 2 z x you will

Statistics
StatisticsSometimes you will need to enter a mathematical expression that involves a mathematical notation character Some examples Enter To get 3 2 3 9 sqrt 4 4 2 The preview will display how the computer is interpreting what you are typing Enter 62 15 10 Enter 11y 15x Enter 6 2 2

Statistics
Statistics10 pts In September 2007 only 48 of working class households said their incomes were falling behind the cost of living A survey of 50 random working class households in early February 2008 found that 32 of them now felt their incomes were falling behind Do these data provide sufficient evidence at the 0 01 level of significance to conclude that the proportion of working class households who say their incomes are falling behind the cost of living is higher in February 2008 than it was in September 2007 a What type of test are we using Since we have a single group working class households and are comparing the proportions for the same at two differe times this is a paired sample test Since we re interested in whether the proportion in February 2008 is higher than in September 2007 this is a right tailed test b Do we meet the assumptions for normality for this type of test justify your response

Statistics
Statisticsed Starting Line Up In baseball the line up is the order that the players will be at bat Typically nine players make up the starting line up In this section you will create and possibly alter your starting lineup In order to do this you will choose any nine of your players In how many ways can you arrange the line up Round to the nearest thousand Be sure to show explain your work as well as any formulas you use 2 points 4 These are the 9 players Corey seager Nathaniel Lowe Marcus Semien Josh Jung Jonah Heim Sandy Leon Adolis Garcia Leody Taveras Robbie Grossman

Statistics
StatisticsPlayer 1 Name Corey Seager Batting Average 327 Number of At Bats for the 2023 season 477 Number of Hits for the 2023 season 156 Based on his performance this year what is the probability that this player would make a when at bat Show all work Express your answer as a decimal rounded to the nearest thousandth

Statistics
StatisticsIn order to do this you will choose any nine of your players In how many ways can you arrange the line up Round to the nearest thousand Be sure to show explain your work as well as any formulas you use 2 points Corey seager Nathaniel Lowe Marcus Semien Josh Jung Jonah Heim Sandy Icon I
Statistics
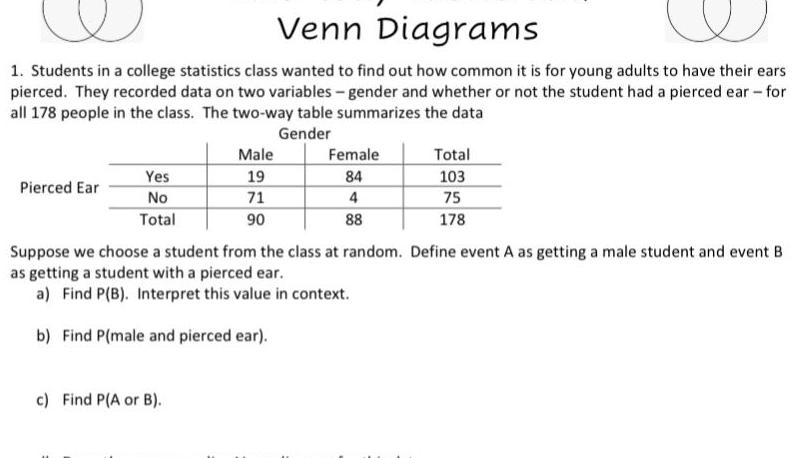
ProbabilityVenn Diagrams 1 Students in a college statistics class wanted to find out how common it is for young adults to have their ears pierced They recorded data on two variables gender and whether or not the student had a pierced ear for all 178 people in the class The two way table summarizes the data Gender Pierced Ear Yes No Total Male 19 71 90 c Find P A or B Female 84 4 88 Total 103 75 178 Suppose we choose a student from the class at random Define event A as getting a male student and event B as getting a student with a pierced ear a Find P B Interpret this value in context b Find P male and pierced ear
Statistics
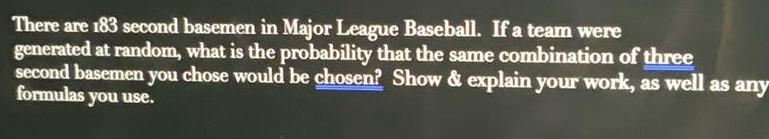
ProbabilityThere are 183 second basemen in Major League Baseball If a team were generated at random what is the probability that the same combination of three second basemen you chose would be chosen Show explain your work as well as any formulas you use
Statistics
ProbabilityBe sure to fully justify your responses when appropriate Round probabilities to 4 decimal points Don t forget Units and use complete sentences when interpreting your result 8 pts A local hospital advertises that the average wait time in their emergency room is 16 minutes but we believe that it is longer than that After randomly collecting wait times from a sample of 35 patients we found that their average wait time was 16 7 minutes with a standard deviation of 5 92 minutes Run a test at the 05 significance level a What type of test are we using Determine if a test is left tailed right tailed or two tailed


Statistics
Statistics36 Cortisol is a hormone that plays an important role in mediating stress There is growing awareness that expo sure of outdoor workers to pollutants may impact cortisol levels The article Plasma Cortisol Concentration and Lifestyle in a Population of Outdoor Workers Ind J of Envir Health Res 2011 62 71 reported on a study involving three groups of police officers 1 traffic police TP 2 drivers D and 3 other duties O Here is summary data on cortisol concentration ng ml for a subset of the officers who neither drank nor smoked Group Sample Size 0 36 50 Mean 174 7 160 2 153 5 61 SD 50 9 37 2 Assuming that the standard assumptions for one way ANOVA are satisfied carry out a test at significance level 05 to decide whether true average cortisol concen tration is different for the three groups Note The inves tigators used more sophisticated statistical methodology multiple regression to assess the impact of age length of employment and drinking and smoking status on cortisol concentration taking these factors into account concentration appeared to be signifiantly higher in the TP group than in the other two groups

Statistics
StatisticsSuppose that the compression strength observations on the fourth type of box in Example 10 1 had been 655 1 748 7 662 4 679 0 706 9 and 640 0 obtained by add ing 120 to each previous x Assuming no change in the remaining observations carry out an F test with a 05

Statistics
Statistics40 Refer to Exercise 38 What is for the test when true average DNA content is identical for three of the diets and falls below this common value by 1 standard devia tion o for the other two diets

Statistics
Statistics5 Exercise 10 7 described an experiment in which 26 resis tivity observations were made on each of six different concrete mixtures The article cited there gave the fol lowing sample means 14 18 17 94 18 00 18 00 25 74 27 67 Apply Tukey s method with a simultaneous confi dence level of 95 to identify significant differences and describe your findings use MSE 13 929

Statistics
StatisticsThe article Origin of Precambrian Iron Formations Econ Geology 1964 1025 1057 reports the follow ing data on total Fe for four types of iron formation 1 carbonate 2 silicate 3 magnetite 4 hematite 1 27 8 20 5 25 2 2 26 3 34 0 29 5 26 2 36 5 33 1 3 28 1 25 3 24 0 17 1 34 0 26 2 26 8 27 5 29 5 34 1 32 9 27 0 20 5 20 2 23 7 294 30 0 30 3 36 3 28 0 31 3 23 7 24 9 27 9 35 6 314 25 5 34 1 Carry out an analysis of variance F test at significance level 01 and summarize the results in an ANOVA table

Statistics
Statistics4 The accompanying summary data on skeletal muscle CS activity nmol min mg appeared in the article Impact of Lifelong Sedentary Behavior on Mitochondrial Function of Mice Skeletal Muscle J of Gerontology 2009 927 939 Sample size Sample mean Sample sd Young 46 68 7 16 Old Sedentary 8 5 59 Old Active 10 8 43 Carry out a test to decide whether true average activity differs for the three groups If appropriate investigate differences amongst the means with a multiple comparisons method

Statistics
StatisticsTest the hypothesis that the mean consumption of sugar on the ten weekdays is less than 120 mg State the hypotheses in symbolic form as taught in the course Use 0 01 level of significance Hint Section 20 4 Include the following HO H1 t or z value p value Conclusion The different steps are worth partial credit Make sure to include the work for them
Statistics
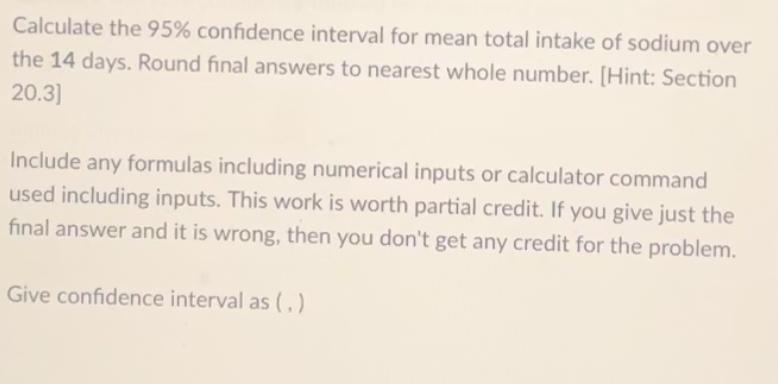
ProbabilityCalculate the 95 confidence interval for mean total intake of sodium over the 14 days Round final answers to nearest whole number Hint Section 20 3 Include any formulas including numerical inputs or calculator command used including inputs This work is worth partial credit If you give just the final answer and it is wrong then you don t get any credit for the problem Give confidence interval as
Statistics
ProbabilityCalculate the sample proportion of weekdays that this person was below the recommended daily 2000 calorie intake Show how you calculated the proportion Round the proportion to two decimal places Edit View Insert Format Tools Table

Statistics
StatisticsHemselves fans of professional baseball You randomly select six women and ask each if she considers herself a fan of professional baseball Complete parts a through c below a Construct a binomial distribution using n 6 and p 0 32 X 0 1 2 3 4 5 6 Round to the nearest thousandth as needed OA b Graph the binomial distribution using a histogram and describe its shape Choose the correct graph below APD P x 0 2 46 OA Skewed right OB Symmetrical OC Skewed left OD None of these Q Q OB AP x Q Q Describe the shape of the histogram Choose the correct answer below CELE OC AP x 04 0 25 Q Q O D 0 0 AP x Q Q c What values of the random variables would you consider unusual Explain your reasoning On average out of 6 women would consider themselves baseball fans with a standard deviation of women The values x 5 and x would be unusual because their probabilities are 0 05

Statistics
StatisticsThe life expectancy in years for a particular brand of microwave oven is a continuous random variable with the probability density function below Find d such that the probability of a randomly selected microwave oven lasting d years or less is 0 8 f x 5 x 5 0 if x 0 otherwise The probability of a randomly selected microwave oven lasting years or less is 0 8

Statistics
Statistics0 OT pay more for environmentally friendly products You randomly select 10 adults Find the probability that the number of adults who would pay more for environmentally friendly products is a exactly two b more than two and c between two and five inclusive a P 2 thousandth as needed Round to the nearest b P x 2 thousandth as needed Round to the nearest c P 2 x 5 Round to the nearest thousandth as needed

Statistics
Statistics38 of adults say cashews are their favorite kind of nut You randomly select 12 adults and ask each to name his or her favorite nut Find the probability that the number who say cashews are their favorite nut is a exactly three b at least four and c at most two If convenient use technology to find the probabilities a P 3 Round to the nearest thousandth as needed b P x24 Round to the nearest thousandth as needed c P x 2 Round to the nearest thousandth as needed

Statistics
Statisticsmath teacher claims that she has developed a review course that increases the scores of students on the math ortion of a college entrance exam Based on data from the administrator of the exam scores are normally distributed with 523 The teacher obtains a random sample of 2200 students puts them through the review class and finds that the mean math score of the 2200 students is 528 with a standard deviation of 115 Complete parts a through d below c Do you think that a mean math score of 528 versus 523 will affect the decision of a school admissions administrator In other words does the increase in the score have any practical significance OA Yes because every increase in score is practically significant OB No because the score became only 0 96 greater OC Yes because the score became more than 0 96 greater O D No because every increase in score is practically significant d Test the hypothesis at the a 0 10 level of significance with n 350 students Assume that the sample mean is still 528 and the sample standard deviation is still 115 Is a sample mean of 528 significantly more than 523 Conduct a hypothesis test using the P value approach Find the test statistic Round to two decimal places as needed Find the P value The P value is Round to three decimal places as needed Is the sample mean statistically significantly higher OA Yes because the P value is greater than 0 10 OB Yes because the P value is less than a 0 10 OC No because the P value is less than 0 10 OD No because the P value is greater than 0 10 What do you conclude about the impact of large samples on the P value OA As n increases the likelihood of not rejecting the null hypothesis increases However large samples tend to overemphasize practically significant differences OB As n increases the likelihood of rejecting the null hypothesis increases However large samples tend to overemphasize practically insignificant differences OC As n increases the likelihood of not rejecting the null hypothesis increases However large samples tend to overemphasize practically insignificant differences O D As n increases the likelihood of rejecting the null hypothesis increases However large samples tend to overemphasize practically significant differences

Statistics
StatisticsA math teacher claims that she has developed a review course that increases the scores of students on the math portion of a college entrance exam Based on data from the administrator of the exam scores are normally distributed with 523 The teacher obtains a random sample of 2200 students puts them through the review class and finds that the mean math score of the 2200 students is 528 with a standard deviation of 115 Complete parts a through d below a State the null and alternative hypotheses Ho b Test the hypothesis at the a 0 10 level of significance Is a mean math score of 528 statistically significantly higher than 523 Conduct a hypothesis test using the P value approach Find the test statistic H to 0 Round to two decimal places as needed Find the P value The P value is Round to three decimal places as needed Is the sample mean statistically significantly higher OA No because the P value is less than a 0 10 OB Yes because the P value is greater than 0 10 OC Yes because the P value is less than 0 10 OD No because the P value is greater than a 0 10 c Do you think that a mean math score of 528 versus 523 will affect the decision of a school admissions administrator In other words does the increase in the score have any practical significance OA Yes because every increase in score is practically significant OB No because the score became only 0 96 greater 00 You because the score became more than 0 96 greater

Statistics
StatisticsFor the above data determine Frequency Distribution Frequency Polygon Cumulative Frequency Polygon Greater than Value Curve Mean Standard Deviation iont of Variation

Statistics
StatisticsThe life expectancy of a male during the course of the past 100 years is approximately 27 741 days Use the table to the right to conduct a test using a 0 05 to determine whether the evidence suggests that chief justices live longer than the general population of males Suggest a reason why the conclusion drawn may be flawed SKILE Chief Life Chief Life Justice Span Days Justice Span Days A 1 B J C K L D E F G H 32 029 32 435 31 702 28 037 32 803 28 341 26 499 32 573 M N O P 30 136 30 205 27 738 32 132 31 667 30 748 32 490 29 969 State the appropriate null and alternative hypotheses OA Ho H 27 741 versus H 27 741 OC Ho H 30 594 versus H 30 594 O E Ho H 27 741 versus H 27 741 Use the P value approach at the a 0 05 level of significance to test the hypotheses P value Round to three decimal places as needed State the conclusion for the test Choose the correct answer below OA Reject the null hypothesis There is sufficient evidence to conclude that the mean life span of males is longer than 27 741 days Thus there is sufficient evidence to indicate that chief justices live longer than the general population of males OB Ho H 30 594 versus H 30 594 OD Ho H 30 594 versus H 30 594 OF Ho H 27 741 versus H 27 741 OB Do not reject the null hypothesis There is not sufficient evidence to conclude that the mean life span of males is longer than 27 741 days Thus there is not sufficient evidence to indicate that chief justices live longer than the general population of males OC Do not reject the null hypothesis There is sufficient evidence to conclude that the mean life span of males is longer than 30 594 days Thus there is sufficient evidence to indicate that chief justices live longer than the general population of males O D Reject the null hypothesis There is not sufficient evidence to conclude that the mean life span of males is longer than 27 741 days Thus there is not sufficient evidence to indicate that chief justices live longer than the general population of males Suggest a reason why the conclusion drawn may be flawed Choose the correct answer below OA The sample size is very large and the data are normally distributed OB The sample is not obtained using simple random sampling or from a randomized experiment OC The sample consists of outliers OD The sampled values are not independent of each other

Statistics
StatisticsA college entrance exam company determined that a score of 22 on the mathematics portion of the exam suggests that a student is ready for college level mathematics To achieve this goal the company recommends that students take a core curriculum of math courses in high school Suppose a random sample of 200 students who completed this core set of courses results in a mean math score of 22 3 on the college entrance exam with a standard deviation of 3 1 Do these results suggest that students who complete the core curriculum are ready for college level mathematics That is are they scoring above 22 on the mathematics portion of the exam Complete parts a through d below a State the appropriate null and alternative hypotheses Fill in the correct answers below The appropriate null and alternative hypotheses are Ho versus H b Verify that the requirements to perform the test using the t distribution are satisfied Check all that apply A The sample data come from a population that is approximately normal B A boxplot of the sample data shows no outliers C The students test scores were independent of one another D The students were randomly sampled E The sample size is larger than 30 F None of the requirements are satisfied c Use the P value approach at the x 0 05 level of significance to test the hypotheses in part a Identify the test statistic to Round to two decimal places as needed Identify the P value P value Round to three decimal places as needed d Write a conclusion based on the results Choose the correct answer below the null hypothesis and claim that there than 22 mean is sufficient evidence to conclude that the population
Statistics
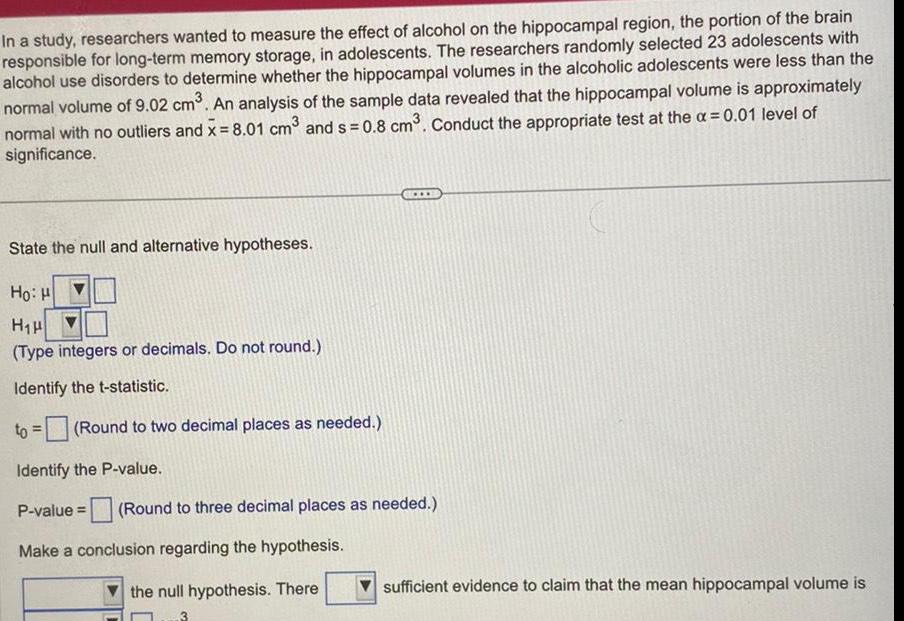
StatisticsIn a study researchers wanted to measure the effect of alcohol on the hippocampal region the portion of the brain responsible for long term memory storage in adolescents The researchers randomly selected 23 adolescents with alcohol use disorders to determine whether the hippocampal volumes in the alcoholic adolescents were less than the normal volume of 9 02 cm An analysis of the sample data revealed that the hippocampal volume is approximately normal with no outliers and x 8 01 cm and s 0 8 cm Conduct the appropriate test at the 0 01 level of significance State the null and alternative hypotheses Hoi H H H Type integers or decimals Do not round Identify the t statistic Round to two decimal places as needed Identify the P value P value Round to three decimal places as needed Make a conclusion regarding the hypothesis the null hypothesis There sufficient evidence to claim that the mean hippocampal volume is