Statistics Questions
The best high school and college tutors are just a click away, 24×7! Pick a subject, ask a question, and get a detailed, handwritten solution personalized for you in minutes. We cover Math, Physics, Chemistry & Biology.

Statistics
StatisticsA book claims that more hockey players are born in January through March than in October through December following data show the number of players selected in a draft of new players for a hockey league according to their birth month Is there evidence to suggest that hockey players birthdates are not uniformly distributed throughout the year Use the level of significance 0 01 Click the icon to view the table Determine the null and alternative hypotheses Choose the correct answer below OA Ho The distribution of hockey players birth months is uniformly distributed H More hockey players are born in the first half of the year than the second half B Ho The distribution of hockey players birth months is not uniformly distributed H The distribution of hockey players birth months is uniformly distributed OC Ho The distribution of hockey players birth months is uniformly distributed H More hockey players are born in January March than October December D Ho The distribution of hockey players birth months is uniformly distributed H The distribution of hockey players birth months is not uniformly distributed Compute the expected counts for each birth month The total number of hockey players is 194 Round to two decimal places as needed Birth Month Observed Count Expected Count January March April June July September December 66 57 35 36
Statistics
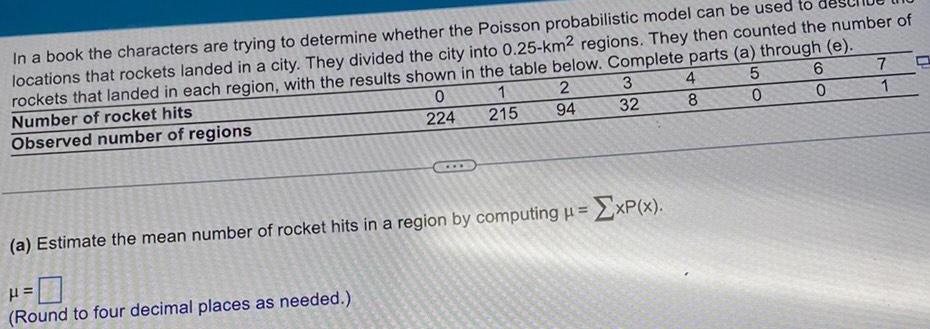
StatisticsIn a book the characters are trying to determine whether the Poisson probabilistic model can be used to locations that rockets landed in a city They divided the city into 0 25 km2 regions They then counted the number of rockets that landed in each region with the results shown in the table below Complete parts a through e Number of rocket hits 5 0 1 224 Observed number of regions 0 215 2 94 H Round to four decimal places as needed 3 32 a Estimate the mean number of rocket hits in a region by computing XP x 4 8 6 0 7 1
Statistics
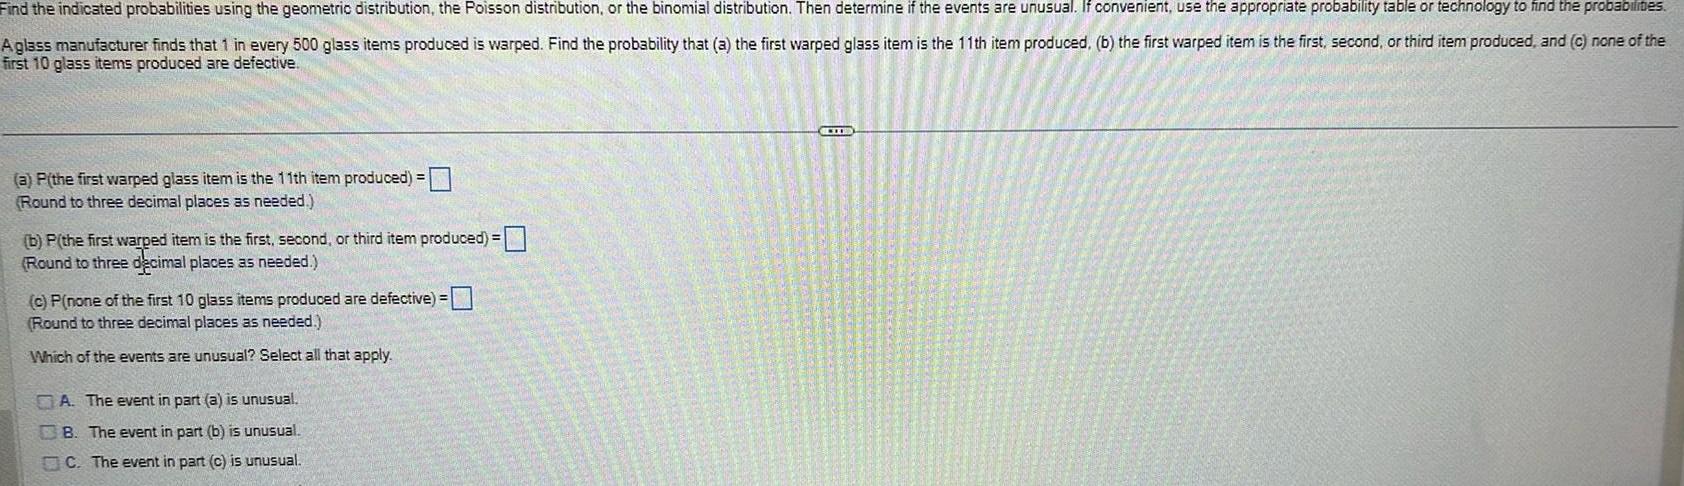
ProbabilityFind the indicated probabilities using the geometric distribution the Poisson distribution or the binomial distribution Then determine if the events are unusual If convenient use the appropriate probability table or technology to find the probabilites Aglass manufacturer finds that 1 in every 500 glass items produced is warped Find the probability that a the first warped glass item is the 11th item produced b the first warped item is the first second or third item produced and c none of the first 10 glass items produced are defective a P the first warped glass item is the 11th item produced Round to three decimal places as needed b P the first warped item is the first second or third item produced Round to three decimal places as needed c P none of the first 10 glass items produced are defective Round to three decimal places as needed Which of the events are unusual Select all that apply A The event in part a is unusual B The event in part b is unusual C The event in part c is unusual LID

Statistics
StatisticsK A mar 24 blue 20 orange and 16 green A student randomly selected a bag of colored candies He counted the number of candies of each color and obtained the results shown in the table Test whether the bag of colored candi follows the distribution stated above at the a 0 05 level of significance Click the icon to view the table Determine the null and alternative hypotheses Choose the correct answer below OA Ho The distribution of colors is the same as stated by the manufacturer H The distribution of colors is not the same as stated by the manufacturer OB Ho The distribution of colors is not the same as stated by the manufacturer H The distribution of colors is the same as stated by the manufacturer OC None of these Observed Distribution of Colors Color Frequency Claimed Proportion Colored Candies in a bag Brown Yellow Red 62 66 55 0 13 0 14 0 13 Blue 62 0 24 Orange Green 82 66 0 20 0 16 I X

Statistics
StatisticsThe first significant digit in any number must be 1 2 3 4 5 6 7 8 or 9 It was discovered that first digits do not occur with equal frequency Probabilities of occurrence to the first digit in a number are shown in the accompanying table The probability distribution is now known as Benford s Law For example the following distribution represents the first digits in 218 allegedly fraudulent checks written to a bogus company by an employee attempting to embezzle funds from his employer Complete parts a through c below Click the icon to view the tables a Because these data are meant to prove that someone is guilty of fraud what would be an appropriate level of significance when performing a goodness of fit test Use 0 05 0 10
Statistics
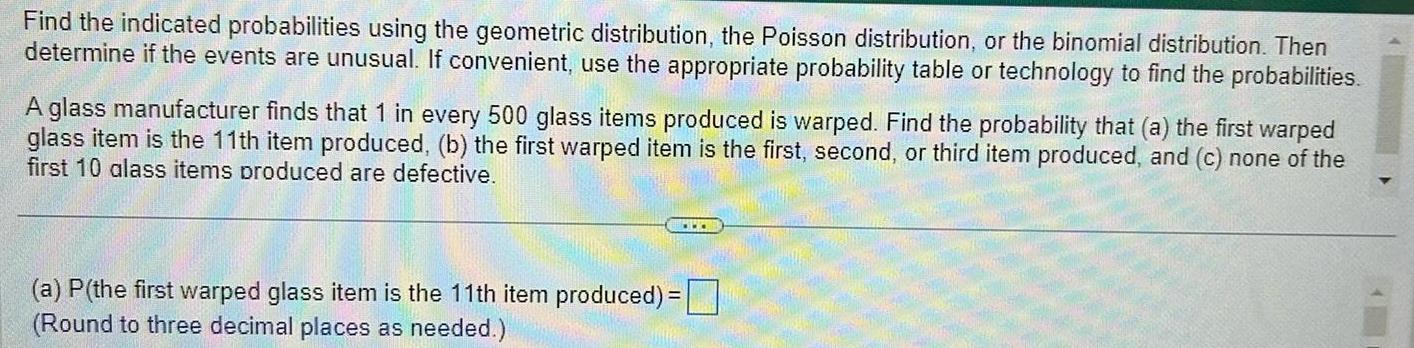
StatisticsFind the indicated probabilities using the geometric distribution the Poisson distribution or the binomial distribution Then determine if the events are unusual If convenient use the appropriate probability table or technology to find the probabilities A glass manufacturer finds that 1 in every 500 glass items produced is warped Find the probability that a the first warped glass item is the 11th item produced b the first warped item is the first second or third item produced and c none of the first 10 alass items produced are defective a P the first warped glass item is the 11th item produced Round to three decimal places as needed 41

Statistics
StatisticsRound to the nearest hundredth when necessary If a rectangular prism with a length of 12 feet and a width of 9 feet has a surface area of 930 square feet find its height 16 A cone with a height of 15 yards has a volume of 475 17 yd Find the diameter of the cone
Statistics
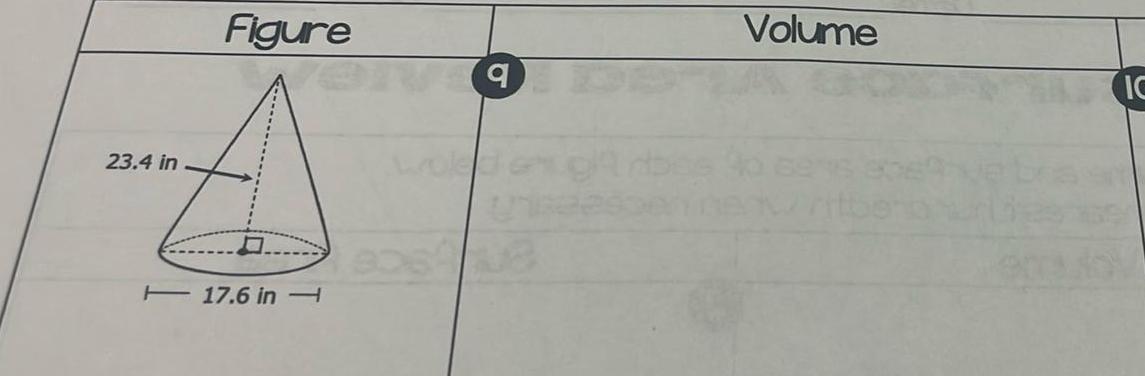
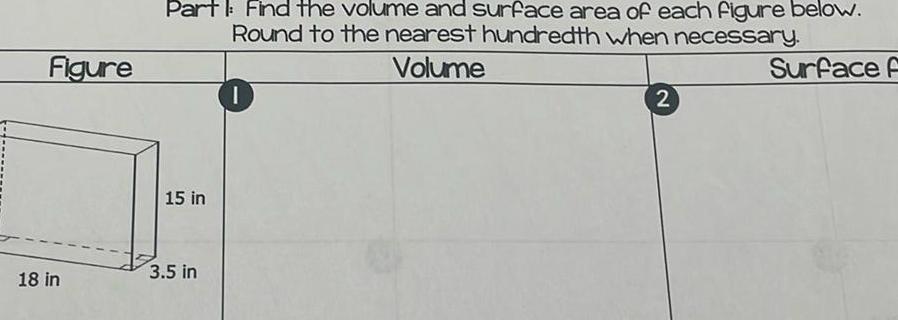
ProbabilityFigure 18 in Part Find the volume and surface area of each figure below Round to the nearest hundredth when necessary Volume Surface F 15 in 3 5 in 2

Statistics
StatisticsAssume the geometric distribution applies Use the given probability of success p to find the indicated probability Find P 4 when p 0 90 P 4 Round to five decimal places as needed

Statistics
Statisticsdomly select six workers and ask each if they know what their CEO looks like Complete parts a through d below a Find the mean of the binomial distribution H F Round to the nearest tenth as needed b Find the variance of the binomial distribution o Round to the nearest tenth as needed c Find the standard deviation of the binomial distribution Round to the nearest tenth as needed d Interpret the results in the context of the real life situation On average out of 6 workers know what their CEO looks like The standard deviation is the average number by no more than Type integers or decimals rounded to the nearest tenth as needed so in most samples of six workers the number of workers who know what their CEO looks like would differ from

Statistics
Statistics37 of women consider themselves fans of professional baseball You randomly select six women and ask each if she considers herself a fan of professional baseball Complete parts a through d below a Find the mean of the binomial distribution ILL P Round to the nearest tenth as needed b Find the variance of the binomial distribution 2 Round to the nearest tenth as needed c Find the standard deviation of the binomial distribution Round to the nearest tenth as needed d Interpret the results in the context of the real life situation On average out of 6 women would consider themselves baseball fans The standard deviation is would differ from the mean by no more than Type integers or decimals rounded to the nearest tenth as needed women so in most samples of 6 women the number of women who consider themselves baseball fans

Statistics
StatisticsAssignment 6 5 points A small commuter airline uses a plane with the capacity to carry at most p passengers on a hopping flight The hopping flight visits the cities 1 2 n in ascending order The plane can pick up passengers at any node and drop them off at any other node Let bij denote the number of passengers available at node i who want to go to node j and let fi denote the fare per passenger from node i to node j The airline would like to determine the number of passengers that the plane should carry between the various origins and destinations in order to maximize the total fare per trip while never exceeding the plane capacity Model this problem as a minimum cost flow
Statistics
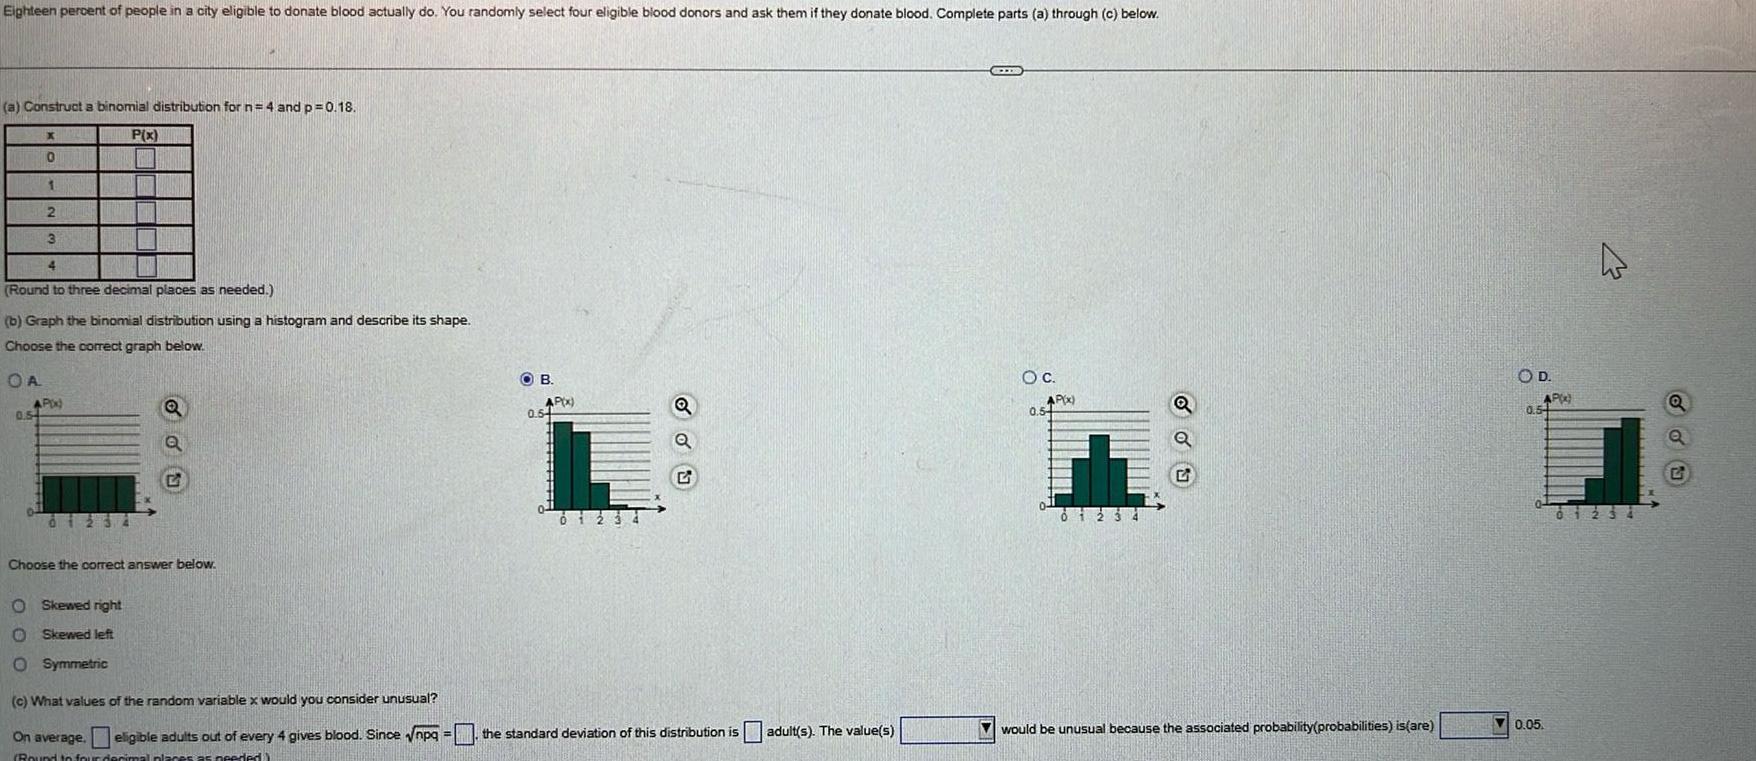
ProbabilityEighteen percent of people in a city eligible to donate blood actually do You randomly select four eligible blood donors and ask them if they donate blood Complete parts a through c below a Construct a binomial distribution for n 4 and p 0 18 P x X 0 1 2 3 4 Round to three decimal places as needed b Graph the binomial distribution using a histogram and describe its shape Choose the correct graph below OA AP x 0 54 i Q O Skewed right Skewed left O Symmetric 2 Choose the correct answer below OB AP x 0 54 du c What values of the random variable x would you consider unusual On average eligible adults out of every 4 gives blood Since npq the standard deviation of this distribution is adult s The value s Round to four decimal pla es as needed CITE O C AP x 0 54 Th 0123 Q would be unusual because the associated probability probabilities is are OD AP 0 5 0 05 4 01234 Q ddu

Statistics
StatisticsThe area to the right of z 1 54 P z 1 54 under a standard normal distribution is closest to 0 938

Statistics
StatisticsThe heights in inches and weights in lbs of 10 American men are given below Height N8632ERESA 72 74 70 71 69 73 Weight 185 140 200 170 220 195 195 200 205 190 Find the regression equation a b Calculate the correlation coefficient accurate to three decimal places c Test the significance of the correlation coefficient with a 0 05 level of significance Include definition of hypotheses test statistic p value or critical value decision about Ho and conclusion d What is the best estimate for the weight of a man whose height is 70 5

Statistics
StatisticsA local group claims that the police issue more than 60 speeding tickets a day in their area To prove their point they randomly select two weeks and count the number of tickets issued each day Their research yields the data are shown below 70 48 61 68 69 55 70 57 60 83 52 60 72 58 Use this sample data to test the group s claim at a significance level of a 0 02

Statistics
StatisticsA recent study claimed that at least 15 of junior high students are overweight Te test this claim a random sample of 160 students is surveyed and 18 of the subjects were found to be overweight Use this sample data to test the study s claim at 0 05 significance of 05

Statistics
StatisticsThe test statistic in a right tailed test is z 0 52 Use this information to find the p value 0 1915 O 0 3015 0 1950 0 5530

Statistics
StatisticsA travel association claims that the mean daily meal cost for two adults traveigling together on vacation in San francisco is 105 A random sample of 20 such couples has a mean daily meal cost of 110 and a standard deviation of 8 50 At the 05 significance level is there enough evidence to reject the claim Since p 0 0165 there is evidence that the association s claim is true No answer text provided There is not significant evidence to refute the athletic association s claim because 2 63 is not in the rejection region There is significant evidence that the claim is false because p 0165

Statistics
StatisticsA tire manufacturer claims that the lifetime of its tires are normally distributed with a mean of m 34 000 miles and a standard deviation of a 1200 miles A trucking firm using these tires suspects that the mean lifetime is less than 34 000 miles To test the claim the firm randomly selects and tests 54 of these tires and gets a mean lifetime of 33 390 mi Use a significance level of a 0 05 to test the trucking firm s claim

Statistics
StatisticsFind the right critical value for 99 confidence interval for a with n 8 O 18 475 20 278 O 1 239

Statistics
StatisticsGiven the linear correlation coefficient r and the sample size n determine the critical values of r and use your finding to state whether or not the given r represents a significant linear correlation Use a significance level of 0 05 r 0 539 n 25 Critical values r 0 487 significant linear correlation Critical values r 0 396 significant linear correlation Critical values r 0 487 no significant linear correlation O Critical values r 0 396 no significant linear correlation
Statistics
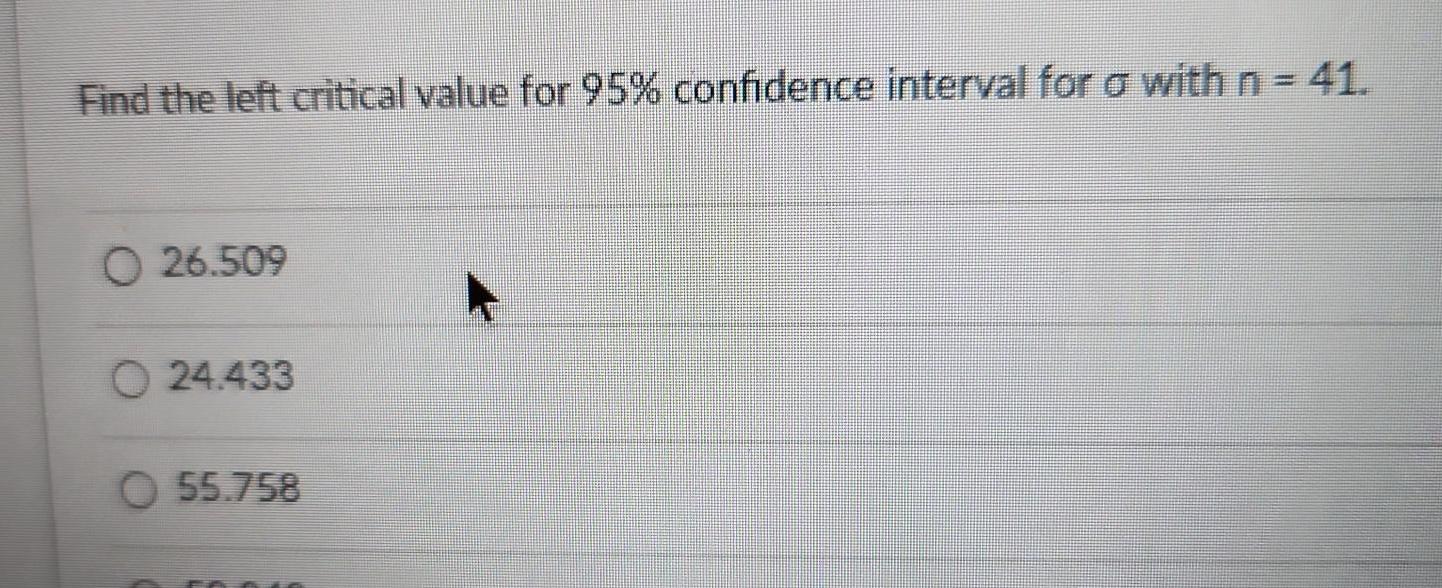
StatisticsFind the left critical value for 95 confidence interval for a with n 41 26 509 O24 433 O55 758

Statistics
StatisticsTo find the standard deviation of the diameter of wooden dowels the manufacturer measures 19 randomly selected dowels and finds the standard deviation of the sample to be s 0 16 Use this data to find the 95 confidence interval for the population standard deviation o Assume that the population is normally distributed 0 12 o 0 24 0 13 0 22 00 15 o 0 21 0 11 0 25

Statistics
StatisticsThe average price of a home in a town was 178 000 in 2013 but home prices are rising by 5 per year a Find an exponential function of the form Q Qox 1 r where r 0 for growth to model the situation described Q x 1 Type an integer or a decimal b Fill the table showing the value of the average price of a home for the following five years Year t 0 1 23 4 Average price 178 000 S 5 Do not round until the final answer Then round to the nearest dollar as needed

Statistics
StatisticsA researcher at a major hospital wishes to estimate the proportion of the adult population of the United States that has high blood pressure How large a sample is needed in order to be 95 confident that the sample proportion will not differ from the true proportion by more than 4 423 1201 13 601
Statistics
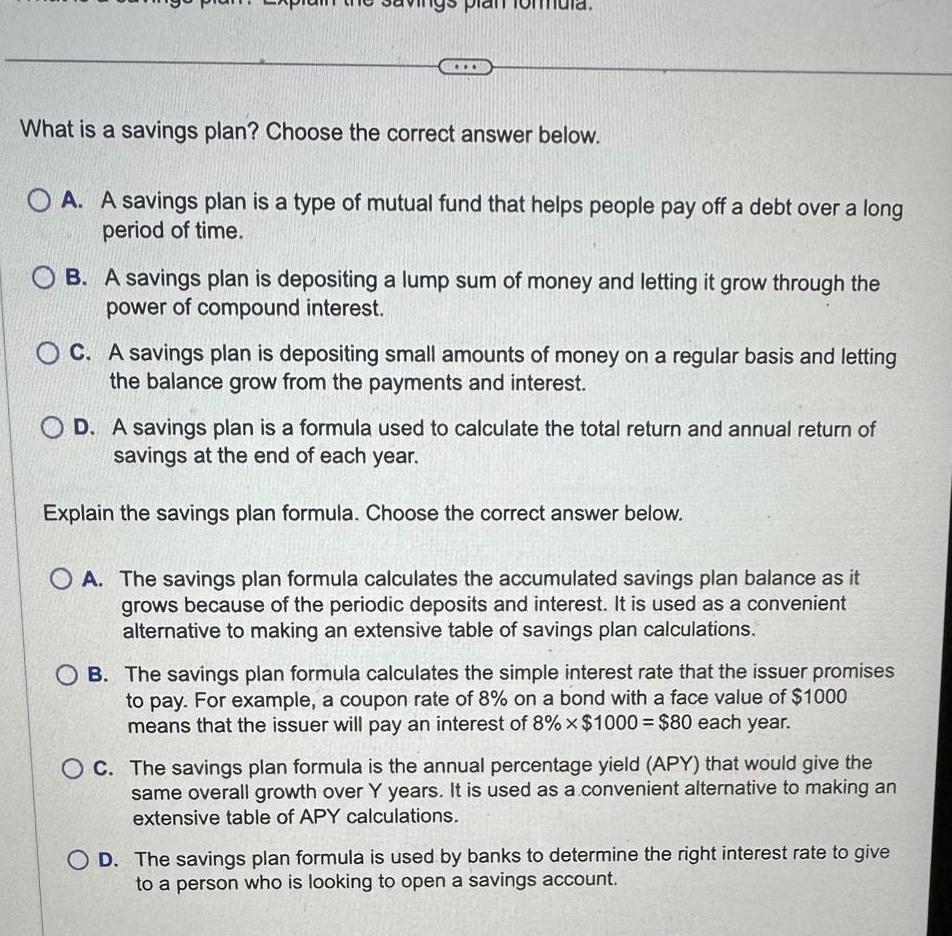
ProbabilityWhat is a savings plan Choose the correct answer below A A savings plan is a type of mutual fund that helps people pay off a debt over a long period of time B A savings plan is depositing a lump sum of money and letting it grow through the power of compound interest C A savings plan is depositing small amounts of money on a regular basis and letting the balance grow from the payments and interest OD A savings plan is a formula used to calculate the total return and annual return of savings at the end of each year Explain the savings plan formula Choose the correct answer below O A The savings plan formula calculates the accumulated savings plan balance as it grows because of the periodic deposits and interest It is used as a convenient alternative to making an extensive table of savings plan calculations OB The savings plan formula calculates the simple interest rate that the issuer promises to pay For example a coupon rate of 8 on a bond with a face value of 1000 means that the issuer will pay an interest of 8 x 1000 80 each year OC The savings plan formula is the annual percentage yield APY that would give the same overall growth over Y years It is used as a convenient alternative to making an extensive table of APY calculations OD The savings plan formula is used by banks to determine the right interest rate to give to a person who is looking to open a savings account

Statistics
StatisticsIn order to efficiently bid on a contract a contractor wants to be 95 confident that his error is less than two hours in estimating the average time it takes to install tile flooring Previous contracts indicate that the standard deviation is 4 5 hours How large a sample must be selected 20

Statistics
StatisticsDescribe the basic differences between linear growth and exponential growth Choose the correct answer below OA Linear growth occurs when a quantity grows by random amounts in each unit of time and exponential growth occurs when a quantity grows by different but proportional amounts in each unit of time O B Linear growth occurs when a quantity grows by the same absolute amount n each unit of time and exponential growth occurs when a quantity grows by the same relative amount that is by the same percentage in each unit of time OC Linear growth occurs when a quantity grows by the same relative amount that is by the same percentage in each unit of time and exponential growth occurs when a quantity grows by the same absolute amount in each unit of time OD Linear growth occurs when a quantity grows by different but proportional amounts in each unit of time and exponential growth occurs when a quantity grows by random amounts in each unit of time

Statistics
StatisticsWhat is the at least once rule Explain how the at least once rule can be used to find the correct probabilities in the games of the Chevalier de Mere What is the at least once rule OA P at least one event A in n trials 1 P A n trials B P at least one event A in n trials 1 P A 1 trials OC P at least one event A in n trials 1 P A in n trials OD P at least one event A in n trials 1 P no A in n trials Explain how the at least once rule can be used to find the correct probabilities in the games of the Chevalier de Mere OA Each roll is a dependent event and the probability of an event occurring or not each roll is simpler to calculate than the probability that it will occur a specific number of times OB Each roll is an independent event and the probability of an event occurring or not each roll is simpler to calculate than the probability that it will occur a specific number of times OC Each roll is a dependent event and the at least once rule calculates the probability of a single event D Each roll is an independent event and the at least once rule calculates the probability of a single event

Statistics
StatisticsWhen they send out their fundraising letter a philanthropic organization typically gets a return from about 5 of the people on their mailing list To see what the response rate might be in the future they did a simulation using samples of size 20 50 100 and 200 For each sample size they simulated 1000 mailings with success rate p 0 05 and constructed the histogram of the 1000 sample proportions as shown in the accopmanying table Explain how these histograms demonstrate what the Central Limit Theorem says about the sampling distribution model for sample proportions Be sure to talk about center shape and spread Click the icon to view the histograms As the sample size increases the center of the histogram These simulations the shape of the distribution to demonstrate what the Central Limit Theorem says about the sampling distribution model for sample proportions and the variability in the sample proportions
Statistics
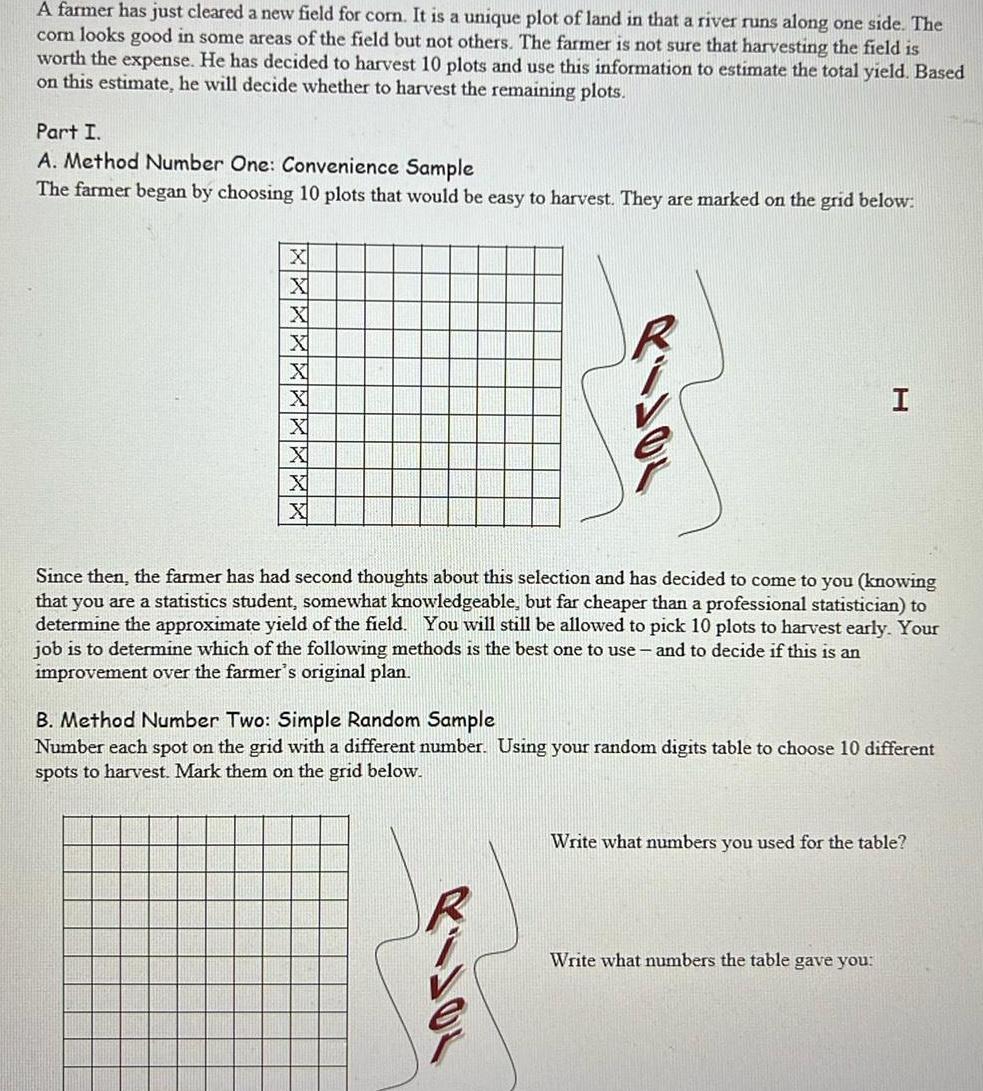
ProbabilityA farmer has just cleared a new field for corn It is a unique plot of land in that a river runs along one side The com looks good in some areas of the field but not others The farmer is not sure that harvesting the field is worth the expense He has decided to harvest 10 plots and use this information to estimate the total yield Based on this estimate he will decide whether to harvest the remaining plots Part I A Method Number One Convenience Sample The farmer began by choosing 10 plots that would be easy to harvest They are marked on the grid below X X X X X X X I Since then the farmer has had second thoughts about this selection and has decided to come to you knowing that you are a statistics student somewhat knowledgeable but far cheaper than a professional statistician to determine the approximate yield of the field You will still be allowed to pick 10 plots to harvest early Your job is to determine which of the following methods is the best one to use and to decide if this is an improvement over the farmer s original plan B Method Number Two Simple Random Sample Number each spot on the grid with a different number Using your random digits table to choose 10 different spots to harvest Mark them on the grid below Write what numbers you used for the table Write what numbers the table gave you

Statistics
StatisticsBefore lending someone money banks must decide whether they believe the applicant will repay the loan One strategy used is a point system Loan officers assess information about the applicant totaling points they award for the person s income level credit history current debt burden and so on The higher the point total the more convinced the bank is that it s safe to make the loan Any applicant with a lower point total than a certain cutoff score is denied a loan Think of this decision as a hypothesis test Since the bank makes its profit from the interest collected on repaid loans their null hypothesis is that the applicant will repay the loan and therefore should get the money Only if the person s score falls below the minimum cutoff will the bank reject the null and deny the loan Complete parts a through c below C a In this context what is meant by the power of the test OA The power is the probability that the bank approves a loan that will be repaid OB The power is the probability that the bank denies a loan that would have been repaid OC The power is the probability that the bank approves a loan that will not be repaid OD The power is the probability that the bank denies a loan that would not have been repaid b What could the bank do to increase the power OA The bank could raise the cutoff score OB The bank could lower the cutoff score OC The bank could scrap the point system OD The bank could hire additional loan officers to assess each applicant s information c What is the disadvantage of taking the action in part b OA A larger number of trustworthy people would be denied credit and the bank would miss the opportunity to collect interest on those loans OB The bank would have to spend more money on the additional loan officers OC The bank would have to spend additional time and money developing a new system OD A larger number of untrustworthy people would have their loans approved and the bank would lose money from those unpaid loans Next

Statistics
StatisticsThe time required to assemble a single Play Station 5 is approximately normally distributed with 15 57 minutes and o 2 minutes A random sample of 20 Play Station 5 assembly times is selected Find the minimum assembly time of the upper 10 of average assembly times Round to at least 2 decimal places if needed

Statistics
StatisticsHousing prices in the U S in 2021 had the largest jump in 30 years Recently in one large community real estate agents randomly sampled 31 bids from potential buyers to estimate the average gain in home value The sample showed the average gain was 9480 with a standard deviation of 1038 Complete parts a through c a What assumptions and conditions must be checked before finding a confidence interval How would one check them OA The data are assumed to be independent and from a Normal population Check the independence assumption with the Randomization Condition Check the Normal population assumption with the Nearly Normal Condition using a histogram OB The data are assumed to be independent and to have a sample size that is large enough to have a sampling distribution that is approximately Normal Check the independence assumption with the Randomization Condition Check the sample size assumption by ensuring that there are at least 10 successes and 10 failures OC The data are assumed to be dependent and to have a sample size that is large enough to have a sampling distribution that is approximately Normal Check the independence assumption by ensuring that there are at least 10 successes and 10 failures O D The data are assumed to be independent and from a Normal population Check the independence assumption with the Nearly Normal Condition using a histogram Check the Normal population assumption with the Randomization Condition b Find a 90 confidence interval for the mean gain in value per home Round to the nearest dollar as needed c Interpret this interval and explain what 90 confidence means in context Choose the correct answer below OA It can be said with 90 confidence that the gain in value for a randomly selected home in this community is within this interval OB It can be said with 90 confidence that the mean gain in value per home in this community is within this interval OC This interval contains the true m an gain in value per home in this community 95 of the time O D 90 of homes in this community have a gain in value within this interval

Statistics
StatisticsB Method Number Two Simple Random Sample Number each spot on the grid with a different number Using your random digits table to choose 10 different spots to harvest Mark them on the grid below R Write what numbers you used for the table Write what numbers the table gave you

Statistics
StatisticsC Method Number Three Stratified Sample Consider the field as grouped in vertical columns called trata Label each column with a different number Using your random digit table randomly choose one plot from each vertical column and mark these plots on the grid R Write what numbers you used for the table Write what number the table gave you

Statistics
Statistics12 pts I work for a pharmaceutical company and I want to show that our new pill lowers cholesterol I know that by not taking a pill there is a 0 milligram per deciliter mg dl drop in blood cholesterol with a standard deviation of o 13 mg dl Assume that cholesterol is normally distributed In a random sample of 80 men taking the new cholesterol drug I find a drop in the blood cholesterol of 3 mg dl x 3 I need to find out if this is a statistically significant drop Test at the 0 05 significance level a What type of test are we using We are using a one sample test as this is appropriate for when we have a sample and want to compare the sample mean to a known population mean This is a left tailed test since we re interested in whether the new pill lowers cholesterol b Do we meet the assumptions for normality for this type of test justify your response Since the sample size is 80 and therefore greater than 30 we can reasonably assume normality is present c Write the hypotheses for this test in words Ho The new pill will have no effect on cholesterol Ha The new pill will result in a decrease in cholesterol d Write the hypotheses for this test symbolically Ho 0 Ha 0 e Find the sample statistic test statistic and p value Sketch a distribution that shows your p value either with your sample statistic or your test statistic if you prefer

Statistics
StatisticsUnits and use complete sentences when interpreting your result 8 pts A local hospital advertises that the average wait time in their emergency room is 16 minutes but we believe that it is longer than that After randomly collecting wait times from a sample of 35 patients we found that their average wait time was 16 7 minutes with a standard deviation of 5 92 minutes Run a test at the 05 significance level a What type of test are we using We are using a one sample test as this is appropriate for when we have a sample and want to compare the sample mean to a known population mean Since we re interested in whether the average wait time is significantly less than or greater than 16 minutes this is a two tailed test b Do we meet the assumptions for normality for this type of test justify your response Our sample size of 35 patients is greater than 30 With the central limit theorer suggesting that the distribution of the sample mean tends to approach normality as the sample size increases it is reasonable to assume normality is present C Write the hypotheses for this test symbolically Ho H 16 minutes Ha 16 minutes d Find the sample statistic test statistic and p value You may need to use an online calculator to find your p value https www socscistatistics com pvalues tdistribution aspx or if you have use the TI 84 hypothesis test feature that is also allowed sample statistic 16 7 minutes test statistic Z 0 099936408 p value 0 2421 e What is our conclusion Justify your response There is insufficient evidence to support the claim that the average waiting time in the emergency room is greater than 16 minutes f Interpret this result in context in a complete sentence

Statistics
Statistics12 pts I work for a pharmaceutical company and I want to show that our new pill lowers cholesterol I know that by not taking a pill there is a 0 milligram per deciliter mg dl drop in blood cholesterol with a standard deviation of o 13 mg dl Assume that cholesterol is normally distributed In a random sample of 80 men taking the new cholesterol drug I find a drop in the blood cholesterol of 3 mg dl x 3 I need to find out if this is a statistically significant drop Test at the 0 05 significance level a What type of test are we using We are using a one sample test as this is appropriate for when we have a sample and want to compare the sample mean a known population mean This is a left tailed test since we re interested in whether the new pill lowers cholesterol b Do we meet the assumptions for normality for this type of test justify your response Since the sample size is 80 and therefore greater than 30 we can reasonably assume normality is present C Write the hypotheses for this test in words

Statistics
Statisticsseptem 7 only Taming behind the cost of living A survey of 50 random working class households in early February 2008 found that 32 of them now felt their incomes were falling behind Do these data provide sufficient evidence at the 0 01 level of significance to conclude that the proportion of working class households who say their incomes are falling behind the cost of living is higher in February 2008 than it was in September 2007 a What type of test are we using Since we have a single sample working class households and are comparing the proportions for the same at two different times this is a paired sample test Since we re interested in whether the proportion in February 2008 is higher than in September 2007 this is a right tailed test b Do we meet the assumptions for normality for this type of test justify your response Since the sample size is 50 and therefore greater than 30 we can reasonably assume normality is present c Write the hypotheses for this test symbolically H 48 Ha 48 d Find the sample statistic test statistic and p value Sketch a distribution that shows your p value either with your sample statistic or your test statistic sample statistic 0 64 test statistic 2 26455408 p value 0 01177 I P value area e What is our conclusion Justify your response 2 26455408 O

Statistics
StatisticsThe distribution of scores on a test for a particular class is skewed to the left The professor wants to predict the maximum score and understand the distribution of the sample maximum She simulates the distribution of the maximum of the test for 36 different tests with n 5 The histogram to the right shows a simulated sampling distribution of the sample maximum from these tests Complete parts a and b below a Would a Normal model be a useful model for this sampling distribution Explain OA Yes The sampling distribution of the maximum is skewed to the left so a Normal model would be useful for this sampling distribution O B Yes The sampling distribution of the maximum is symmetric and unimodal so a Normal model would be useful for this sampling distribution OC No The sampling distribution of the maximum is symmetric and unimodal so a Normal model would not be useful for this sampling distribution O D No The sampling distribution of the maximum is skewed to the left so a Normal model would not be useful for this sampling distribution b The mean of this distribution is 46 3 and the SD is 3 5 Would you expect about 95 of the samples to have their maximums within 7 of 46 3 Why or why not OA Yes The values show too little variation to apply the 68 95 99 7 Rule OB Yes The 68 95 99 7 Rule is based on the Normal distribution OC No The 68 95 99 7 Rule is based on the Normal distribution OD No The values show too much variation to apply the 68 95 99 7 Rule Frequency 20 10 35 40 45 50 Max Score G G

Statistics
StatisticsA very large study showed that aspirin reduced the rate of first heart attacks by 50 A pharmaceutical company thinks it has a drug that will be more effective than aspirin and plans to do a randomized clinical trial to test the new drug Complete parts a through d below a What is the null hypothesis the company will use OA The new drug is more effective than aspirin OB The new drug is less effective than aspirin OC The new drug is as effective as aspirin OD The new drug is not more effective than aspirin b What is their alternative hypothesis OA The new drug is less effective than aspirin OB The new drug is not more effective than aspirin OC The new drug is more effective than aspirin D The new drug is as effective as aspirin c The company conducted the study and found that the group using the new drug had somewhat fewer heart attacks than those in the aspirin group The P value from the hypothesis test was 0 29 What do you conclude OA There is evidence to conclude that the alternative hypothesis is true because the P value was so small OB There is not sufficient evidence to conclude that the alternative hypothesis is true because the P value was so small OC There is not sufficient evidence to conclude that the alternative hypothesis is true because the P value was so large OD There is evidence to conclude that the alternative hypothesis is true because the P value was so large

Statistics
StatisticsIn each of the following situations is the alternative hypothesis one sided or two sided What are the hypotheses a A business student conducts a taste test to see whether students prefer Diet Coke or Diet Pepsi b PepsiCo recently reformulated their Diet Pepsi in an attempt to appeal to teenagers They run a taste test to see if the new formula appeals to more teenagers than the standard formula c A budget override in a small town requires a two thirds majority to pass A local newspaper conducts a poll to see if there s evidence it will pass d One financial theory states that the stock market will go up or down with equal probability A student collects data over several years to test the theory c is the part c alternative hypothesis one sided or two sided OTwo sided O One sided State the null and alternative hypotheses for the poll on the budget override Let p be the proportion of people who intend to vote for the override Fill in the correct symbols below Ho P HA P 2 3 d Is the part d alternative hypothesis one sided or two sided State the null and alternative hypotheses for the theory of fluctuations in the stock market Let p be the proportion of days that the market goes up Fill in the correct symbols below Ho P HA P OTwo sided O One sided 0 5 0 5

Statistics
StatisticsThe environmental group Oceana analyzed 1215 samples of seafood purchased across the United States and genetically compared the pieces to standard gene fragments that can identify the species 32 5 were mislabeled a Construct a 95 confidence interval for the proportion of all seafood sold in the country that is mislabeled or misidentified b Explain what your confidence interval says about seafood sold in the country c A government spokesperson claimed that the sample size was too small relative to the billions of pieces of seafood sold each year to generalize Is this criticism valid a What is the 95 confidence interval The 95 confidence interval is from to Round to one decimal place as needed b What does the confidence interval say about seafood sold in the country C OA In 95 of samples of seafood sold in the country the proportion that is mislabeled will be in the interval OB We are 95 confidence that the interval captures the sample population of seafood sold in the country that is mislabeled OC There is a 95 chance that the true proportion of mislabeled seafood is in the interval OD We are 95 confident that the interval captures the true proportion of all seafood sold in the country that is mislabeled c Is the government spokesperson s criticism valid OA No as long as the necessary assumptions and conditions were met the results can be generalized OB Yes until another study produces a similar interval the results cannot be generalized OC Yes the sample size must be at least 10 of the population or the results cannot be generalized O D No as long as the sample size is large enough the results can be generalized

Statistics
StatisticsIn each of the following situations is the alternative hypothesis one sided or two sided What are the hypotheses a A business student conducts a taste test to see whether students prefer Diet Coke or Diet Pepsi b PepsiCo recently reformulated their Diet Pepsi in an attempt to appeal to teenagers They run a taste test to see if the new formula appeals to more teenagers than the standard formula c A budget override in a small town requires a two thirds majority to pass A local newspaper conducts a poll to see if there s evidence it will pass d One financial theory states that the stock market will go up or down with equal probability A student collects data over several years to test the theory a Is the part a alternative hypothesis one sided or two sided Two sided OOne sided State the null and alternative hypotheses for the preference between Diet Coke and Diet Pepsi Let p be the proportion of students who prefer Diet Pepsi Fill in the correct symbols below Ho P HA P b is the part b alternative hypothesis one sided or two sided 0 5 0 5 Two sided One sided O State the null and alternative hypotheses for the approval of the new formula Let p be the proportion of teenagers who prefer the new formulation Fill in the correct symbols below Ho P HA P c Is the part c alternative hypothesis one sided or two sided 0 5 0 5

Statistics
StatisticsK During an economic crisis the average value of homes in a community of 36 homes lost 9462 with a standard deviation of 1400 The average home value in the region lost 9010 Was this community of 36 homes unusual Use a t test to decide if the average loss observed was significantly different from the region value Use a level of significance a 0 05 Identify the hypotheses for the test Ho 1 HAH The test statistic is Round to two decimal places as needed C The P value is Round to three decimal places as needed What is the conclusion of the test Was the average loss observed significantly different from the region value

Statistics
StatisticsThe accompanying data provide the number of emails received by a university teacher in a large Introductory Statistics class during an entire term The teacher then counted for each student who had sent at least one email how many emails each had sent The histogram displays these data Complete parts a through c below Click here to view the data Click here to view the histogram a From the histogram would you expect the mean to be larger than the median Explain OA No because the distribution of the histogram is skewed to the left OB Yes because the distribution of the histogram is skewed to the left O C No because the distribution of the histogram is skewed to the right O D Yes because the distribution of the histogram is skewed to the right b Describe this distribution shape center spread unusual features The distribution is skewed to the has a mode near and has a fairly c Which summary statistics would you choose to summarize the center and spread in these data Why It would be best to choose the and spread Most d because the spread of the data has a high degree of Number of Emails from Students Data Student Student1 Student2 Student3 Student4 Student5 Student6 Student7 Student8 Student9 Student10 Student11 Student12 Student13 Student14 Student15 Student16 Student17 Student18 of Emails 1 2 1 4 1 5 2 1 1 1 2 3 223412

Statistics
StatisticsYoung people can be strongly influenced by advertising In an attempt to understand the impact of cigarette companies marketing on junior high school students the non profit organization Monitoring the Future www monitoringthefuture org surveyed the brand preference of 2048 eighth graders who said they smoked cigarettes The table to the right shows brand preferences for the 2 regions of the country Write a few sentences describing the similarities and differences in brand preferences among eighth graders in the 2 Other over 20 brands regions listed No Usual Brand Camel Brand Preference Marlboro Newport OC In both the South and West about 58 of the eighth grade smokers preferred Marlboro Newport was the next most popular brand but was far more popular in the South than in the West South 58 4 22 5 3 3 9 1 6 7 West 58 0 10 1 9 5 9 5 12 9 Choose the best answer below OA In the South Newport was the second most popular brand whereas in the West Camel was O B In both the South and West about 58 of the eighth grade smokers preferred Newport the second most popular brand Nearly twice as many smokers in the West as in the South indicated that they had no usual brand Nearly half as many smokers in the West as in the South indicated that they had no usual brand O D Marlboro was the most popular brand among eighth grade smokers in both the South and West In the South Newport was the second most popular brand whereas in the West Camel was the second most popular brand