Statistics Questions
The best high school and college tutors are just a click away, 24×7! Pick a subject, ask a question, and get a detailed, handwritten solution personalized for you in minutes. We cover Math, Physics, Chemistry & Biology.
Statistics
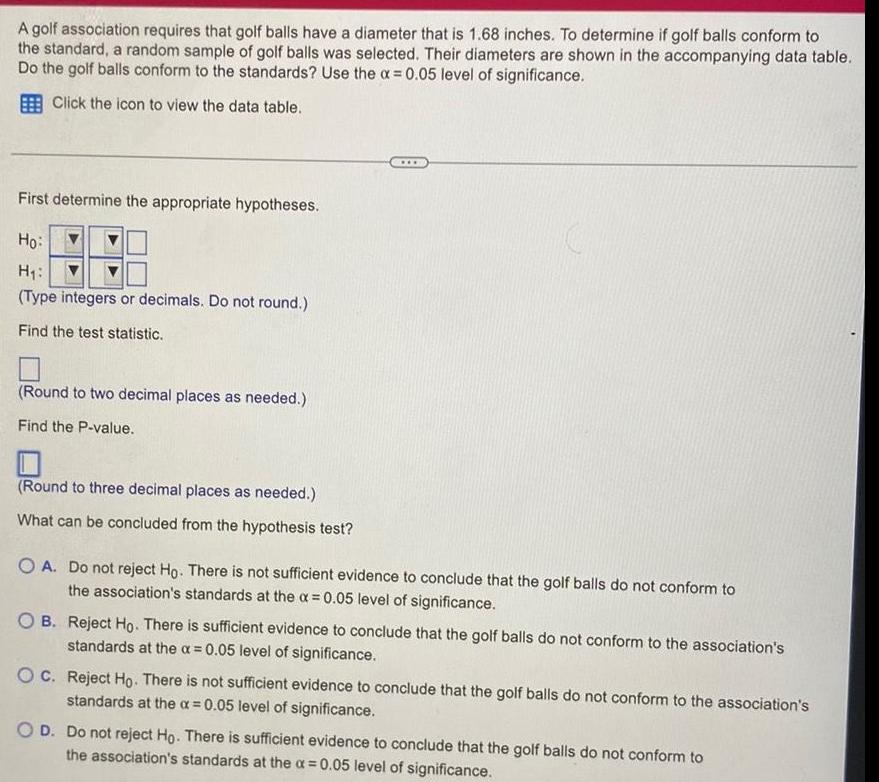
StatisticsA golf association requires that golf balls have a diameter that is 1 68 inches To determine if golf balls conform to the standard a random sample of golf balls was selected Their diameters are shown in the accompanying data table Do the golf balls conform to the standards Use the x 0 05 level of significance Click the icon to view the data table First determine the appropriate hypotheses Ho H Type integers or decimals Do not round Find the test statistic Round to two decimal places as needed Find the P value Round to three decimal places as needed What can be concluded from the hypothesis test O A Do not reject Ho There is not sufficient evidence to conclude that the golf balls do not conform to the association s standards at the x 0 05 level of significance OB Reject Ho There is sufficient evidence to conclude that the golf balls do not conform to the association s standards at the a 0 05 level of significance OC Reject Ho There is not sufficient evidence to conclude that the golf balls do not conform to the association s standards at the a 0 05 level of significance O D Do not reject Ho There is sufficient evidence to conclude that the golf balls do not conform to the association s standards at the x 0 05 level of significance
Statistics
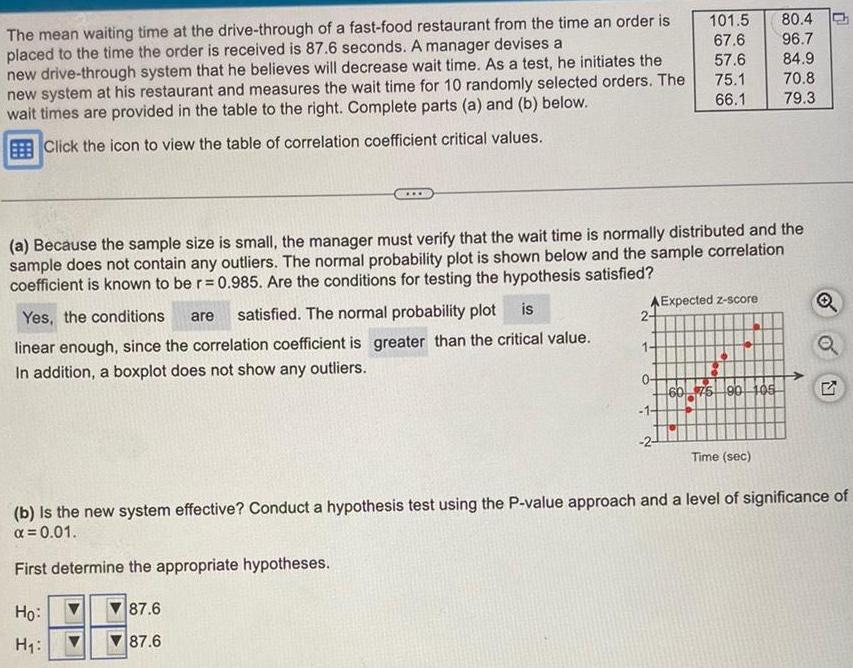
StatisticsThe mean waiting time at the drive through of a fast food restaurant from the time an order is placed to the time the order is received is 87 6 seconds A manager devises a new drive through system that he believes will decrease wait time As a test he initiates the new system at his restaurant and measures the wait time for 10 randomly selected orders The wait times are provided in the table to the right Complete parts a and b below Click the icon to view the table of correlation coefficient critical values Yes the conditions are satisfied The normal probability plot is linear enough since the correlation coefficient is greater than the critical value In addition a boxplot does not show any outliers a Because the sample size is small the manager must verify that the wait time is normally distributed and the sample does not contain any outliers The normal probability plot is shown below and the sample correlation coefficient is known to be r 0 985 Are the conditions for testing the hypothesis satisfied Ho H 101 5 67 6 57 6 70 8 75 1 66 1 79 3 AExpected z score 2 1 80 4 96 7 84 9 60 75 90 105 Time sec O Q b is the new system effective Conduct a hypothesis test using the P value approach and a level of significance of 0 01 First determine the appropriate hypotheses 87 6 87 6 N
Statistics
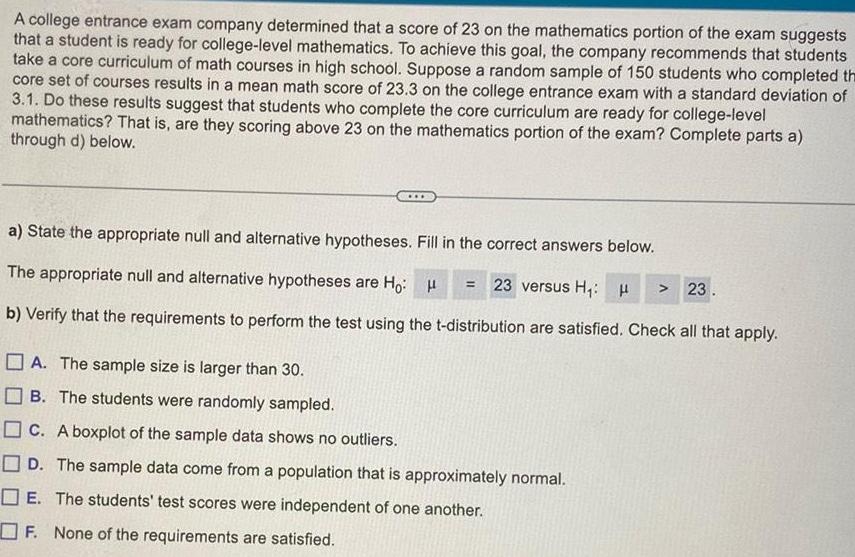
StatisticsA college entrance exam company determined that a score of 23 on the mathematics portion of the exam suggests that a student is ready for college level mathematics To achieve this goal the company recommends that students take a core curriculum of math courses in high school Suppose a random sample of 150 students who completed the core set of courses results in a mean math score of 23 3 on the college entrance exam with a standard deviation of 3 1 Do these results suggest that students who complete the core curriculum are ready for college level mathematics That is are they scoring above 23 on the mathematics portion of the exam Complete parts a through d below a State the appropriate null and alternative hypotheses Fill in the correct answers below The appropriate null and alternative hypotheses are Ho H b Verify that the requirements to perform the test using the t distribution are satisfied Check all that apply 23 versus H H A The sample size is larger than 30 B The students were randomly sampled C A boxplot of the sample data shows no outliers D The sample data come from a population that is approximately normal E The students test scores were independent of one another F None of the requirements are satisfied 23
Statistics
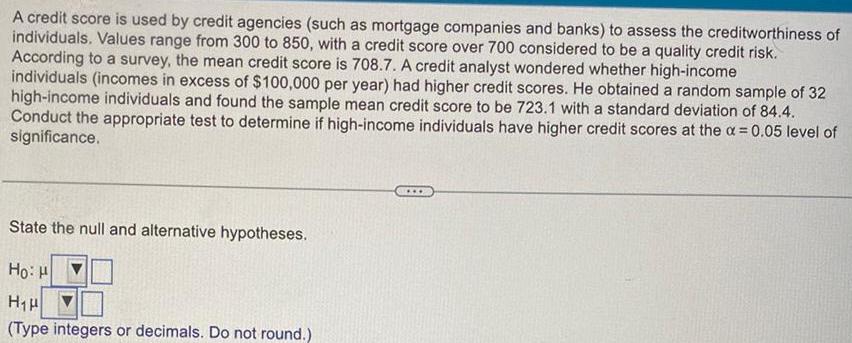
StatisticsA credit score is used by credit agencies such as mortgage companies and banks to assess the creditworthiness of individuals Values range from 300 to 850 with a credit score over 700 considered to be a quality credit risk According to a survey the mean credit score is 708 7 A credit analyst wondered whether high income individuals incomes in excess of 100 000 per year had higher credit scores He obtained a random sample of 32 high income individuals and found the sample mean credit score to be 723 1 with a standard deviation of 84 4 Conduct the appropriate test to determine if high income individuals have higher credit scores at the 0 05 level of significance State the null and alternative hypotheses Ho H H H Type integers or decimals Do not round
Statistics
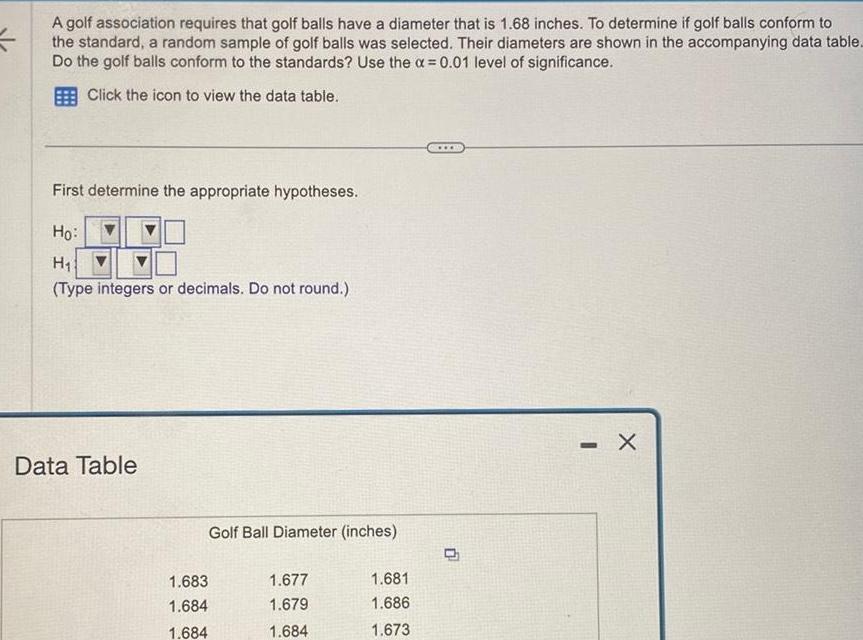
StatisticsA golf association requires that golf balls have a diameter that is 1 68 inches To determine if golf balls conform to the standard a random sample of golf balls was selected Their diameters are shown in the accompanying data table Do the golf balls conform to the standards Use the x 0 01 level of significance Click the icon to view the data table First determine the appropriate hypotheses Ho H Type integers or decimals Do not round Data Table Golf Ball Diameter inches 1 683 1 684 1 684 1 677 1 679 1 684 1 681 1 686 1 673 X
Statistics
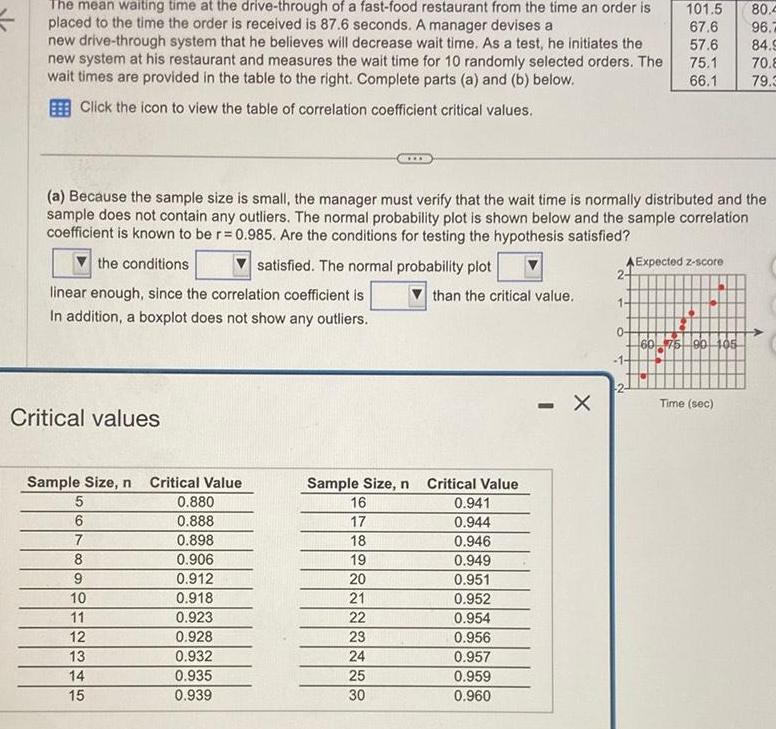
StatisticsThe mean waiting time at the drive through of a fast food restaurant from the time an order is placed to the time the order is received is 87 6 seconds A manager devises a new drive through system that he believes will decrease wait time As a test he initiates the new system at his restaurant and measures the wait time for 10 randomly selected orders The wait times are provided in the table to the right Complete parts a and b below Click the icon to view the table of correlation coefficient critical values Critical values Sample Size n Critical Value 5 0 880 0 888 0 898 0 906 0 912 0 918 0 923 0 928 0 932 0 935 0 939 a Because the sample size is small the manager must verify that the wait time is normally distributed and the sample does not contain any outliers The normal probability plot is shown below and the sample correlation coefficient is known to be r 0 985 Are the conditions for testing the hypothesis satisfied the conditions linear enough since the correlation coefficient is In addition a boxplot does not show any outliers 6 7 8 9 10 11 12 13 14 15 satisfied The normal probability plot Sample Size n 16 17 18 19 20 21 22 23 24 25 30 than the critical value Critical Value 0 941 0 944 0 946 0 949 0 951 0 952 0 954 0 956 0 957 0 959 0 960 X A Expected z score 2 101 5 67 6 57 6 75 1 66 1 1 0 60 75 90 105 80 4 96 84 9 70 8 Time sec 79 3
Statistics
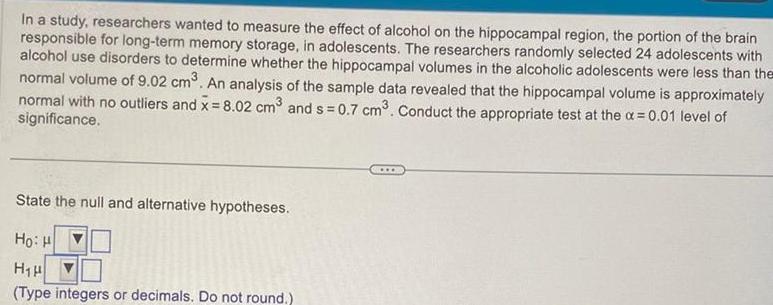
StatisticsIn a study researchers wanted to measure the effect of alcohol on the hippocampal region the portion of the brain responsible for long term memory storage in adolescents The researchers randomly selected 24 adolescents with alcohol use disorders to determine whether the hippocampal volumes in the alcoholic adolescents were less than the normal volume of 9 02 cm An analysis of the sample data revealed that the hippocampal volume is approximately normal with no outliers and x 8 02 cm and s 0 7 cm Conduct the appropriate test at the a 0 01 level of significance State the null and alternative hypotheses HoiH H H Type integers or decimals Do not round
Statistics
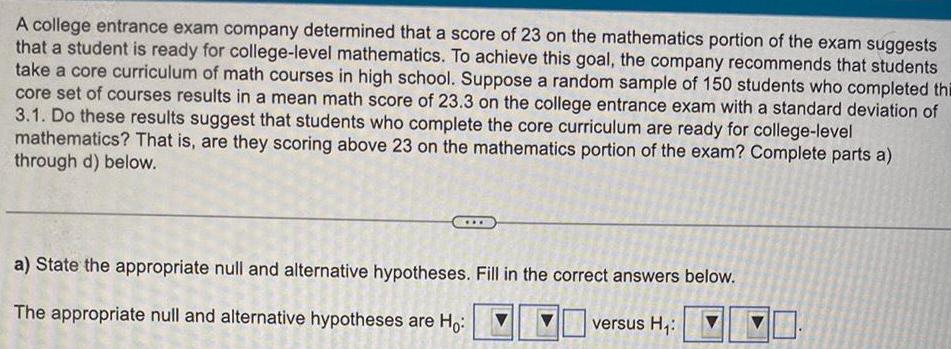
StatisticsA college entrance exam company determined that a score of 23 on the mathematics portion of the exam suggests that a student is ready for college level mathematics To achieve this goal the company recommends that students take a core curriculum of math courses in high school Suppose a random sample of 150 students who completed thi core set of courses results in a mean math score of 23 3 on the college entrance exam with a standard deviation of 3 1 Do these results suggest that students who complete the core curriculum are ready for college level mathematics That is are they scoring above 23 on the mathematics portion of the exam Complete parts a through d below a State the appropriate null and alternative hypotheses Fill in the correct answers below The appropriate null and alternative hypotheses are Ho versus H
Statistics
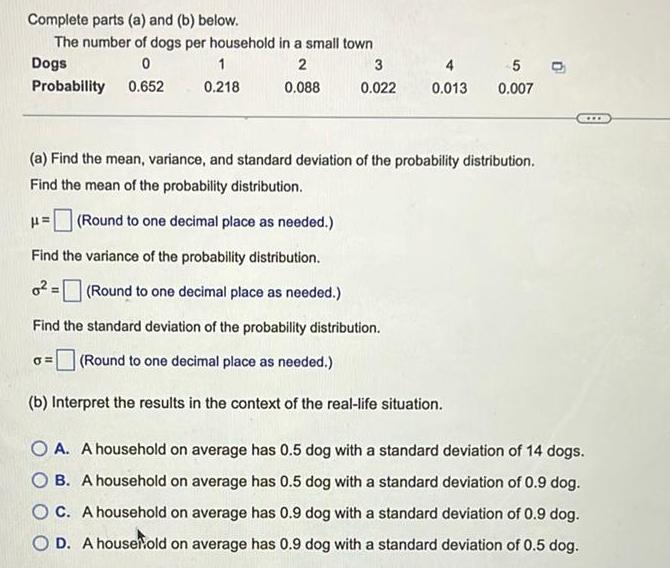
StatisticsComplete parts a and b below The number of dogs per household in a small town Dogs 0 2 Probability 0 652 0 088 1 0 218 0 3 0 022 4 0 013 5 O 0 007 a Find the mean variance and standard deviation of the probability distribution Find the mean of the probability distribution Round to one decimal place as needed Find the variance of the probability distribution o Round to one decimal place as needed Find the standard deviation of the probability distribution Round to one decimal place as needed b Interpret the results in the context of the real life situation A A household on average has 0 5 dog with a standard deviation of 14 dogs B A household on average has 0 5 dog with a standard deviation of 0 9 dog OC A household on average has 0 9 dog with a standard deviation of 0 9 dog O D A housefold on average has 0 9 dog with a standard deviation of 0 5 dog
Statistics
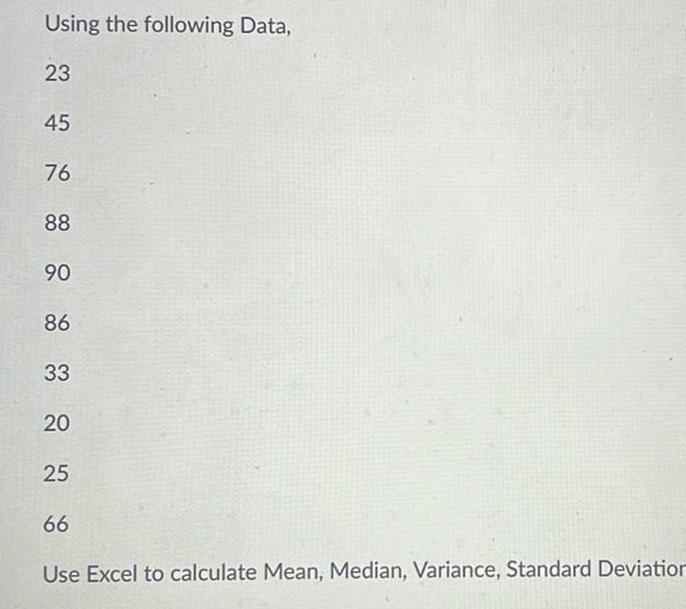
StatisticsUsing the following Data 23 45 76 88 90 86 33 20 25 66 Use Excel to calculate Mean Median Variance Standard Deviation
Statistics
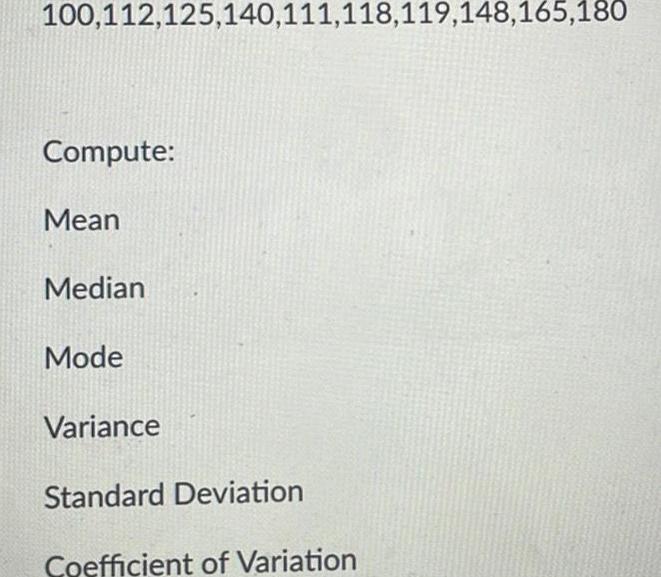
Statistics100 112 125 140 111 118 119 148 165 180 Compute Mean Median Mode Variance Standard Deviation Coefficient of Variation
Statistics
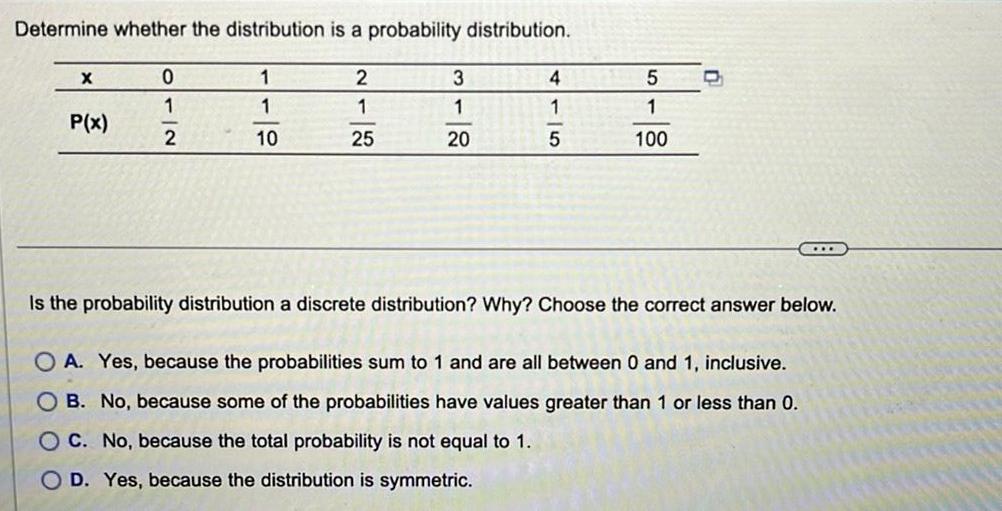
ProbabilityDetermine whether the distribution is a probability distribution X P x 0 1 2 1 1 10 2 1 25 3 1 20 4 1 5 5 1 100 Is the probability distribution a discrete distribution Why Choose the correct answer below OA Yes because the probabilities sum to 1 and are all between 0 and 1 inclusive OB No because some of the probabilities have values greater than 1 or less than 0 OC No because the total probability is not equal to 1 OD Yes because the distribution is symmetric
Statistics
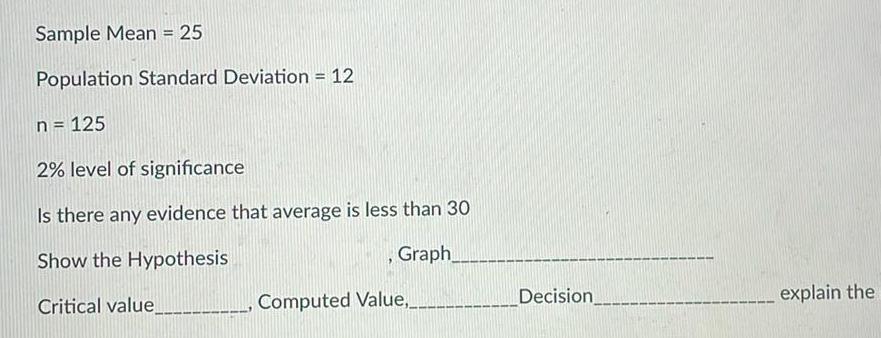
StatisticsSample Mean 25 Population Standard Deviation 12 n 125 2 level of significance Is there any evidence that average is less than 30 Show the Hypothesis Graph Critical value Computed Value Decision explain the
Statistics
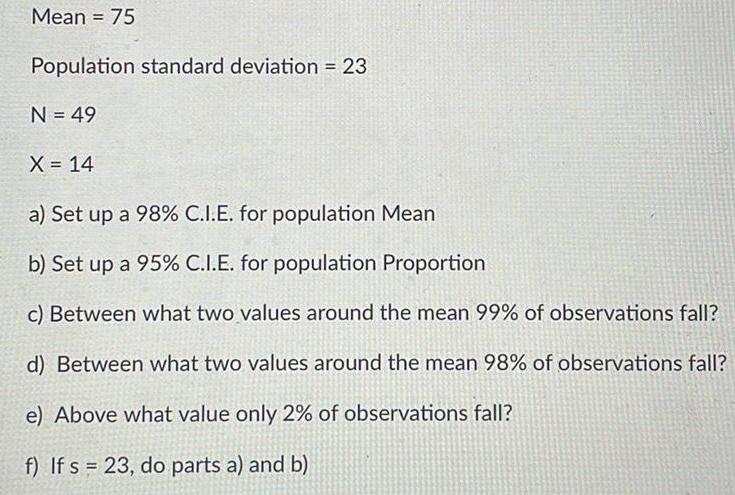
StatisticsMean 75 Population standard deviation 23 N 49 X 14 a Set up a 98 C I E for population Mean b Set up a 95 C I E for population Proportion c Between what two values around the mean 99 of observations fall d Between what two values around the mean 98 of observations fall e Above what value only 2 of observations fall f If s 23 do parts a and b
Statistics
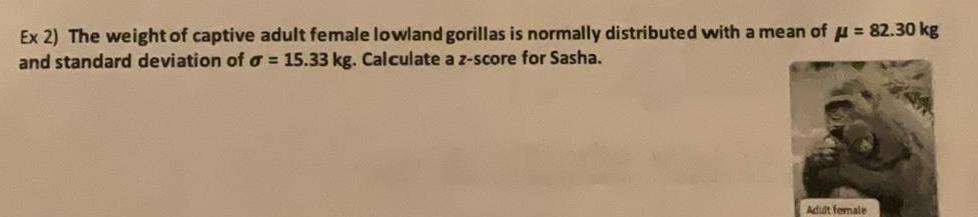
StatisticsEx 2 The weight of captive adult female lowland gorillas is normally distributed with a mean of 82 30 kg and standard deviation of a 15 33 kg Calculate a z score for Sasha Adult female
Statistics
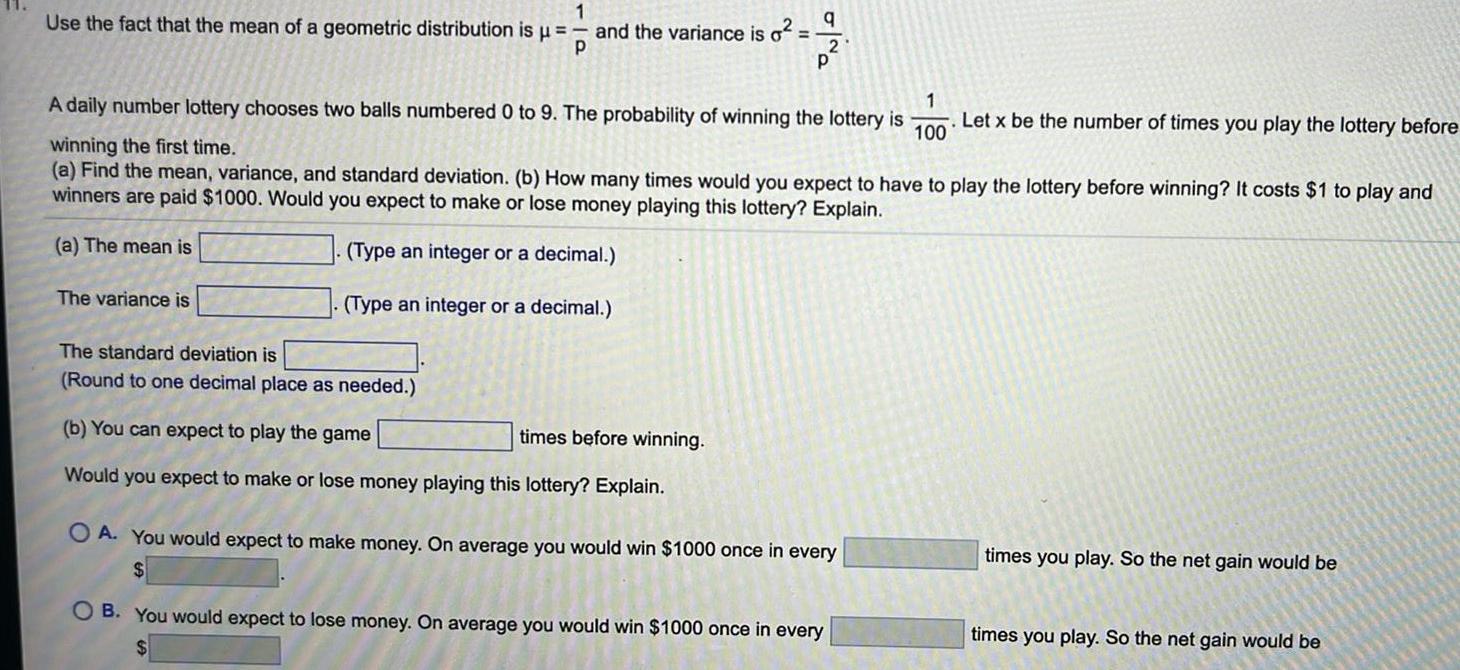
ProbabilityUse the fact that the mean of a geometric distribution is 1 P and the variance is o The variance is The standard deviation is Round to one decimal place as needed q 1 100 A daily number lottery chooses two balls numbered 0 to 9 The probability of winning the lottery is winning the first time a Find the mean variance and standard deviation b How many times would you expect to have to play the lottery before winning It costs 1 to play and winners are paid 1000 Would you expect to make or lose money playing this lottery Explain a The mean is Type an integer or a decimal Type an integer or a decimal b You can expect to play the game times before winning Would you expect to make or lose money playing this lottery Explain 2 P OA You would expect to make money On average you would win 1000 once in every OB You would expect to lose money On average you would win 1000 once in every Let x be the number of times you play the lottery before times you play So the net gain would be times you play So the net gain would be
Statistics
StatisticsEx 1 Ella and Alicia are comparing scores on their college entrance exams Ella s SAT score is 1380 Alicia s ACT score is 32 The mean SAT score is 1000 with a standard deviation of 200 The mean ACT score is 21 with a standard deviation of 5 Who has the better score
Statistics
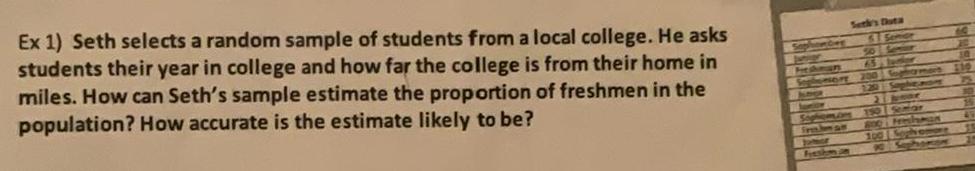
StatisticsEx 1 Seth selects a random sample of students from a local college He asks students their year in college and how far the college is from their home in miles How can Seth s sample estimate the proportion of freshmen in the population How accurate is the estimate likely to be Sophomom Trebonan Serky s Duta 65 tumor 200 S 120 Sophiea 21 jone 159 Somar 8OO Freshman 100 Sophomore 90 SaphomION
Statistics
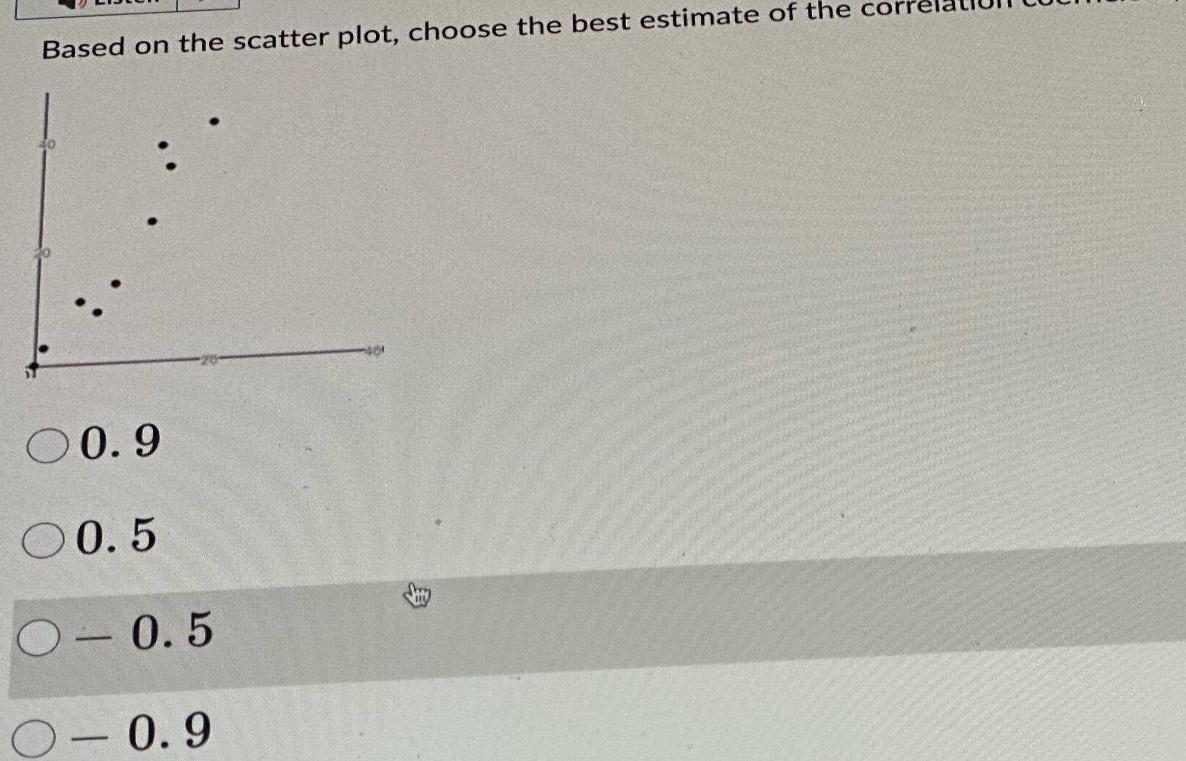
StatisticsBased on the scatter plot choose the best estimate of the con 00 9 00 5 0 0 5 0 9
Statistics
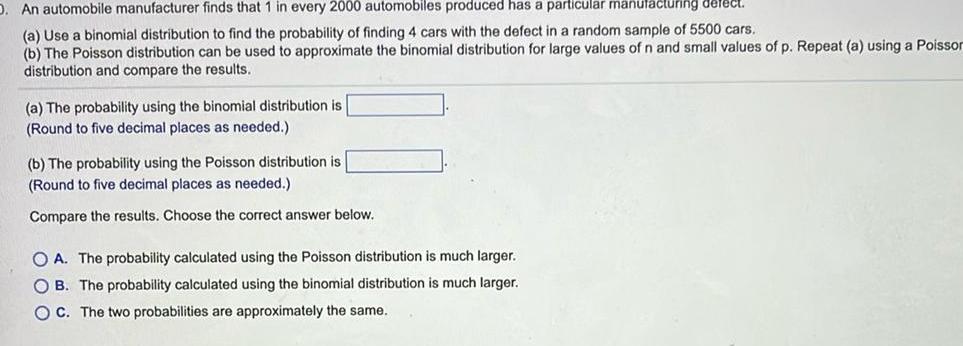
StatisticsD An automobile manufacturer finds that 1 in every 2000 automobiles produced has a particular manufacturing defect a Use a binomial distribution to find the probability of finding 4 cars with the defect in a random sample of 5500 cars b The Poisson distribution can be used to approximate the binomial distribution for large values of n and small values of p Repeat a using a Poisson distribution and compare the results a The probability using the binomial distribution is Round to five decimal places as needed b The probability using the Poisson distribution is Round to five decimal places as needed Compare the results Choose the correct answer below OA The probability calculated using the Poisson distribution is much larger OB The probability calculated using the binomial distribution is much larger OC The two probabilities are approximately the same

Statistics
StatisticsListed below are the BMIS from a sample of adult women 29 7 25 1 29 4 21 8 30 9 26 4 28 2 31 0 27 3 Fill in the frequency distribution for this data with a class width of 3 and the first lower class limit of 20 Frequency Distribution Fill in the Blank BMI s Frequency w your Make a quick sketch of the histogram on your scratch paper You do not need to show y work to the camera nor send it in What is the shape of the data set
Statistics
StatisticsB A retailer put feedback cards at the front of its store They got responses from 22 of their customers
Statistics
StatisticsA city wants to know what percent of people in the city own a dog or a cat A City worker goes door to door in the neighborhood around city hall to ask people about their pets
Statistics
StatisticsStarting with a randomly chosen ID number every fifth student ID number was chosen and that student was asked to fill out a survey
Statistics
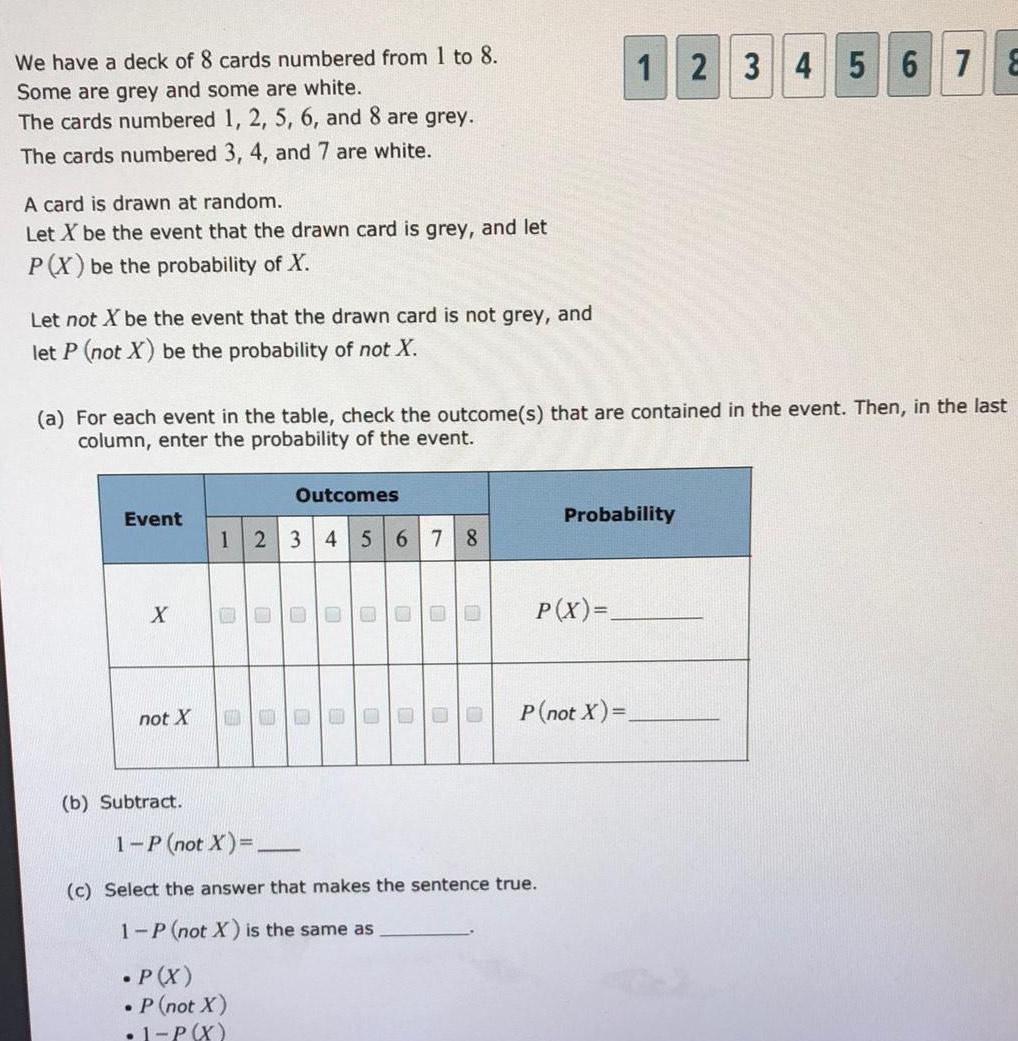
ProbabilityWe have a deck of 8 cards numbered from 1 to 8 Some are grey and some are white The cards numbered 1 2 5 6 and 8 are grey The cards numbered 3 4 and 7 are white A card is drawn at random Let X be the event that the drawn card is grey and let P X be the probability of X Let not X be the event that the drawn card is not grey and let P not X be the probability of not X a For each event in the table check the outcome s that are contained in the event Then in the last column enter the probability of the event Event X not X b Subtract Outcomes 1 2 3 4 5 6 7 8 B P X 1 P not X 0 P not X 1 P X E 0 0 O 0 U U 0 00 c Select the answer that makes the sentence true 1 P not X is the same as P X 12 3 4 5 6 7 8 Probability P not X
Statistics
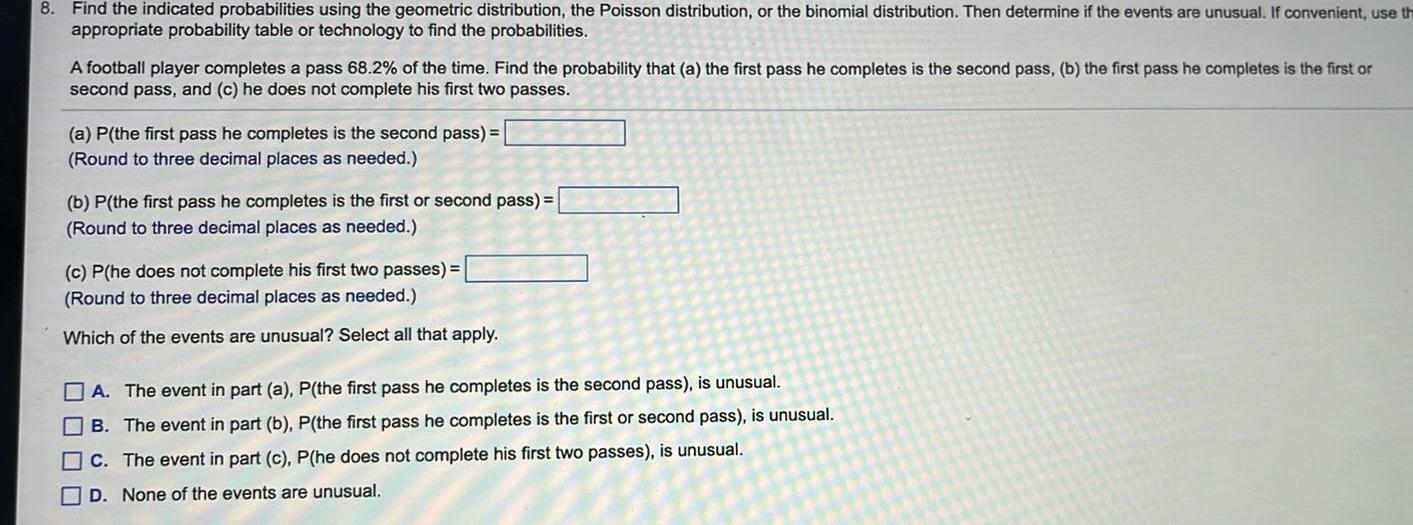
Probability8 Find the indicated probabilities using the geometric distribution the Poisson distribution or the binomial distribution Then determine if the events are unusual If convenient use th appropriate probability table or technology to find the probabilities A football player completes a pass 68 2 of the time Find the probability that a the first pass he completes is the second pass b the first pass he completes is the first or second pass and c he does not complete his first two passes a P the first pass he completes is the second pass Round to three decimal places as needed b P the first pass he completes is the first or second pass Round to three decimal places as needed c P he does not complete his first two passes Round to three decimal places as needed Which of the events are unusual Select all that apply A The event in part a P the first pass he completes is the second pass is unusual B The event in part b P the first pass he completes is the first or second pass is unusual C The event in part c P he does not complete his first two passes is unusual D None of the events are unusual
Statistics
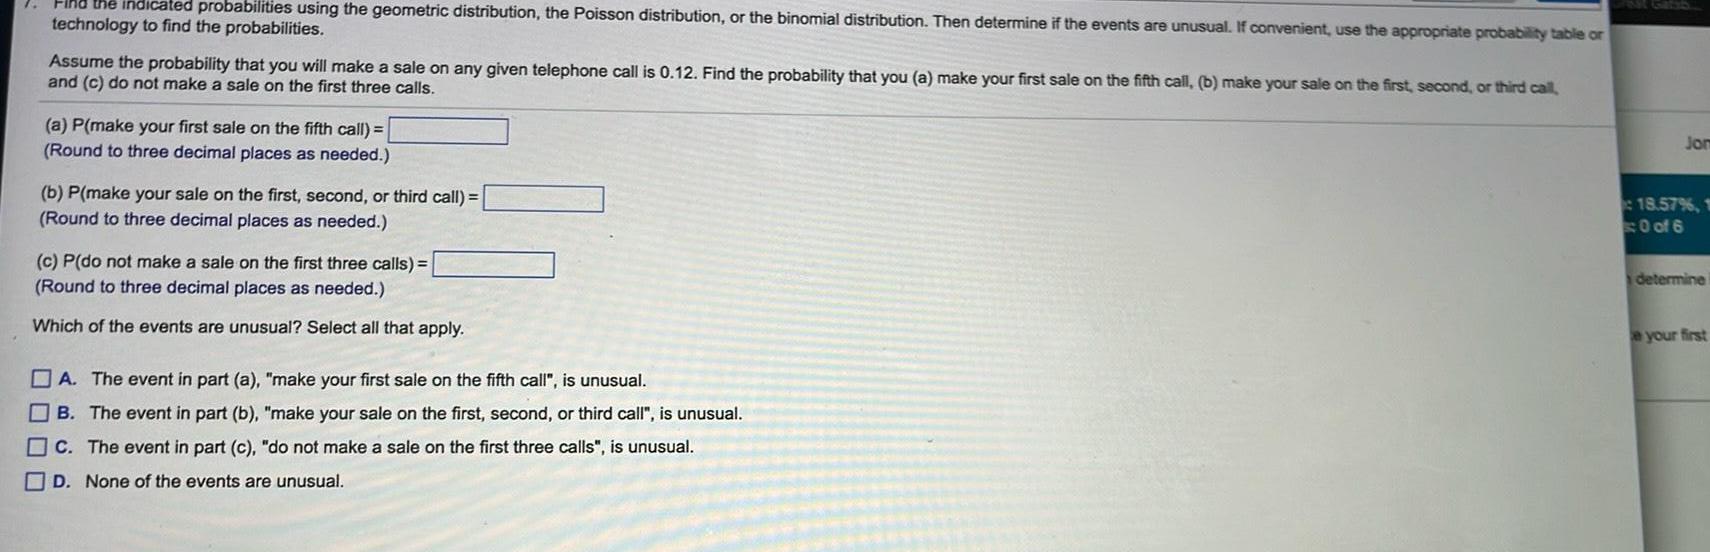
ProbabilityFind the indicated probabilities using the geometric distribution the Poisson distribution or the binomial distribution Then determine if the events are unusual If convenient use the appropriate probability table or technology to find the probabilities Assume the probability that you will make a sale on any given telephone call is 0 12 Find the probability that you a make your first sale on the fifth call b make your sale on the first second or third call and c do not make a sale on the first three calls a P make your first sale on the fifth call Round to three decimal places as needed b P make your sale on the first second or third call Round to three decimal places as needed c P do not make a sale on the first three calls Round to three decimal places as needed Which of the events are unusual Select all that apply A The event in part a make your first sale on the fifth call is unusual B The event in part b make your sale on the first second or third call is unusual c The event in part c do not make a sale on the first three calls is unusual D None of the events are unusual Jom 18 57 1 0 of 6 determine e your first
Statistics
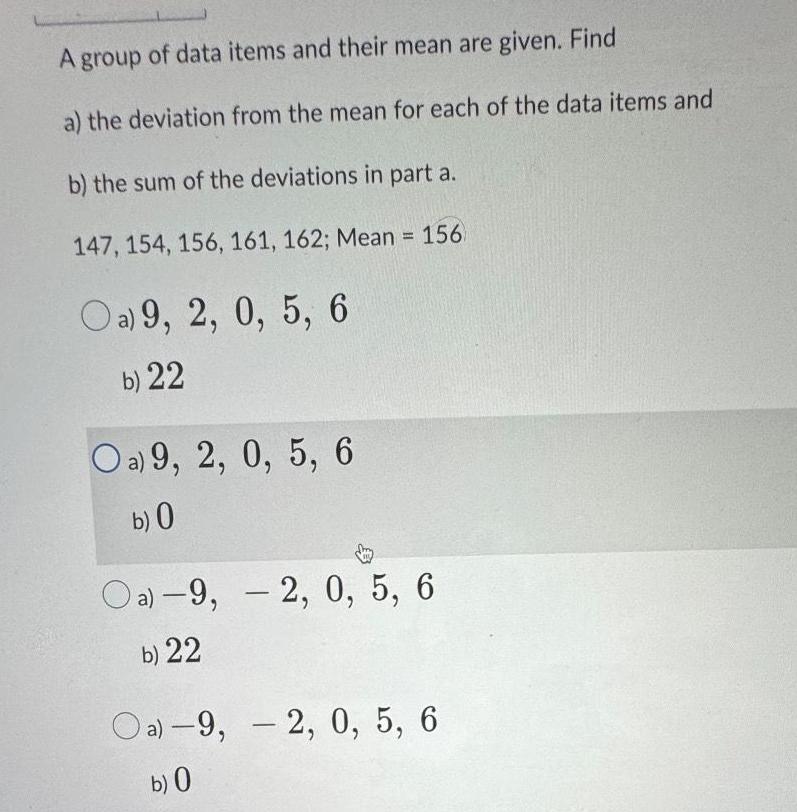
StatisticsA group of data items and their mean are given Find a the deviation from the mean for each of the data items and b the sum of the deviations in part a 147 154 156 161 162 Mean 156 Oa 9 2 0 5 6 b 22 Oa 9 2 0 5 6 b 0 Oa 9 2 0 5 6 b 22 Oa 9 2 0 5 6 b 0
Statistics
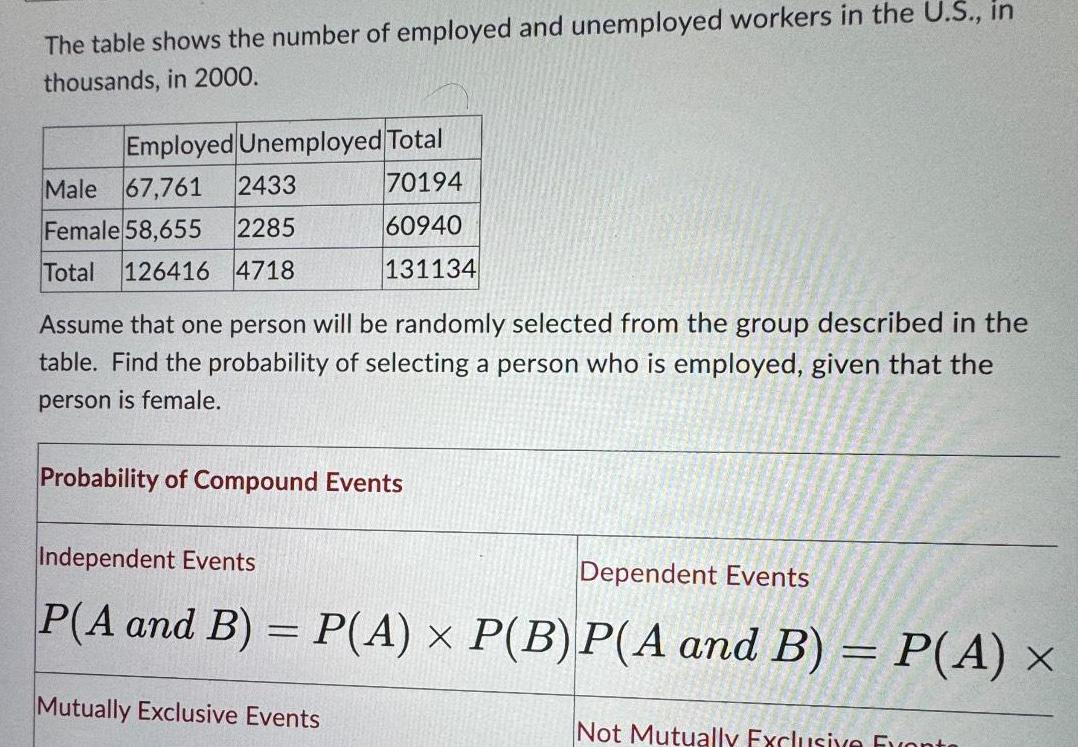
StatisticsThe table shows the number of employed and unemployed workers in the U S in thousands in 2000 Employed Unemployed Total 70194 60940 131134 Male 67 761 2433 Female 58 655 2285 Total 126416 4718 Assume that one person will be randomly selected from the group described in the table Find the probability of selecting a person who is employed given that the person is female Probability of Compound Events Independent Events Dependent Events P A and B P A P B P A and B P A x Mutually Exclusive Events Not Mutually Exclusive Events
Statistics
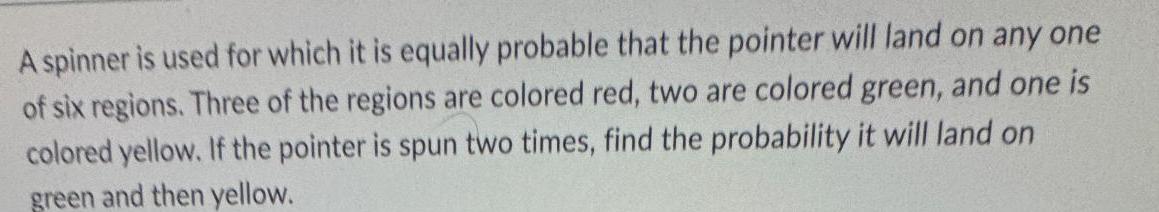
StatisticsA spinner is used for which it is equally probable that the pointer will land on any one of six regions Three of the regions are colored red two are colored green and one is colored yellow If the pointer is spun two times find the probability it will land on green and then yellow
Statistics
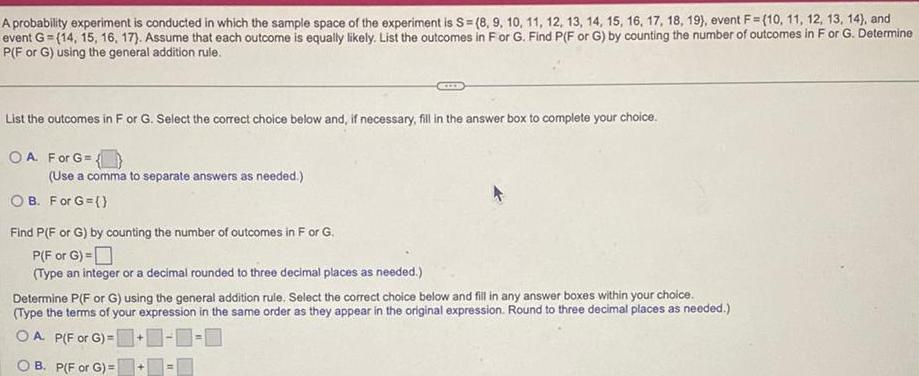
StatisticsA probability experiment is conducted in which the sample space of the experiment is S 8 9 10 11 12 13 14 15 16 17 18 19 event F 10 11 12 13 14 and event G 14 15 16 17 Assume that each outcome is equally likely List the outcomes in For G Find P F or G by counting the number of outcomes in F or G Determine P F or G using the general addition rule List the outcomes in F or G Select the correct choice below and if necessary fill in the answer box to complete your choice OA For G Use a comma to separate answers as needed OB For G Find P F or G by counting the number of outcomes in F or G P F or G Type an integer or a decimal rounded to three decimal places as needed Determine P F or G using the general addition rule Select the correct choice below and fill in any answer boxes within your choice Type the terms of your expression in the same order as they appear in the original expression Round to three decimal places as needed OA P F or G 0 0 B P F or G
Statistics
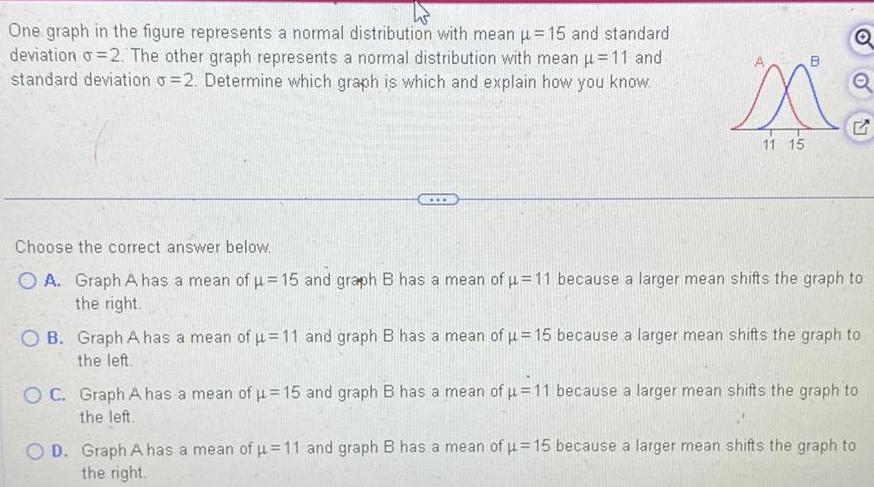
StatisticsOne graph in the figure represents a normal distribution with mean 15 and standard deviation o 2 The other graph represents a normal distribution with mean 11 and standard deviation o 2 Determine which graph is which and explain how you know 4 11 15 B Q Q G Choose the correct answer below O A Graph A has a mean of u 15 and graph B has a mean of 11 because a larger mean shifts the graph to the right OB Graph A has a mean of u 11 and graph B has a mean of u 15 because a larger mean shifts the graph to the left OC Graph A has a mean of 15 and graph B has a mean of 11 because a larger mean shifts the graph to the left O D Graph A has a mean of 11 and graph B has a mean of u 15 because a larger mean shifts the graph to the right
Statistics
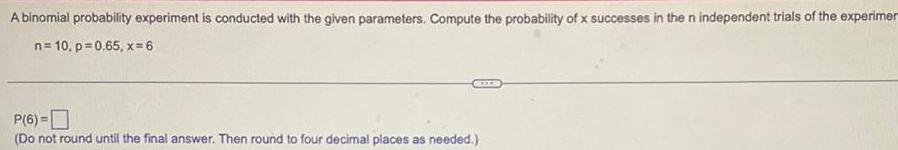
StatisticsA binomial probability experiment is conducted with the given parameters Compute the probability of x successes in the n independent trials of the experimer n 10 p 0 65 x 6 P 6 Do not round until the final answer Then round to four decimal places as needed
Statistics
StatisticsWhat is a random variable Choose the correct answer below OA A random variable is a numerical measure of the outcome of a probability experiment OB A random variable is a numerical measure having values that can be plotted on a line in an uninterrupted fashion of the outcome of OC A random variable is a numerical measure having either a finite or countable number of values of the outcome of a probability exper
Statistics
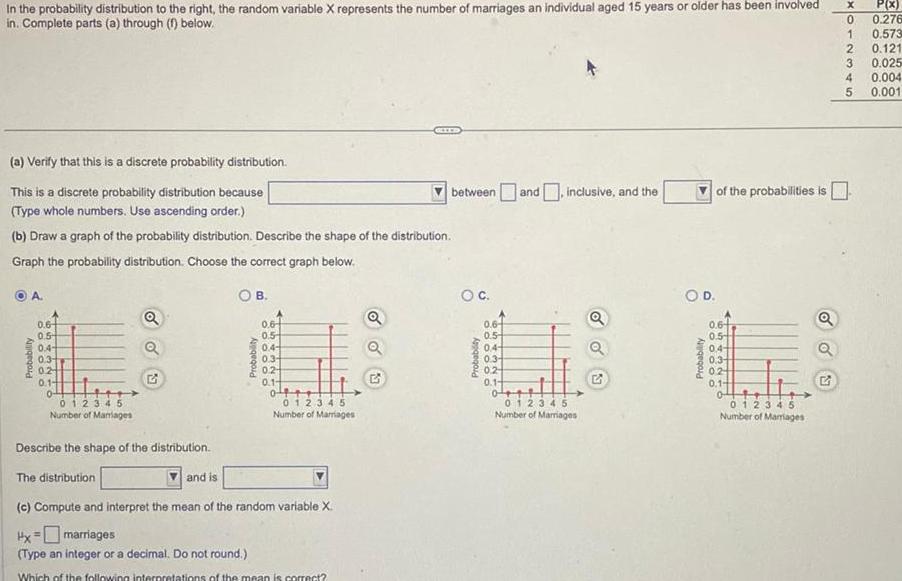
StatisticsIn the probability distribution to the right the random variable X represents the number of marriages an individual aged 15 years or older has been involved in Complete parts a through f below a Verify that this is a discrete probability distribution This is a discrete probability distribution because Type whole numbers Use ascending order b Draw a graph of the probability distribution Describe the shape of the distribution Graph the probability distribution Choose the correct graph below OB A Probability 0 6 0 5 0 4 0 3 02 0 1 0 012345 Number of Marriages Q Q Probability and is 0 6 0 5 0 4 0 3 02 0 1 0 012345 Number of Marriages Describe the shape of the distribution The distribution c Compute and interpret the mean of the random variable X Hx marriages Type an integer or a decimal Do not round Which of the following interpretations of the mean is correct Q OO 23 between and inclusive and the O C Probability 0 6 0 5 0 4 0 3 0 2 0 1 0 012345 Number of Marriages Q o o of the probabilities is O D Probability 0 6 0 5 0 4 0 3 02 0 1 012345 Number of Marriages G X P x 0 0 276 1 0 573 2 0 121 3 0 025 0 004 0 001 345
Statistics
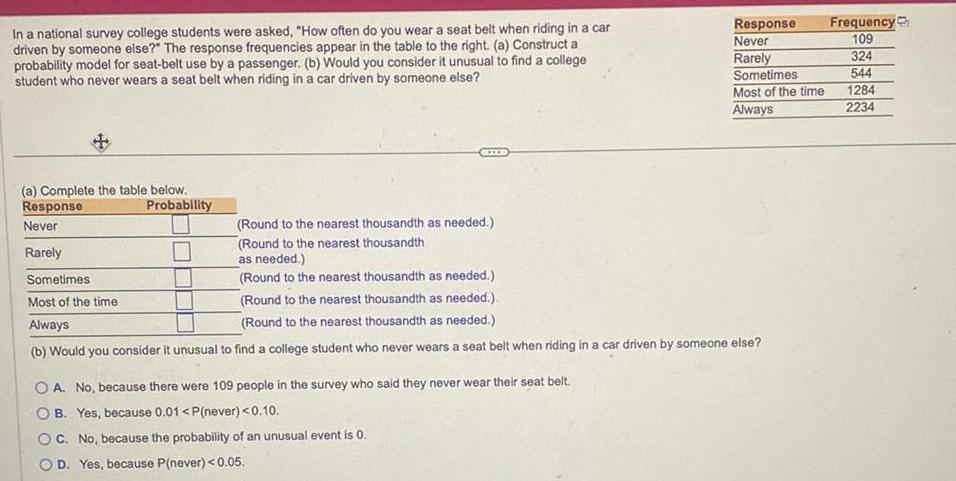
ProbabilityIn a national survey college students were asked How often do you wear a seat belt when riding in a car driven by someone else The response frequencies appear in the table to the right a Construct a probability model for seat belt use by a passenger b Would you consider it unusual to find a college student who never wears a seat belt when riding in a car driven by someone else a Complete the table below Response Never Rarely Probability Sometimes Most of the time Always Response Never Rarely Round to the nearest thousandth as needed Round to the nearest thousandth as needed Round to the nearest thousandth as needed Round to the nearest thousandth as needed Round to the nearest thousandth as needed b Would you consider it unusual to find a college student who never wears a seat belt when riding in a car driven by someone else OA No because there were 109 people in the survey who said they never wear their seat belt OB Yes because 0 01 P never 0 10 OC No because the probability of an unusual event is 0 OD Yes because P never 0 05 Sometimes Most of the time Always Frequency 109 324 544 1284 2234
Statistics
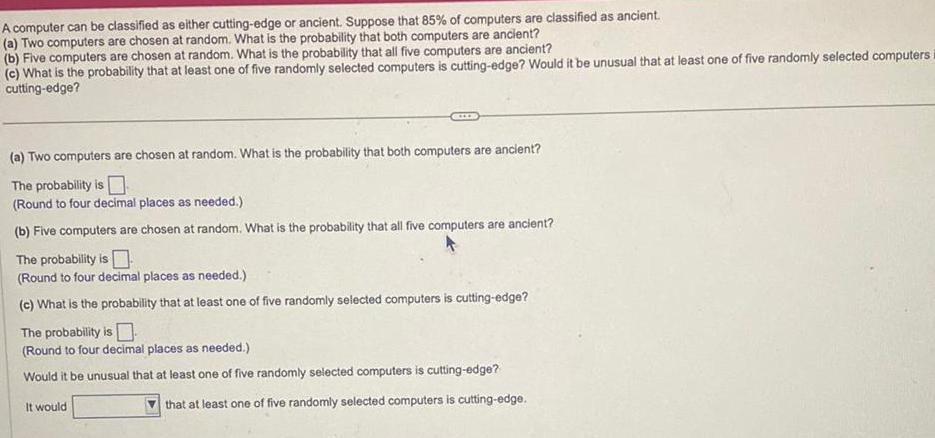
ProbabilityA computer can be classified as either cutting edge or ancient Suppose that 85 of computers are classified as ancient a Two computers are chosen at random What is the probability that both computers are ancient b Five computers are chosen at random What is the probability that all five computers are ancient c What is the probability that at least one of five randomly selected computers is cutting edge Would it be unusual that at least one of five randomly selected computers i cutting edge a Two computers are chosen at random What is the probability that both computers are ancient The probability is Round to four decimal places as needed b Five computers are chosen at random What is the probability that all five computers are ancient The probability is Round to four decimal places as needed c What is the probability that at least one of five randomly selected computers is cutting edge The probability is Round to four decimal places as needed Would it be unusual that at least one of five randomly selected computers is cutting edge It would that at least one of five randomly selected computers is cutting edge
Statistics
Probabilityet the sample space be S 1 2 3 4 5 6 7 8 9 10 Suppose the outcomes are equally likely Compute the probability of the event E an even number less than P E Type an integer or a decimal Do not round
Statistics
ProbabilityTrue or False In a probability model the sum of the probabilities of all outcomes must equal 1 Choose the correct answer below O False O True
Statistics
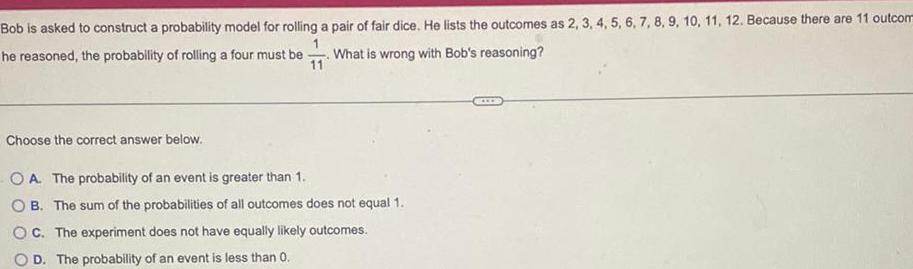
ProbabilityBob is asked to construct a probability model for rolling a pair of fair dice He lists the outcomes as 2 3 4 5 6 7 8 9 10 11 12 Because there are 11 outcom 1 he reasoned the probability of rolling a four must be What is wrong with Bob s reasoning 11 Choose the correct answer below OA The probability of an event is greater than 1 OB The sum of the probabilities of all outcomes does not equal 1 OC The experiment bes not have equally likely outcomes OD The probability of an event is less than 0
Statistics
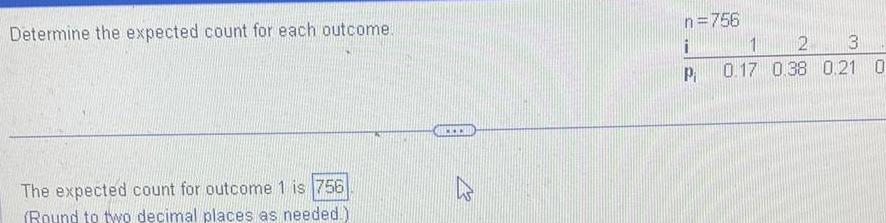
ProbabilityDetermine the expected count for each outcome The expected count for outcome 1 is 756 Round to two decimal places as needed www n 756 i P 2 3 1 0 17 0 38 0 21 0
Statistics
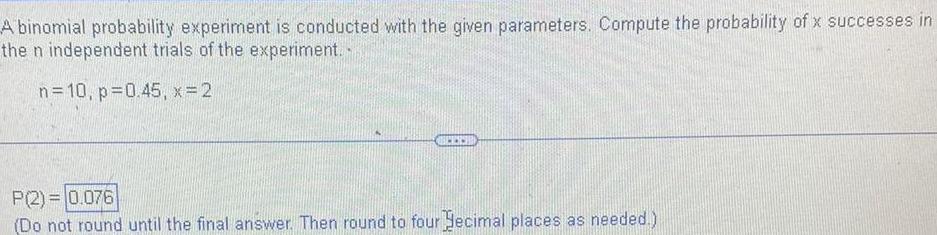
ProbabilityA binomial probability experiment is conducted with the given parameters Compute the probability of x successes in the n independent trials of the experiment n 10 p 0 45 x 2 P 2 0 076 Do not round until the final answer Then round to four ecimal places as needed
Statistics
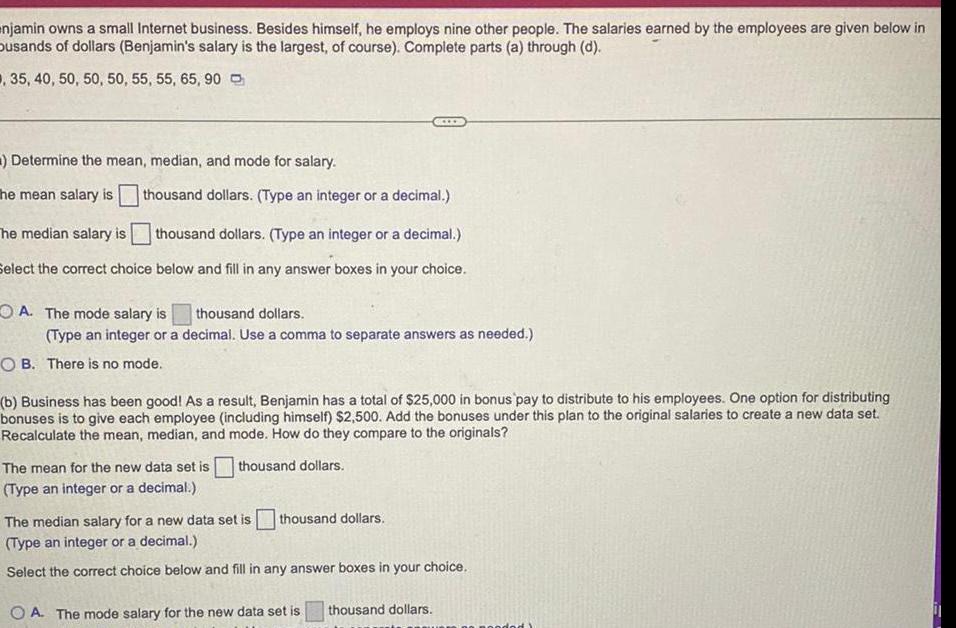
Probabilitynjamin owns a small Internet business Besides himself he employs nine other people The salaries earned by the employees are given below in busands of dollars Benjamin s salary is the largest of course Complete parts a through d 35 40 50 50 50 55 55 65 90 Determine the mean median and mode for salary The mean salary is thousand dollars Type an integer or a decimal The median salary is thousand dollars Type an integer or a decimal Select the correct choice below and fill in any answer boxes in your choice A The mode salary is thousand dollars Type an integer or a decimal Use a comma to separate answers as needed OB There is no mode b Business has been good As a result Benjamin has a total of 25 000 in bonus pay to distribute to his employees One option for distributing bonuses is to give each employee including himself 2 500 Add the bonuses under this plan to the original salaries to create a new data set Recalculate the mean median and mode How do they compare to the originals The mean for the new data set is thousand dollars Type an integer or a decimal thousand dollars The median salary for a new data set is Type an integer or a decimal Select the correct choice below and fill in any answer boxes in your choice OA The mode salary for the new data set is thousand dollars
Statistics
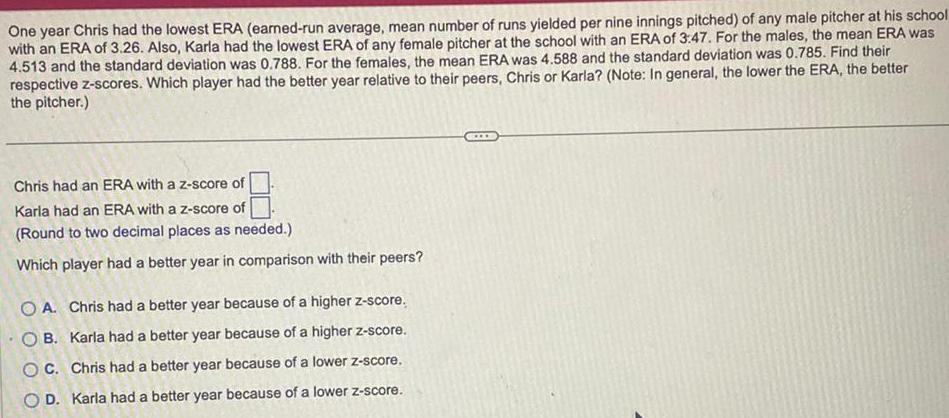
StatisticsOne year Chris had the lowest ERA earned run average mean number of runs yielded per nine innings pitched of any male pitcher at his school with an ERA of 3 26 Also Karla had the lowest ERA of any female pitcher at the school with an ERA of 3 47 For the males the mean ERA was 4 513 and the standard deviation was 0 788 For the females the mean ERA was 4 588 and the standard deviation was 0 785 Find their respective z scores Which player had the better year relative to their peers Chris or Karla Note In general the lower the ERA the better the pitcher Chris had an ERA with a z score of Karla had an ERA with a z score of Round to two decimal places as needed Which player had a better year in comparison with their peers OA Chris had a better year because of a higher z score OB Karla had a better year because of a higher z score OC Chris had a better year because of a lower z score OD Karla had a better year because of a lower z score
Statistics
StatisticsKarl and Leonard want to make soup In order to get the right balance of ingredients for their tastes they bought 5 pounds of potatoes at 4 84 per pound 3 pounds of cod for 3 76 per pound and 4 pounds of fish broth for 2 12 per pound Determine the cost per pound of the soup The cost per pound of the soup is Round to the nearest cent
Statistics
ProbabilityA family plan for a cell phone has a monthly base price of 99 plus 12 99 for each additional family member added beyond the primary account holder Write a linear function to model the monthly cost C x in dollars of a family plan for x additional family members added 1 C x 99x 12 99 2 C x 99x 12 99 3 c x 12 99x 99 4 c x 12 99x 99
Statistics
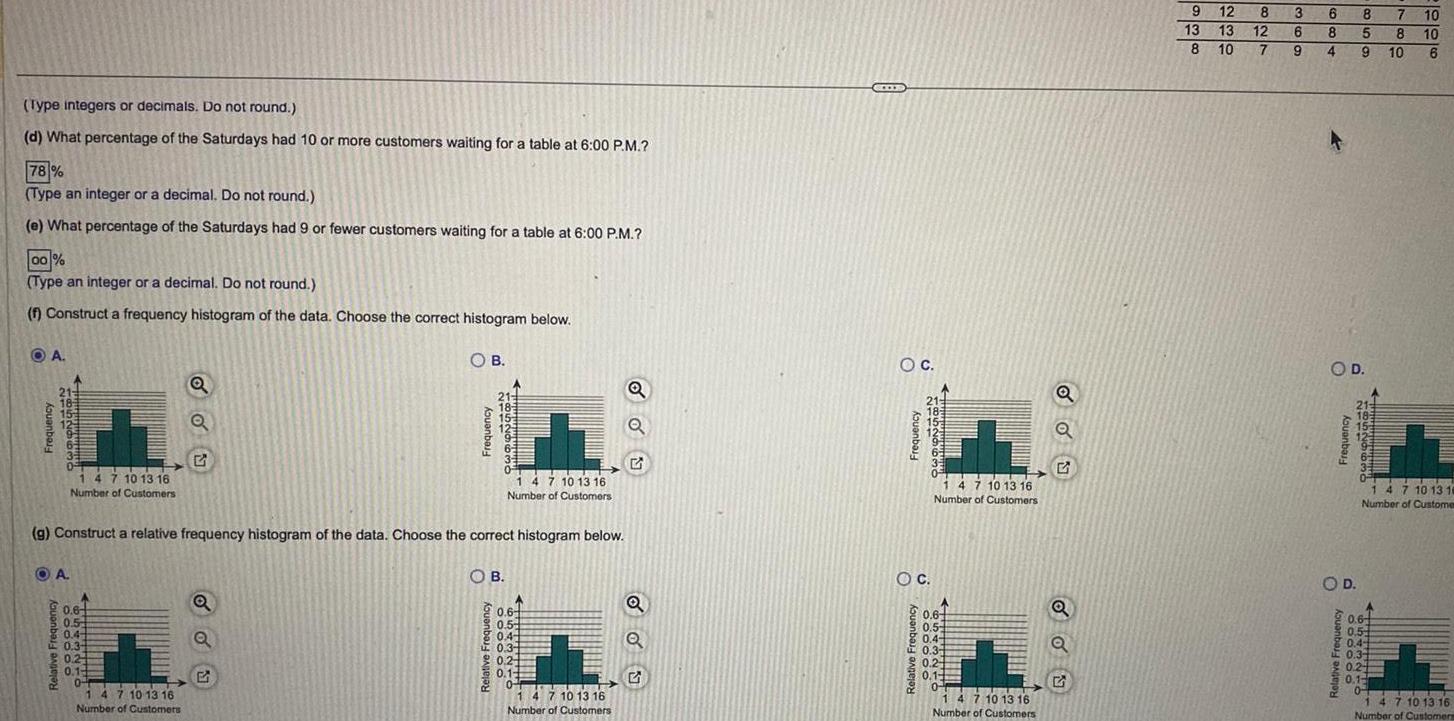
StatisticsType integers or decimals Do not round d What percentage of the Saturdays had 10 or more customers waiting for a table at 6 00 P M 78 Type an integer or a decimal Do not round e What percentage of the Saturdays had 9 or fewer customers waiting for a table at 6 00 P M 00 Type an integer or a decimal Do not round f Construct a frequency histogram of the data Choose the correct histogram below OA Frequency 21 185 15 Relative Frequency 0 A 1 4 7 10 13 16 Number of Customers 0 6 0 5 0 4 0 3 0 24 0 1 0 Q 1 4 7 10 13 16 Number of Customers i g Construct a relative frequency histogram of the data Choose the correct histogram below Q B 5 Frequency 18529636 OB Relative Frequency H 1 4 7 10 13 16 Number of Customers 0 6 0 5 0 4 0 3 0 2 0 1 204 1 4 7 10 13 16 Number of Customers Q ON Q Q CELE OC Frequency 21 18 OC 1 4 7 10 13 16 Number of Customers A 0 6 0 5 0 4 0 3 0 2 0 1 20 1 4 7 10 13 16 Number of Customers Q 5 Q Q G 9 12 13 13 8 10 8 3 12 6 7 9 6 8 4 O D OD 8 7 5 8 9 10 Relative Frequency 652963 10 10 0 6 0 5 0 4 0 3 0 2 0 1 0 6 0 1 4 7 10 13 10 Number of Custome 1 4 7 10 13 16 Number of Customers
Statistics
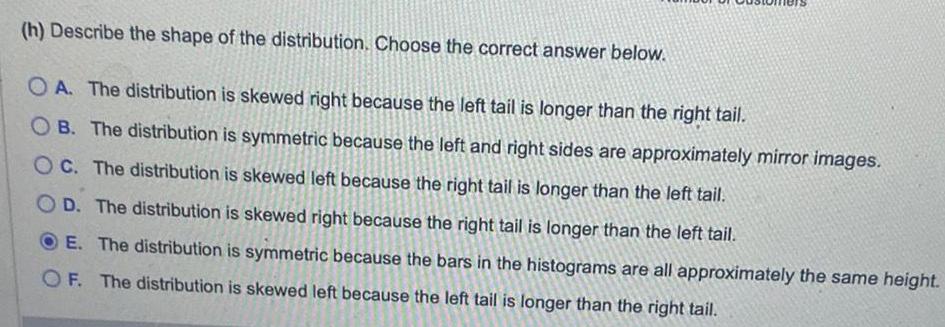
Statisticsh Describe the shape of the distribution Choose the correct answer below OA The distribution is skewed right because the left tail is longer than the right tail OB The distribution is symmetric because the left and right sides are approximately mirror images OC The distribution is skewed left because the right tail is longer than the left tail OD The distribution is skewed right because the right tail is longer than the left tail E The distribution is symmetric because the bars in the histograms are all approximately the same height OF The distribution is skewed left because the left tail is longer than the right tail
Statistics
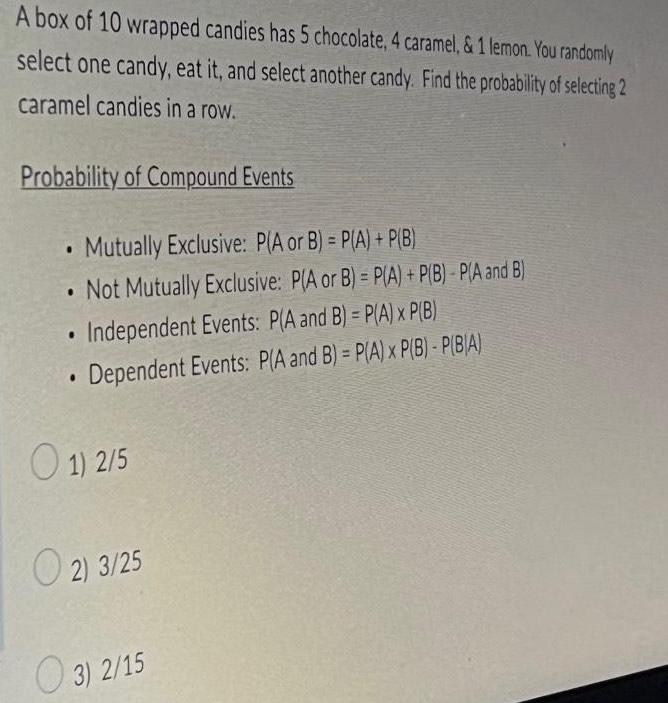
ProbabilityA box of 10 wrapped candies has 5 chocolate 4 caramel 1 lemon You randomly select one candy eat it and select another candy Find the probability of selecting 2 caramel candies in a row Probability of Compound Events Mutually Exclusive P A or B P A P B Not Mutually Exclusive P A or B P A P B P A and B Independent Events P A and B P A x P B Dependent Events P A and B P A x P B P BIA 1 2 5 2 3 25 3 2 15