Statistics Questions
The best high school and college tutors are just a click away, 24×7! Pick a subject, ask a question, and get a detailed, handwritten solution personalized for you in minutes. We cover Math, Physics, Chemistry & Biology.

Statistics
StatisticsA town s January high temperatures average 38 F with a standard deviation of 10 while in July the mean high temperature is 77 and the standard deviation is 0 In which month is it more unusual to have a day with a high temperature of 57 Explain Select the correct choice below and fill in the answer boxes within your choice Round to three decimal places as needed OA It is more unusual to have a day with a high temperature of 57 in January A high temperature of 57 in January is standard deviations above the mean and a high temperature of 57 in July is only standard deviations below the mean OB It is more unusual to have a day with a high temperature of 57 in July A high temperature of 57 in July is standard deviations below the mean and a high temperature of 57 in January is only standard deviations above the mean

Statistics
StatisticsPeople with 2 scores of 2 5 or above on a certain aptitude test are sometimes classified as geniuses If aptitude test scores have a mean of 100 and a standard deviation of 12 points what is the minim aptitude test score needed to be considered a genius The minimum aptitude test score needed to be considered a genius is points Type an integer or a decimal Do not round CIT

Statistics
StatisticsThe average score on the Stats midterm was 70 points with a standard deviation of 4 points and Karl s z score was 2 How many points did he score He coor

Statistics
StatisticsMegan s score on the Stats midterm was 57 points The class average was 71 and the standard deviation was 7 points What was her z score

Statistics
Statistics2 The accompany i box and whisker plot represents the cost in dollars of twelve CD s 05 10 15 2 Which cost is the upper quartile b What is the range of the costs of the CD s c What is the median d Which cost represents the 100 percentile How many CD s cost between 14 50 and 26 00 How many CD s cost less than 14 50 20 HI 25 30

Statistics
Statistics2 The accompanying box and whisker plot represents the cost in dollars of twelve CD s 05 10 15 20 a Which cost is the upper quartile b What is the range of the costs of the CD s c What is the median d Which cost represents the 100th percentile e How many CD s cost between 14 50 and 26 00 f How many CD s cost less than 14 50 25 30

Statistics
StatisticsT plot represents the scores earned or a math test 55 60 65 70 75 80 85 90 95 100 a What is the median score 1 75 2 70 3 85 b What score represents the first quartile 1 55 2 70 3 100 4 77 4 75 c What statement is not true about the box and whisker plot shown 1 75 represents the mean score 2 100 represents the maximum score 3 85 represents the 3rd quartile 4 55 represents the minimum score d A score of an 85 on the box and whisker plot shown refers to 1 the third quartile 2 the median 3 the maximum score 4 the mean

Statistics
Probability4 What is the median price for a snowboard at Middletown Snowboards 55 60 65 70 75 80 85 90 95 100 What is the median score 1 70 3 77 4 85
Statistics
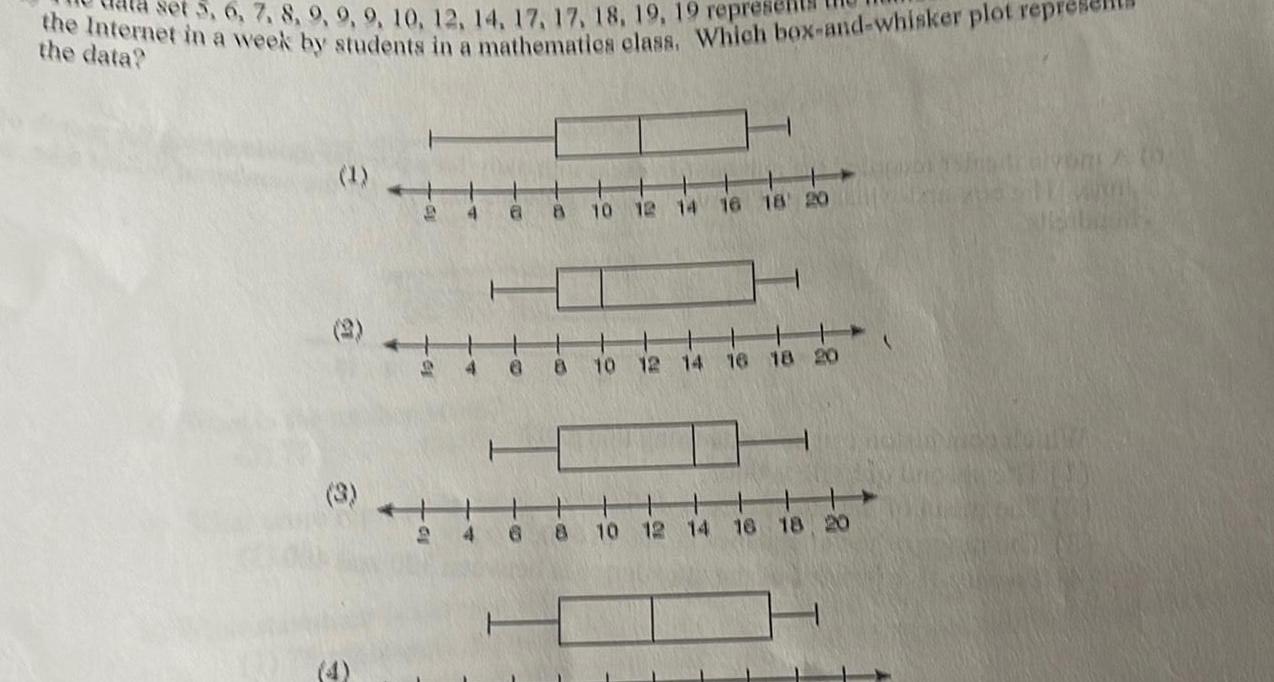
Statisticsthe Internet in a week by students in a mathematics class Which box and whisker plot repreh set 5 6 7 8 9 9 9 10 12 14 17 17 18 19 19 represe the data C L 4 4 a 8 8 8 8 10 12 14 16 18 20 10 12 14 16 18 20 10 12 14 16 18 20 1
Statistics
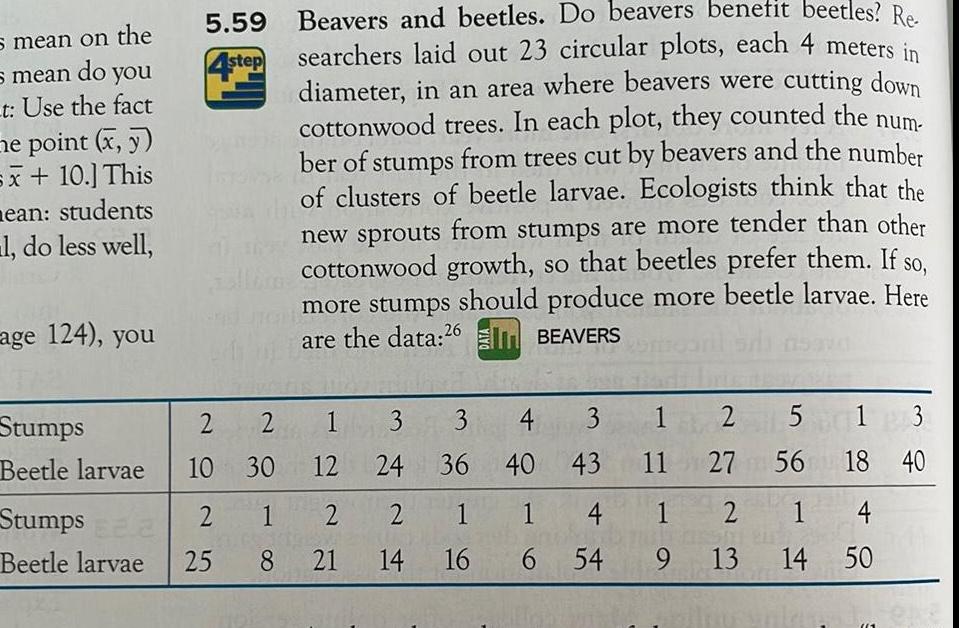
Statisticss mean on the s mean do you t Use the fact e point x y sx 10 This mean students l do less well age 124 you 5 59 Beavers and beetles Do beavers benefit beetles Re 4step searchers laid out 23 circular plots each 4 meters in diameter in an area where beavers were cutting down cottonwood trees In each plot they counted the num ber of stumps from trees cut by beavers and the number of clusters of beetle larvae Ecologists think that the new sprouts from stumps are more tender than other cottonwood growth so that beetles prefer them If so more stumps should produce more beetle larvae Here are the data 26 BEAVERS 2 2 1 10 30 12 Stumps 2 Beetle larvae 25 Stumps Beetle larvae 1 2 8 21 3 3 4 24 36 40 2 14 1 16 3 43 1 4 1 2 1 6 54 9 13 14 2 5 5 1 11 27 27 56 1 3 18 40 4 50

Statistics
Statistics1500 19 To Earn More Get Married Data show that men who are married and also divorced or widowed men earn quite a bit more than men the same age who have never been married This does not mean that a man can raise his income by getting married because men who have never been married are dif ferent from married men in many ways other than marital status Suggest sev eral lurking variables that might help explain the association between marital status and income To nouo

Statistics
Probability49 Learning online Many colleges offer online versions of courses that are also taught in the classroom It of ten happens that the students who enroll in the online version do better than the classroom students on the course exams This does not show that online instruc tion is more effective than classroom teaching because the people who sign up for online courses are often quite different from the classroom students Suggest some differences between online and classroom stu donts that might explain why online students do better

Statistics
StatisticsCity Mileage Highway Mileage We expect a car s highway gas mileage to be related to its city gas mileage in mpg Data for all 1209 vehicles in the government s 2016 Fuel Economy Guide give the regression line highway mpg 7 903 0 993 X city mpg 201 for predicting highway mileage from city mileage a What is the slope of this line Say in words what the numerical value of the slope tells you b What is the intercept Explain why the value of the intercept is not statisti cally meaningful MOSCO c Find the predicted highway mileage for a car that gets 16 mpg in the city Do the same for a car with city mileage of 28 mpg d Draw a graph of the regression line for city mileages between 10 and 50 mpg

Statistics
Probability5 9 Does Fast Driving Waste Fuel Exercise 4 8 page 109 gives data on the fuel consumption y of a car at various speeds x Fuel consumption is measured in mpg and speed is measured in miles per hour Software tells us that the equa tion of the least squares regression line is FASTDR2 55 3286 0 02286x Using this equation we can add the residuals to the original data Speed Fuel Residual 10 20 38 1 54 0 17 0 87 80 30 40 50 60 70 68 4 63 6 60 5 55 4 50 6 13 76 9 19 6 31 1 44 3 13 9 70 43 8 a Make a scatterplot of the observations and draw the regression line on your plot b Would you use the regression line to predict y from x Explain your answer c Verify the value of the first residual for x 10 Verify that the residuals have sum zero up to roundoff error d Make a plot of the residuals against the values of x Draw a horizontal line at height zero on your plot How does the pattern of the residuals about this line compare with the pattern of the data points about the regression lina torplot from nort a
Statistics
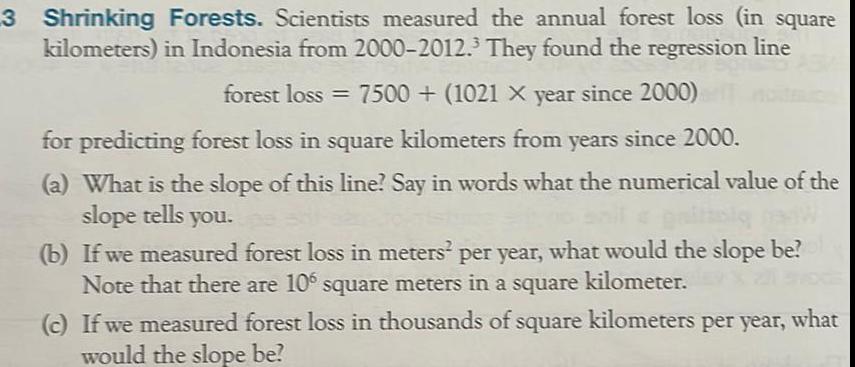
Statistics3 Shrinking Forests Scientists measured the annual forest loss in square kilometers in Indonesia from 2000 2012 They found the regression line forest loss 7500 1021 X year since 2000 for predicting forest loss in square kilometers from years since 2000 a What is the slope of this line Say in words what the numerical value of the slope tells you b If we measured forest loss in meters per year what would the slope be Note that there are 106 square meters in a square kilometer c If we measured forest loss in thousands of square kilometers per year would the slope be what
Statistics
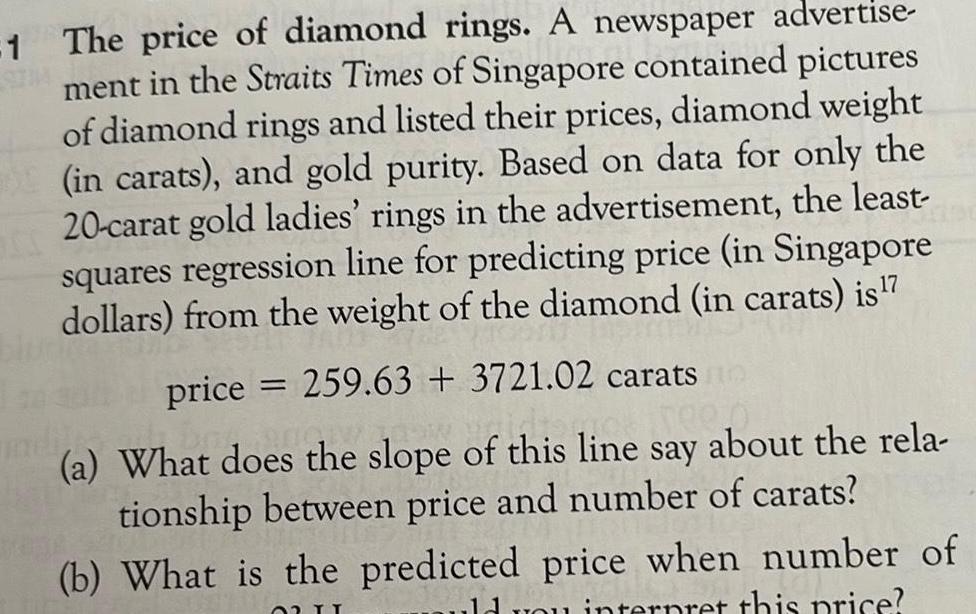
Probability1 The price of diamond rings A newspaper advertise ment in the Straits Times of Singapore contained pictures of diamond rings and listed their prices diamond weight in carats and gold purity Based on data for only the 20 carat gold ladies rings in the advertisement the least squares regression line for predicting price in Singapore dollars from the weight of the diamond in carats is 7 TRIS price 259 63 3721 02 carats a What does the slope of this line say about the rela tionship between price and number of carats b What is the predicted price when number of you interpret this price 02 II

Statistics
StatisticsEquivalent Resultant Force and Couple Moment System reducing a given system down to a single resultant force and a single resultant moment at a specified location Simplest Resultant Force System reducing a given system down to a single resultant force with NO couple moment acting at a specified position Can ALL 2D force and couple moment systems be reduced to a Simplest Resultant Force System Explain why or why not 500 N 3m 2000 N m 200 N 4 m 8 m

Statistics
StatisticsListed below are the lengths in minutes of some animated movies Using the lengths listed below answer the question Complete sentences are Not needed in this problem but remember your unit labels 64 79 66 68 69 71 71 72 74 75 75 76 77 77 77 78 82 85 92 120 Find the data value associated with P38 Show your calculations and explain how you obtained your results

Statistics
StatisticsStep 1 of 2 Given the points graphed in the following figure use quadratic regression to find the quadratic function of best fit Round the coefficients to three decimal places if necessary 10 5 5 Enable Zoom Pan 10

Statistics
StatisticsInput x Output y b We are also given the following data set 1 5 2 7 3 7 4 8 5 7 6 8 7 9 8 10 Utilize desmos to find the equation of this line by typing the data into a table and using the y mx b notation Report the answer as y mx b to the second decimal place
Statistics
StatisticsA city s transportation department is interested in exploring the relationship between the outside temperature and the number of passengers that ride the bus line to better serve their customers The manager recorded the temperature at the beginning of the hour and then had a bus driver record the number of passengers that boarded the bus throughout the hour The correlation coefficient r was calculated to be 0 88 Use this value to determine the percentage of the variation in the number of passengers that cannot be explained by the outside temperature Round your answer to the nearest whole number percentage

Statistics
StatisticsDoctors wanted to know the relationship between aerobic exercise and health They gathered information on the number of miles ran walked a week and the number of doctor visits over the course of 1 year Click here to open this data in StatCrunch Miles Per Week 1 9 11 2 8 13 2 15 10 12 4 5 73 7 3 5 7 2 10 Doctor Visits in a Year 9 4 1 6 1 0 8 1 1 2 2 4 3 5 6 2 7 2 What is the observed number of doctor visits for 9 miles per week

Statistics
ProbabilityThe following linear regresion equation represents 18 brown trout caught in a local river The fish were measured inches and weighed ounces before they were released back into the river Weight 2 28 1 20Length Use the equation to predict the weight of a brown trout that is 13 inches in length Do not round
Statistics
StatisticsOn the first statistics exam the correlation between the number hours studied and the grade earned was 0 8 What percent of the variation in the grade earned can be explained by the number of hours studied 40 64 1 6 89

Statistics
Statisticsditure have a no correlation As monthly incomes increase food expenditures stay the same Monthly income and monthly food expenditure have a strong negative correlation As monthly incomes increase food expenditures are decreasing O Monthly income and monthly food expenditure have a strong positive correlation As monthly incomes increase food expenditures are decreasing Question 7 0 5 points You want to investigate whether there is a relationship between age and amount of weight lost in a group of 45 women participating in a 12 week diet program The women s data is recorded Click here to open this data in StatCrunch What is the correlation coefficient Round your answer to 3 decimal places A StatCrunch Row 1 2 3 4 5 6 7 8 9 10 11 12 13 14 15 16 17 18 19 20 21 22 23 31 Applets Edit Data Age Weight Loss It var3 2 19 3 5 4 7 07 1 7 3 83 4 65 1 3 1 77 2 81 0 5 5 31 0 61 7 84 9 54 0 38 1 68 1 13 1 02 12 17 2 55 4 1 0 95 27 35 28 26 32 25 34 32 34 32 28 32 32 26 35 33 40 29 22 35 38 38 V Stat

Statistics
StatisticsYou want to investigate whether there is a relationship between age and amount of weight lost in a group of 45 women participating in a 12 week diet program What would be the response variable in this situation N What would be the explanatory variable in this situation

Statistics
StatisticsAn economist reported that the correlation between the monthly income of a family of 4 and the monthly food expenditure for middle class families is 0 81 Which of the statements below correctly interprets the correlation coefficient Monthly income and monthly food expenditure have a strong positive correlation As monthly incomes increase food expenditures are also increasing Monthly income and monthly food expenditure have a no correlation As monthly incomes increase food expenditures stay the same Monthly income and monthly food expenditure have a strong negative correlation As monthly incomes increase food expenditures are decreasing Monthly income and monthly food expenditure have a strong positive correlation As monthly incomes increase food expenditures are decreasing
Statistics
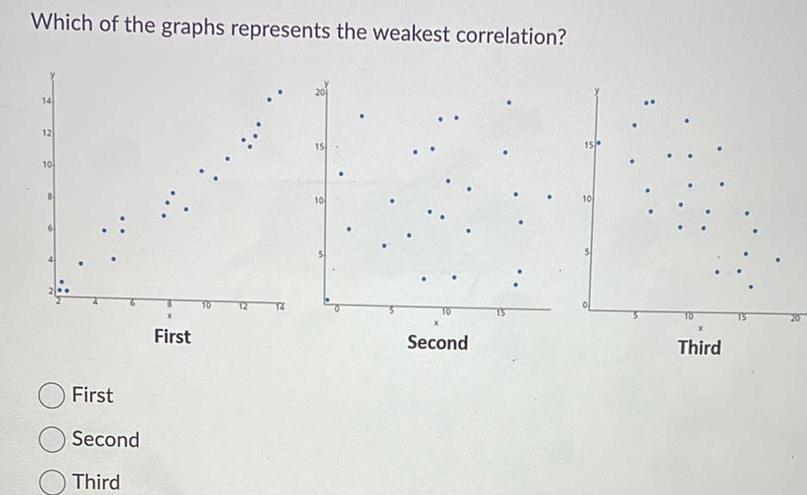
StatisticsWhich of the graphs represents the weakest correlation 14 12 10 First Second Third First 15 10 TO Second 10 Third
Statistics
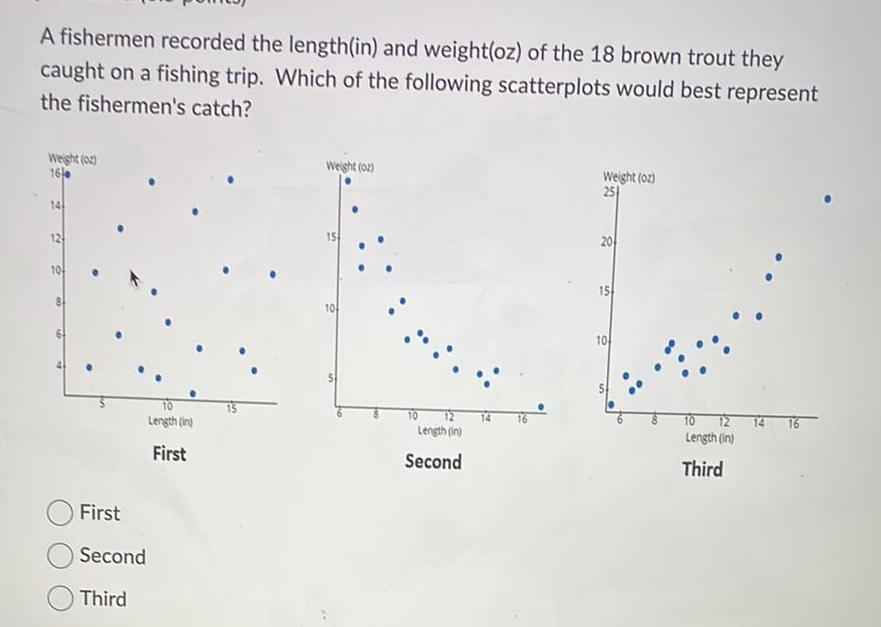
StatisticsA fishermen recorded the length in and weight oz of the 18 brown trout they caught on a fishing trip Which of the following scatterplots would best represent the fishermen s catch Weight 0 16 0 14 12 10 10 Length in First First Second Third Weight oz 10 St Length in Second Weight oz 25 20 15 10 10 12 Length in Third

Statistics
ProbabilityA business owner randomly selected 15 days from the last quarter of the most recent year They investigated the number of employees that reported to work that day and the number of products that the employees produced The scatterplot is below How many products were produced on the day that 8 employees reported to work Number of Products 1600 1400 1200 1000 800 10 12 Number of Employees 14 16 18

Statistics
StatisticsWhich of the following scatterplots have a correlation coefficient close to r 0 58 10 First Second Third First 15 10 Second 10 Third

Statistics
StatisticsNumber of Products 1600 1400 1200 1000 800 A 10 12 Number of Employees 14 A 16 The correlation coefficient for relationship between number of employees and umber of products is positive negative or zero 18 According to the scatterplot if the number of employees decreased the number o products would increase decrease or stay the same

Statistics
StatisticsWine and cancer in women Some studies have sug gested that a nightly glass of wine may not only take the edge off a day but also improve health Is wine good for your health A study of nearly 1 3 million middle aged British women examined wine consump tion and the risk of breast cancer The researchers were interested in how risk changed as wine con sumption increased Risk is based on breast cancer rates in drinkers relative to breast cancer rates in non drinkers in the study with higher values indicating greater risk In particular a value greater than 1 indi cates a greater breast cancer rate than that of non drinkers Wine intake is the mean wine intake in grams of alcohol per day one glass of wine is approx imately 10 grams of alcohol of all women in the study who drank approximately the same amount of wine per week Here are the data for drinkers only 16 CANCER Wine intake x grams of 2 5 8 5 15 5 26 5 alcohol per day Relative risk y 1 00 1 08 1 15 1 22 a Make a scatterplot of these data Based on the scat terplot do you expect the correlation to be positive or negative Near 1 or not b Find the correlation r between wine intake and rela tive risk Do the do

Statistics
Statistics5 Outsourcing by Airlines Airlines have increasingly outsourced the maintenance of their planes to other companies A concern voiced by critics is that the mainte nance may be less carefully done so that outsourcing creates a safety hazard In addi tion flight delays are often due to maintenance problems so one might look at government data on percent of major maintenance outsourced and percent of flight delays blamed on the airline to determine if these concerns are justified This was done and data from 2005 and 2006 appeared to justify the concerns of the critics Do more recent data still support the concerns of the critics Here are data from 2014 In AIRLINE Airline Alaska American Delta Frontier Hawaiian Outsource Percent 51 0 29 4 36 7 46 3 78 4 Delay Percent 10 35 20 32 14 48 21 42 5 06 Airline JetBlue Southwest United US Airways Outsource Percent 68 4 58 2 52 6 54 3 Delay Percent 19 93 28 47 23 46 13 68

Statistics
StatisticsDeath by Intent The data described in Exercise 4 4 also indicated that the homicide rates for some counties should be treated with caution because of low counts DEATH2 County Allen Ashtabula Butler Clermont Clark Columbiana Cuyahoga Delaware Franklin Greene Hamilton Lake Licking Homicide Suicide Rate 3 8 2 8 2 7 1 0 5 4 3 4 10 0 1 0 8 8 2 7 9 2 1 8 4 0 Rate Caution County 9 9 Y Lorain 15 5 Y Lucas 12 8 N Mahoning 16 0 Y Medina 13 6 N Miami 15 2 Y 9 8 N 8 2 Y 11 3 N 11 3 Y 10 7 N 12 9 Y 13 2 N Montgomery Portage Stark Summit Trumbull Warren Wayne Wood Homicide Suicide Rate Rate 3 6 7 6 10 6 1 0 1 0 9 5 1 6 4 8 4 9 6 8 1 0 1 0 1 0 15 6 12 8 11 4 10 0 9 6 15 5 11 9 13 0 11 5 16 1 9 6 10 8 8 4 Caution N N N Y Y N Y ZZZY N N N Y Y a Make a scatterplot of homicide rate versus suicide rate for all 26 counties Use separate symbols to distinguish counties for which the homicide rate is to be treated with caution from those for which there is no caution b Does the same overall pattern hold for both types of counties What is the 1 CC

Statistics
Statistics9 Teaching and research A college newspaper inter views a psychologist about student ratings of the teach ing of faculty members The psychologist says The evidence indicates that the correlation between the research productivity and teaching rating of faculty members is close to zero The paper reports this as Professor McDaniel said that good researchers tend to be poor teachers and vice versa Explain why the paper s report is wrong Write a statement in plain language don t use the word correlation to explain the

Statistics
Statistics3 Predicting Life Expectancy Identifying variables that can be used to predict life expectancy is important for insurance compa nies economists and policymakers Several researchers have in vestigated the extent to which poverty level can be used to predict life expectancy Name two other variables that could be used to predict life expectancy

Statistics
Statistics1 Explanatory and Response Variables You have data on a large group of college students Here are four pairs of variables measured on these students For each pair is it more reasonable to simply explore the relationship between the two variables or to view one of the variables as an explanatory variable and the mother as a response variable In the latter case which is the explanatory variable giranobelst sth bestenabhu of and which is the response variable

Statistics
ProbabilityThe histogram below shows the time spent on a Saturday by visitors to a museum browsing an exhibit There were 300 visitors that day The number of visitors that spent less than 25 minutes at the museum that day is closest to Frequency 60 55 50 LL DS 15 25 35 45 55 65 75 85 95 105115125135145155 Time minutes O A 25 OB 80 O C 60 O D 40

Statistics
ProbabilityEnteroliths are calcifications that form in the gut of a horse The stones can cause considerable morbidity and mortality A study was conducted to investigate factors such as diet and environment that may be related to the formation of enteroliths The study contained 62 horses with enteroliths cases and 75 horses without controls The graph below contains side by side boxplots of the ages for cases and controls Based on the poxplots the mean age for cases 30 25 20 15 10 S case enteroliths control no enteroliths Panel variable Diagnosis Box plot of age by diagnosis case control

Statistics
StatisticsEighteen faculty members in a college math department range in age from 32 to 68 A stemplot follows 3 456 24899 03569 347899 38 The median age in years of the faculty members is O A 45 OB 49 O C 47 5 O D 39 4

Statistics
StatisticsEmployees at a large company are surveyed about their health insurance status Employees are coded as 1 if health insurance is obtained through the company s benefit program 2 if health insurance is obtained from another source e g through a spouse s employment benefit program or 0 if the employee does not have health insurance This variable is OA numerical B categorical OC quantitatively categorical O D All of the answer options are correct

Statistics
StatisticsPercent 30 M 20 15 10 S 0 Bological Sciences Math and Physical Sciences Collage O A over 60 O B approximately 50 O C approximately 40 D approximately 30 Engineering Business

Statistics
ProbabilityIvan is participating in a 6 day cross country biking challenge He biked for 70 67 67 62 and 49 miles on the first five days How many miles does he need to bike on the last day so that his average mean is 64 miles per day miles X
Statistics
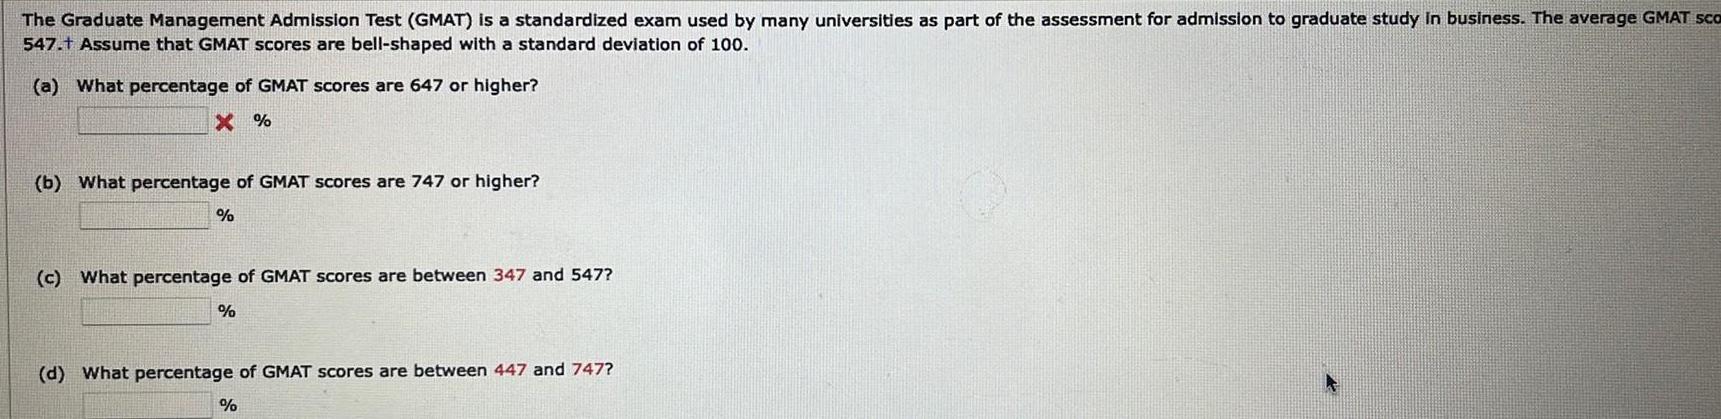
StatisticsThe Graduate Management Admission Test GMAT is a standardized exam used by many universities as part of the assessment for admission to graduate study in business The average GMAT sco 547 t Assume that GMAT scores are bell shaped with a standard deviation of 100 a What percentage of GMAT scores are 647 or higher X b What percentage of GMAT scores are 747 or higher c What percentage of GMAT scores are between 347 and 547 d What percentage of GMAT scores are between 447 and 747

Statistics
ProbabilityThe following diagram represents a process where two components are made at stations A1 and A2 one component is made at A1 and the other at A2 These components are then assembled at station B and moved through the rest of the process where some additional work is completed at stations C D and E Assume that one and only one person is allowed at each station Assume that the times given for each station represent the amount of work that needs to be done at that station by that person with no processing time variation Assume that inventory is not allowed to build in the system A1 0 30 min A2 0 40 min B 0 70 min D 0 65 min 0 60 min Average hourly output E 0 55 min What is the average hourly output of the process when it is in normal operation Round your answer to the nearest whole number units

Statistics
StatisticsA firm is selling two products chairs and bar stools each at 75 per unit Chairs have a variable cost of 30 and bar stools 20 Fixed cost for the firm is 20 000 a If the sales mix is 1 1 one chair sold for every bar stool sold what is the break even point in dollars of sales In units of chairs and bar stools Round your unit answers to a whole number before calculating the breakeven point and round the break even point to the nearest whole number Answer is complete and correct Break even point Number of chairs Number of bar stools 30 000 200 200 b If the sales mix changes to 1 4 one chair sold for every four bar stools sold what is the break even point in dollars of sales In units of chairs and bar stools Round your unit answers to a whole number before calculating the breakeven point and round the break even point to the nearest whole number Break even point Number of chairs Number of bar stools Answer is complete but not entirely correct 32 920 x 76 380 x

Statistics
Statistics1 Complete the Venn diagram to represent the information given about the 250 student sponses i e represent each of the 16 labeled regions with the numerical value representing many Liked Subjects math T1 12 T4 rs 3 How many students liked only math 13 16 T10 Tg 9 T8 17 11 13 114 recess 2 How many students liked math gym and lunch but not recess Which region s of the Venn diagram represent the set of interest Region s 4 How many students did not like gym or lunch Region s gym 5 How many students liked math and gym but not recess Region s 6 How many students liked exactly two of the subjects Region s 7 How many of the students liked math or gym Region s 8 How many students liked math but not lunch Region s 12 115 lunch T16

Statistics
StatisticsInterpreting Box and Whisker Plots 1 Below are the prices of snowboards at two competing snowboard stores Middletown Snowboards 345 350 356 360 375 405 a Identify the 5 main statistics of each set of data Middletown Snowboards Snowboard Central 343 370 386 392 395 402 Snowboard Central b Draw a double box and whisker plot of the above data on the scale below 340 350 360 370 380 390 400 410 c What is the median price for a snowboard at Middletown Snowboards What is the lowest price you could pay for a snowboard at Snowboard Central What is the most expensive board at Middletown Snowboards What is the range of prices for snowboards at Snowboard Central Which price represents the 75th percentile for Middletown Snowboards nowboard from Why

Statistics
Statistics10 points The faculty senate at a large university wanted to know what proportion of the students thought foreign language classes should be required for everyone The statistics department offered to cooperate in conducting a survey and a simple random sample of 500 students was selected from all the students enrolled in statistics classes A survey form was sent by email to these 500 students True or false Since the sample is random it is representative of the population of interest A True B False Select one answer