Statistics Questions
The best high school and college tutors are just a click away, 24×7! Pick a subject, ask a question, and get a detailed, handwritten solution personalized for you in minutes. We cover Math, Physics, Chemistry & Biology.

Statistics
ProbabilitySuppose Joan has a fair four sided die with sides that are numbered 1 2 3 and 4 A 07 B C D 12 After she rolls it 33 times Joan finds that she s rolled the number 4 a total of seven times What is the empirical probability that Joan rolls a 4 33 25 21 21 Select one answer 10 points t

Statistics
ProbabilityA club is choosing 2 members to serve on a committee The club has nominated 2 women and 2 Type numbers in the boxes 10 points men Based on chance alone what is the probability no women are chosen to be on the committee Your answer should be rounded to 4 decimal places where applicable

Statistics
ProbabilitySelect one answer 10 points A 2000 study analyzed data from the National Longitudinal Study of Adolescent Health Participants were followed into adulthood Each study participant was categorized as to whether they were obese BMI 30 or not and whether they were dating cohabiting or married The researchers were trying to determine the effect of relationship status on obesity The table below summarizes the results Obese Not obese Total Dating Cohabiting Married Total 359 440 103 326 429 147 277 962 424 1 293 In this example which of the following would it be appropriate to calculate A Conditional row percentages B Conditional column percentages The correlation coefficient r D The five number summary of both variables

Statistics
StatisticsThe table below summarizes the results Obese Dating Cohabiting Married Total Total 81 Not obese 359 440 Obese 102 327 Total 429 148 23 8 Not obese Perc 2 276 424 Calculate the column conditional percentages for participants who were Cohabiting Important Input percentages and round to the nearest 1 decimal place Cohabiting 331 Total Perc 962 1293

Statistics
Statistics10 points High blood pressure is unhealthy Here are the results of one of the studies that link high blood Select one answer pressure to death from cardiovascular disease The researchers classified a group of white males aged 35 to 64 as having low blood pressure or high blood pressure then followed the subjects for 5 years The following two way table gives the results of the study Cardiovascular death Yes No Total Blood pressure High Low 21 2655 2676 55 3283 3338 In this example which of the following would be appropriate to calculate A Conditional row percentages B Conditional column percentages C The correlation coefficient r D The five number summary of both variables Total 76 5938 6014

Statistics
Statisticsthe median price for a snowboard at Middletown Snowboards What is the median score 1 70 2 75 1 6 2 8 5 5 What is the value of the third quartile shown on the box and whisker plot below 3 19 4 12 55 60 65 70 75 80 85 90 95 100 0 3 77 4 85 3 6 01 6 A movie theater recorded the number of tickets sold daily for a popular movie during the m June The box and whisker plot shown below represents the data for the number of ticke hundreds 4 3 2 5 6 Which conclusion can be made using this plot 1 The second quaile is 600 12 7 8 9 10 2 The mean of the attendance is 400 3 The range of the attendance is 300 to 600 4 Twenty five percent of the attendance is between 300 and 400

Statistics
Statistics10 points A person trying to gain access to a bank vault must pass through a series of three security doors If an attempt to pass through a door is a failure then the person will not make any further attempts Let P denote a successful pass and F denote a failed pass What is the sample space for this randor experiment A OS P PP PPP B OS F FP FFP FFF C OS F PF PPF PPP D S F PF PPF E S PPP FPP PFP PPF FFP FPF PFF FFF Select one answer

Statistics
ProbabilityA couple decides to have three children Let A define the event that the couple has at least 1 girl 10 points What are the possible outcomes for this event G girl B boy G BG BBG G GG GGG BBB BBG BGB GBB GGB GBG BGG GGG GGG GGB GBG BGG GBB BGB BBG Select one answer A B C D E GBB BGB BBG

Statistics
Statisticsapproximately normal in shape with a mean of 332 and a standard deviation of 28 According to the standard deviation rule almost 0 15 of the students spent more than what amount of money on textbooks in a semester Question 11 An instructor asked her students how much time to the nearest hour they spent studying for Select one answer the midterm The data are displayed in the following histogram 10 points 7 9 3 2 1 0 2 10 12 14 16 18 20 22 10 points What do the numbers on the vertical axis represent A The count of students falling in each of the intervals B The values of the numb
Statistics
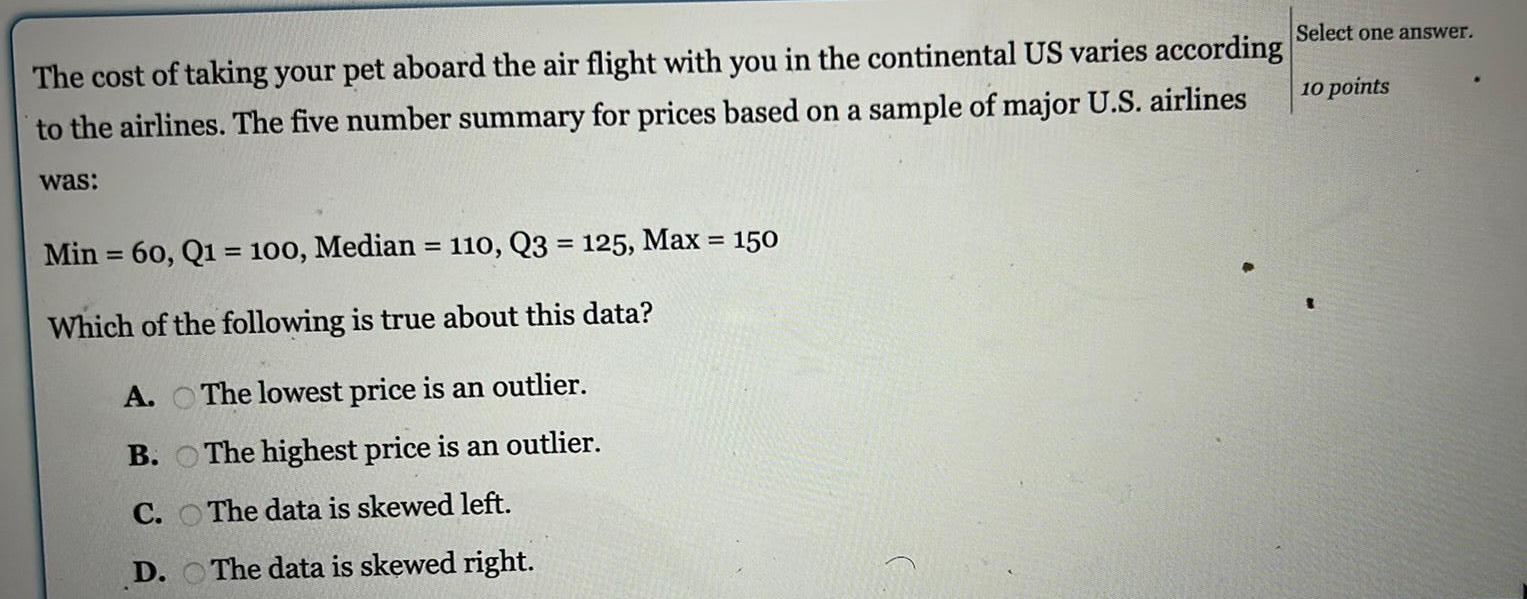
StatisticsThe cost of taking your pet aboard the air flight with you in the continental US varies according to the airlines The five number summary for prices based on a sample of major U S airlines was Min 60 Q1 100 Median 110 Q3 125 Max 150 Which of the following is true about this data The lowest price is an outlier The highest price is an outlier The data is skewed left The data is skewed right A B C D Select one answer 10 points

Statistics
StatisticsType numbers in the boxes 10 points The distribution of the amount of money spent by students on textbooks in a semester is approximately normal in shape with a mean of 332 and a standard deviation of 28 According to the standard deviation rule almost 0 15 of the students spent more than what amount of money on textbooks in a semester

Statistics
StatisticsA recent survey asks 95 students How many hours do you spend on the computer in a typical Type numbers in the boxes day aby Part 1 5 points ab Part 2 5 points 10 points Of the 95 respondents o said 1hour 3 said 2 hours 9 said 3 hours 15 said 4 hours 18 said 5 hours 22 said 6 hours 15 said 7 hours 9 said 8 hours 4 said 9 hours A In table format we have the following hours students o 3 4 3 9 15 18 6 22 8 15 9 4 What is the average mean number of hours spent on the computer Round your answer to one decimal point 4 8

Statistics
Statisticsapproximately normal in shape with a mean of 441 and a standard deviation of 29 According to the standard deviation rule approximately 95 of the students spent between on textbooks in a semester and Question 8 Part 1 5 points Part 2 5 points Question 9 10 points The distribution of IQ Intelligence Quotient is approximately normal in shape with a mean of Type numbers in the boxes 100 and a standard deviation of 13 10 points According to the standard deviation rule of people have an IQ between 61 and 139 Do not round The distribution of IQ Intelligence Quotient is approximately normal in shape with a mean of Type numbers in the boxes 100 and a standard deviation of 18 10 points
Statistics
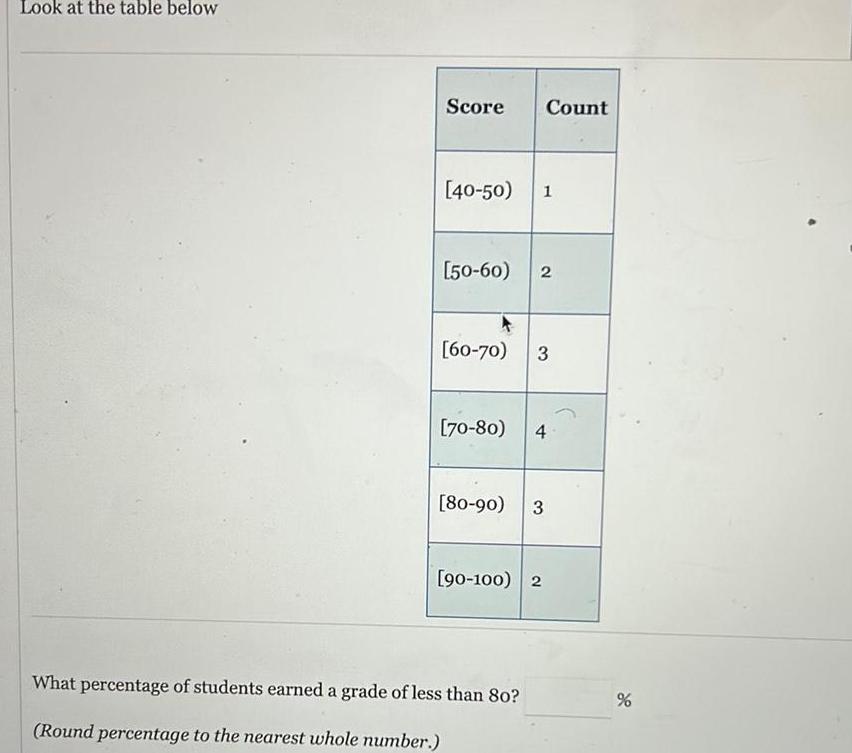
StatisticsLook at the table below Score Count 40 50 1 50 60 2 60 70 3 70 80 4 80 90 3 90 100 2 What percentage of students earned a grade of less than 80 Round percentage to the nearest whole number de

Statistics
StatisticsWhat is the next fraction in this sequence Simplify your answe 14 15 13 4 11 15 5 15 J
Statistics
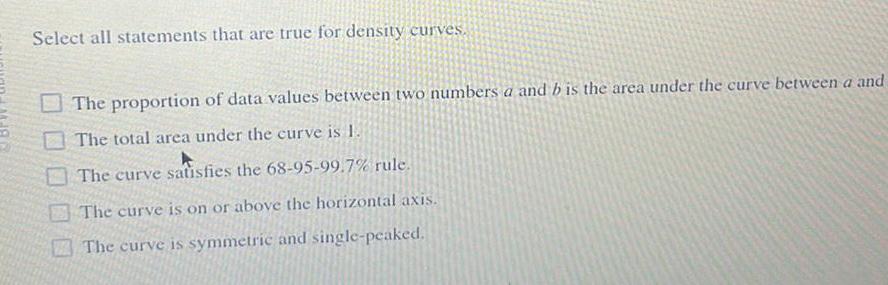
StatisticsSelect all statements that are true for density curves The proportion of data values between two numbers a and b is the area under the curve between a and The total area under the curve is 1 The curve satisfies the 68 95 99 7 rule The curve is on or above the horizontal axis The curve is symmetric and single peaked

Statistics
StatisticsFind a3 a 0 a 1 an an 1 an 2 Write your answer as an integer or fraction in simplest form a3 DO Submit

Statistics
StatisticsIn the data set below what is the variance 5 5 1 7 3 3 4 If the answer is a decimal round it to the nearest tenth variance 0 Submit

Statistics
StatisticsFind a2 and a3 a 14 an an 1 4 Write your answers as integers or fractions in simplest form a a3 Submit

Statistics
Statistics2 If an outlier is on the low side of the mean as in the example in the chapter could a one tailed table be used 3 If replicate measurements are made of a homogenous parent population the value of the sample standard devia tion and the population standard deviation will converge Why

Statistics
Statistics15 A store manager records the number of customers at the store each week for several years The data are approximately normally distributed with a mean of 1245 and a standard deviation of 35 The manager wants to predict future customer totals Using these data what percentage of weeks will have between 1280 and 1315 customers 07
Statistics
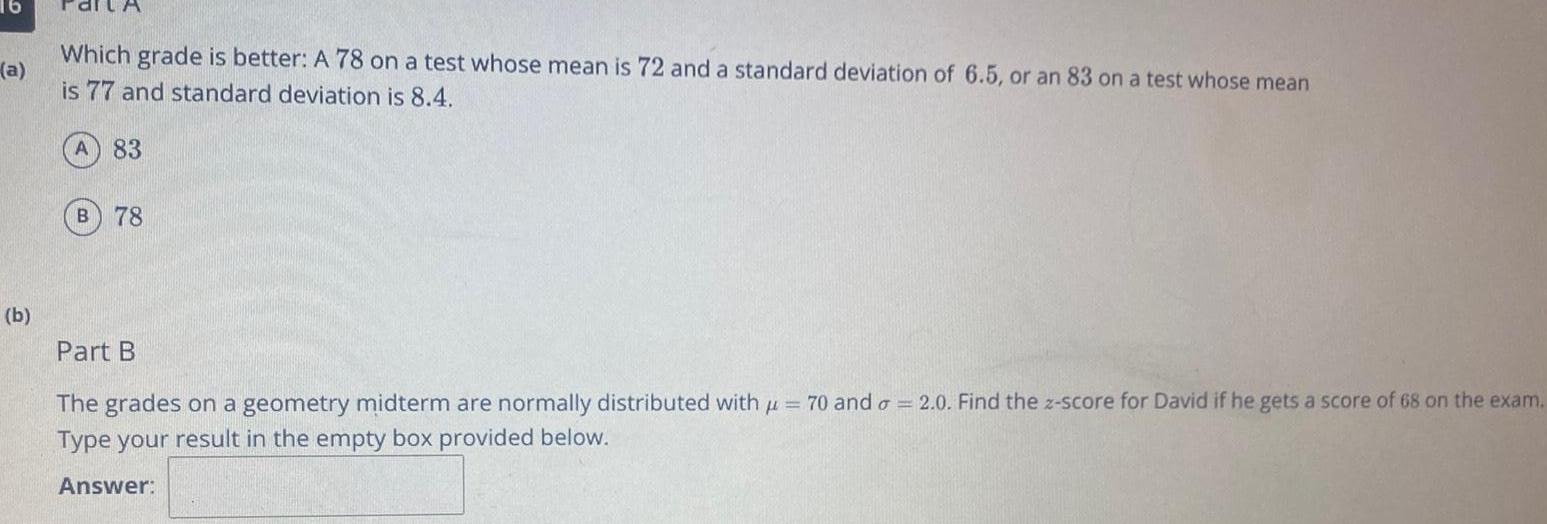
Statistics16 a b Which grade is better A 78 on a test whose mean is 72 and a standard deviation of 6 5 or an 83 on a test whose mean is 77 and standard deviation is 8 4 A 83 B 78 Part B The grades on a geometry midterm are normally distributed with 70 and a 2 0 Find the z score for David if he gets a score of 68 on the exam Type your result in the empty box provided below Answer

Statistics
Statistics17 The grades on a statistics mid term are normally distributed with 81 and o 6 3 Calculate the z scores for each of the following exam grades given in the first column and match them with their appropriate result 65 83 93 100 DRAG DROP THE ANSWER 1 90 2 53 0 31 3 01

Statistics
Statistics0 a b IQ scores of people from around the world are normally distributed with a mean of 100 and a standard deviation of 15 A genius is someone with an IQ greater than or equal to 140 What percent of the population is considered genius Based on that percentage about how many people on school campus would you think have IQ s of 140 and above There are approximately 300 people on campus BiU x XA E

Statistics
StatisticsKimi surveyed the 7 women at a restaurant Is this sample of the restaurant s customers likely to be biased A True B False

Statistics
StatisticsThe mean price of computers sold at a particular store is 949 with a standard deviation of 75 The z score of a certain computer is 0 8 What is the price of the computer dollars

Statistics
StatisticsUsing a graphing calculator estimate the area under the standard normal curve between z 2 and z 1 3 Round your answer to four decimal places A 0 0741 B 0 6166 0 8804 0 1196

Statistics
Statistics7 The accompanying box and whisker plots can be used to compare the annual incomes of three professions Profession Nuclear engineer Police officer Musician 20 40 60 80 100 120 140 Annual Income thousands of dollars Based on the box and whisker plots which statement is true 1 The median income for nuclear engineers is greater than the incoine of all musicians W 2 The median income for police officers and musicians is the same 3 All nuclear engineers earn more than all police officers 4 A musician will eventually earn more than a police officer

Statistics
Statistics10 Jorge made the accompanying stem and leaf wrestling team he was caching Stem Leaf 10 11 12 18 14 15 What is the mode of the weights 3 152 4 168 1 145 2 150 1 4 3 1 01

Statistics
Statistics9 The accompanying sten and leaf plot represents Ben s test scores this year 6 7 8 9 1 73 2 79 5 2 1 6 8 3 3 3 3 99 3 3 9 6 7 Key 7 2 72 What is the median score for this set of data 3 80 4 81

Statistics
StatisticsUUU Real income per person Access to and quality of health care Access to and quality of education The list shows things which aro E Q calculating which of the following The Gross National Product of country C The Consumer Price Index of a country The standard of living in a country The development level of a country

Statistics
Statistics6 A toxicology laboratory associated with a state medical examiner s office purchases a new type of extraction sys tem with the hope of improving on its current method of screening for fentanyl in postmortem blood samples T validate the change lab analysts run 20 samples using the older extraction method and the same 20 samples usin the new method results given in g L The laboratory director asks Is this new method more reproducible tha the old method You elect to use a hypothesis test to answer the question specifically the F test Use online c other resources to learn about the F test and apply it to the question at hand Explain why the F test works wha your null hypothesis is and whether the data support rejecting or accepting the null hypothesis at the 95 leve p 0 05 Is the new method better in terms of reproducibility Old method Bac 3 77 3 81 3 77 3 85 3 77 3 80 3 71 3 82 3 76 3 76 New method 3 49 3 85 3 54 Con 3 63 3 60 RET PET 5 3 65 3 70 3 52 3 91 3 58 7 Why can there never be a true value Old method 3 76 3 90 3 74 3 86 3 79 3 82 3 88 3 82 3 87 3 74 New method 3 78 3 96 3 81 3 53 3 87 3 67 3 71 3 95 3 69 3 50 1
Statistics
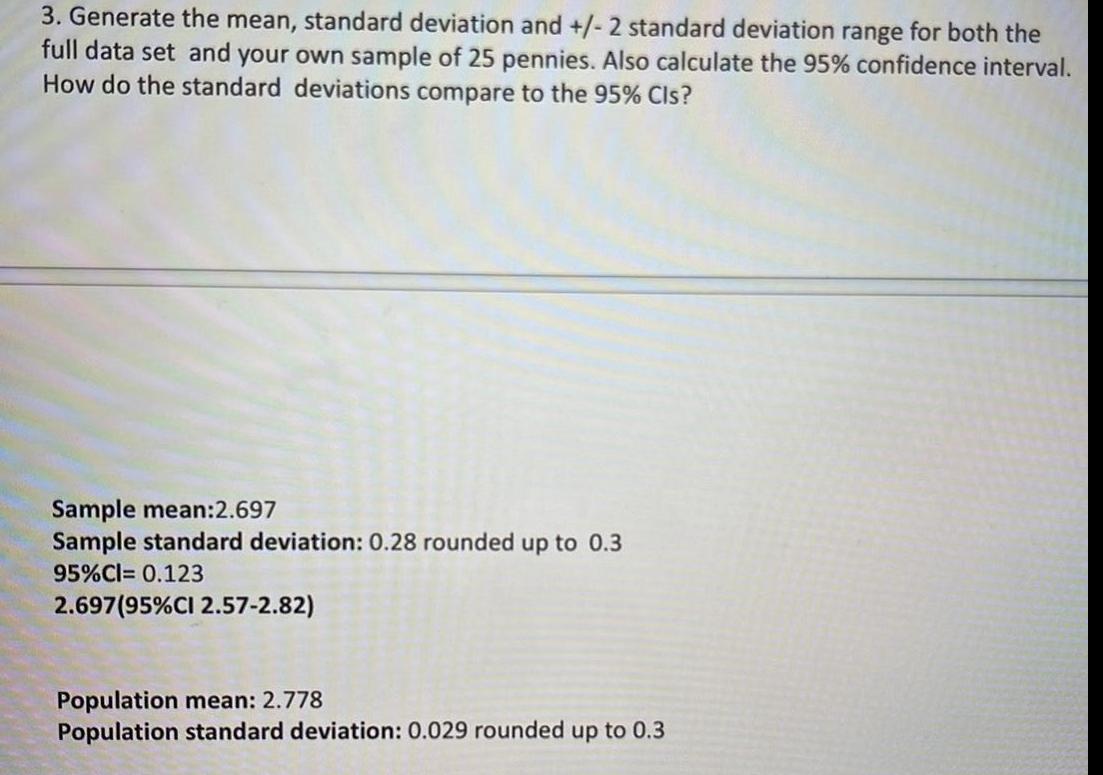
Statistics3 Generate the mean standard deviation and 2 standard deviation range for both the full data set and your own sample of 25 pennies Also calculate the 95 confidence interval How do the standard deviations compare to the 95 Cls Sample mean 2 697 Sample standard deviation 0 28 rounded up to 0 3 95 CI 0 123 2 697 95 CI 2 57 2 82 Population mean 2 778 Population standard deviation 0 029 rounded up to 0 3

Statistics
Statistics2 Calculate summary statistics for the 25 pennies you weighed and focus on the sample standard deviation How does it compare to the standard deviation of the population Sample standard deviation 0 28 rounded up to 0 3 Population standard deviation 0 029 rounded up to 0 3

Statistics
StatisticsThe train arrived early early tells us more about the verb arrived John is a very intelligent boy very tells us more about the adjective intelligent He came here almost silently almost tells us more about the adverb silently Kinds of Adverbs There are four kinds of adverbs Adverbs of Manner Adverbs of Time Adverbs of Frequency and Adverbs of Place 1 Adverbs of Manner Adverbs of Manner tell us how actions are done David was talking politely The soldier fought bravely He comes to me rarely She does her work carelessly about the verbs adjectives or other adverbs in a sentence 2 Adverbs of Time The adverbs that show the time of the actions are called the Adverbs of Time He takes a bath daily wisely slowly badly She never comes to me We are moving to Kolkata soon The aeroplane was late by two hours ago now More Adverbs of Manner quietly foolishly sadly fairly clearly soundly seldom hardly More Adverbs of Time today tonight nowadays formerly 3 Adverbs of Frequency The adverbs that show how often actions take place are called Adverbs of Frequency Sam always speaks the truth Tony goes to the temple thrice a week Antony often smiles these days properly swiftly surely before lately More Adverbs of Frequency never again sometimes frequently ever

Statistics
StatisticsFind the percentile for the data point Data set 119 131 123 117 125 127 117 115 122 119 123 133 115 119 121 116 data point 125 O 85 O 62 O 75 070

Statistics
StatisticsAs people age daily stress and worry decrease and happiness increases according to an analysis of 340 847 adults ages 18 to 85 in a certain country The graphs show a portion of the research Complete parts a and b below Percentage Reporting Stress 60 50 40 30 20 10 22 Age 62 Percentage Reporting Stress A 60 50 40 30 20 10 0 of 1 22 36 62 22 15 30 45 60 75 Age a Find the slope of the line passing through the two points shown in the line graph Express the slope as a decimal Round to one decimal place as needed b Use the answer from part a to complete the statement For each year of aging the percentage of Americans reporting a lot of stress decreases by The rate of change is value of m year of aging age group percentage of stre per year of aging

Statistics
StatisticsSolve the problem Round results to the nearest hundredth The mean of a set of data is 121 54 and its standard deviation is 117 87 Find the z score for a value of 412 92 2 72 O 2 22 O 2 77 2 47

Statistics
StatisticsFind the standard deviation of the data summarized in the given frequency table The test scores of 40 students are summarized in the frequency table below Find the standard deviation Score 50 59 60 69 70 79 80 89 90 99 Os 12 9 Os 14 3 Os 12 2 Students 5 5 8 11 11
Statistics
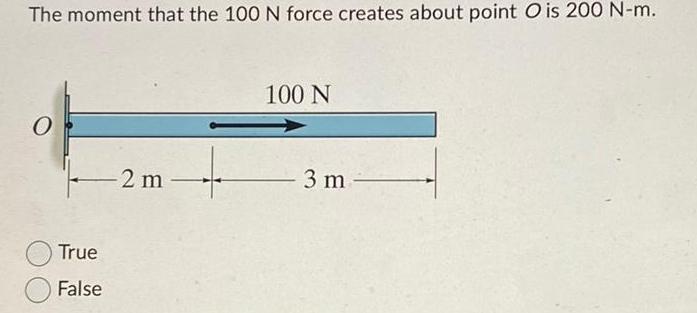
StatisticsThe moment that the 100 N force creates about point O is 200 N m O True False 2 m 100 N 3 m
Statistics
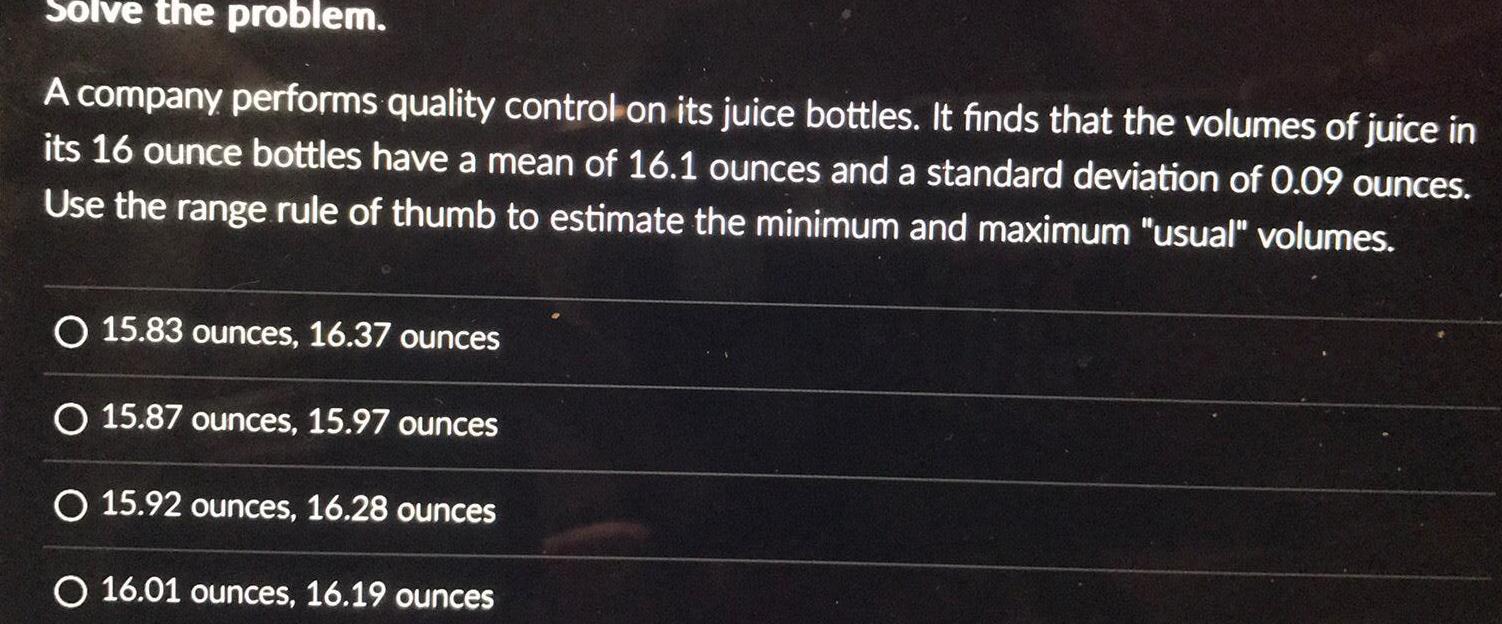
StatisticsSolve the problem A company performs quality control on its juice bottles It finds that the volumes of juice in its 16 ounce bottles have a mean of 16 1 ounces and a standard deviation of 0 09 ounces Use the range rule of thumb to estimate the minimum and maximum usual volumes O 15 83 ounces 16 37 ounces O 15 87 ounces 15 97 ounces O 15 92 ounces 16 28 ounces O 16 01 ounces 16 19 ounces

Statistics
StatisticsFind the indicated percentile decile or quartile The test scores of 32 students are listed below Find P46 32 37 41 44 46 48 53 55 56 57 59 63 65 66 68 69 70 71 74 74 75 77 78 79 80 82 83 86 89 92 95 99 O 14 72 O 67 O 68

Statistics
StatisticsFind the z score corresponding to the given value and use the z score to determine whether the value is unusual Consider a score to be unusual if its z score is less than 2 00 or greater than 2 00 Round the z score to the nearest tenth if necessary A body temperature of 96 5 F given that human body temperatures have a mean of 98 20 F and a standard deviation of 0 62 12 O 1 7 not ususal O 2 7 unusual O 2 7 unusual O 2 7 not unusual

Statistics
StatisticsUse the empirical rule to solve the problem The systolic blood pressure of 18 year old women is normally distributed with a mean of 120 mmHg and a standard deviation of 12 mmHg What percentage of 18 year old women have a systolic blood pressure between 96 mmHg and 144 mmHg O 99 74 O 68 26 O 95 44 O 99 99

Statistics
StatisticsThe following is a set of data showing the water temperature in a heated tub at different time intervals Use the range rule of thumb to find the standard deviation Round results to the nearest tenth 114 8 115 7 116 7 113 6 113 9 113 7 112 7 113 2 O 1 0 O 0 8 O 55 9 O 1 3
Statistics
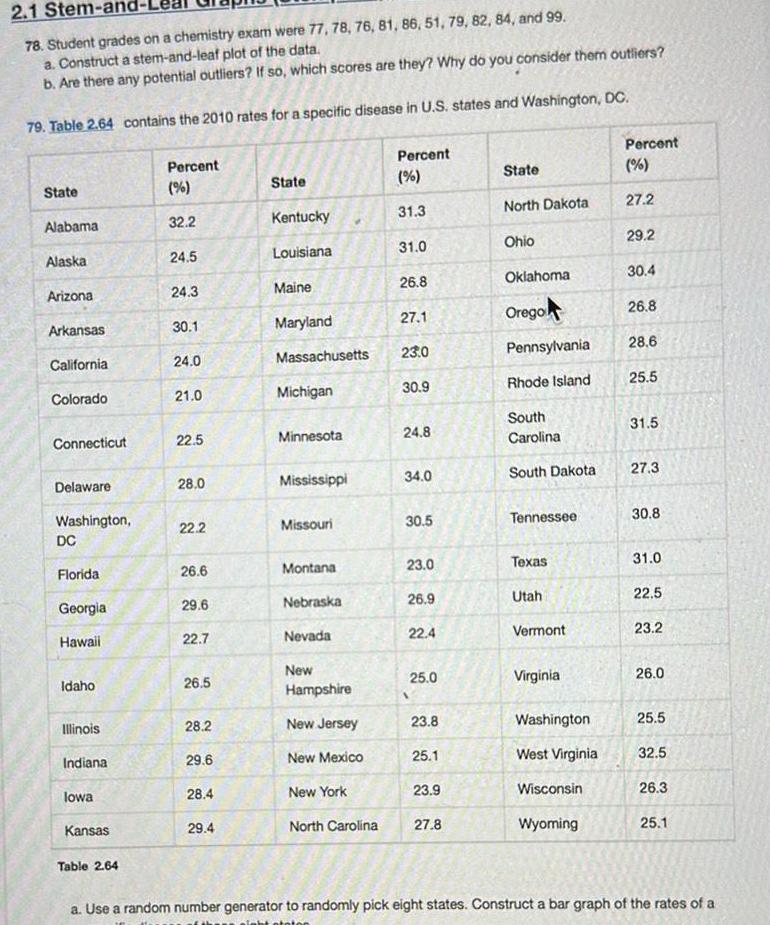
Statistics2 1 Stem a 78 Student grades on a chemistry exam were 77 78 76 81 86 51 79 82 84 and 99 a Construct a stem and leaf plot of the data b Are there any potential outliers If so which scores are they Why do you consider them outliers 79 Table 2 64 contains the 2010 rates for a specific disease in U S states and Washington DC State Alabama Alaska Arizona Arkansas California Colorado Connecticut Delaware Washington DC Florida Georgia Hawaii Idaho Illinois Indiana lowa Kansas Table 2 64 Percent 32 2 24 5 24 3 30 1 24 0 21 0 22 5 28 0 22 2 26 6 29 6 22 7 26 5 28 2 29 6 28 4 29 4 State Kentucky Louisiana Maine Maryland Massachusetts Michigan Minnesota Mississippi Missouri Montana Nebraska Nevada New Hampshire New Jersey New Mexico New York North Carolina Percent 31 3 31 0 26 8 27 1 23 0 30 9 24 8 34 0 30 5 23 0 26 9 22 4 25 0 A 23 8 25 1 23 9 27 8 State North Dakota Ohio Oklahoma Orego Pennsylvania Rhode Island South Carolina South Dakota Tennessee Texas Utah Vermont Virginia Washington West Virginia Wisconsin Wyoming Percent 27 2 29 2 30 4 26 8 28 6 25 5 31 5 27 3 30 8 31 0 22 5 23 2 26 0 25 5 32 5 26 3 25 1 a Use a random number generator to randomly pick eight states Construct a bar graph of the rates of a jght staten
Statistics
ProbabilityWhen a plumber is called the cost of the service call is 30 00 for them to show up at your house plus an additional 30 00 per hour Create a linear function that inputs the time spent working by the plumber and outputs the total cost for the work f Use your linear equation to predict the total cost of the service call if the plumber works for 3 hours a Select the value that corresponds to the independent variable x O Hours the plumber is at your house Cost for the plumber to come to your house Total cost of hiring the plumber b Select the value that corresponds to the dependent variable y O Hours the plumber is at your house O Cost for the plumber to come to your house Total cost of hiring the plumber c Write the equation that represents this scenario Enter your answer in slope intercept form Equation

Statistics
Statistics4 A manufacturing company is reviewing the salaries of its full time employees below the executive level at a large plant The following histograms display the distribution of salary for male and female employees Men Women Percent of men 35 30 30 40 50 60 70 Percent of women 35 30 25 20 15 10 30 40 50 60 70 Salary 1000 Salary 1000 a There are 756 female employees and 2451 male employees at the plant Why did we use percents rather than counts on the vertical axis of these graphs

Statistics
Statistics5 The histogram shows the distribution of age for runners in the Brooklyn New York half marathon in 201 Explain what is wrong with this histogram Percent DS 12 20 25 30 35 40 45 50 55 60 70 80 Age

Statistics
ProbabilityThere are 710 identical plastic chips numbered 1 through 710 in a box What is the probability of reaching into the box and randomly drawing the chip numbered 568 Express your answer as a simplified fraction or a decimal rounded to four decimal places Answer How to enter your answer opens in new window 2 Points Keypad Keyboard Shortcuts