Statistics Questions
The best high school and college tutors are just a click away, 24×7! Pick a subject, ask a question, and get a detailed, handwritten solution personalized for you in minutes. We cover Math, Physics, Chemistry & Biology.

Statistics
Statistics1 Here are the lengths in minutes of the 50 most popular mp3 downloads of songs by country artist Die Bentley 4 2 4 0 3 9 3 8 3 7 4 7 3 4 4 0 4 4 5 0 4 6 3 7 4 6 4 4 4 1 3 0 3 2 4 7 3 5 3 7 4 3 3 7 4 8 4 4 4 2 4 7 6 2 4 0 7 0 3 9 3 4 3 4 2 9 3 3 4 0 4 2 3 2 3 4 3 7 3 5 3 4 3 7 3 9 3 7 3 8 3 1 3 7 3 6 4 5 3 7 a Make a histogram that displays the distribution of song lengths effectively

Statistics
Statistics94 Twenty five randomly selected students were asked the number of movies they watched the previous week The results are as follows Number of Movies 0 1 2 3 4 Table 2 73 Frequency 5 9 6 4 1 Construct a box plot of the data 2 5 Measures of the Center of the Data 95 Scientists are studying a particular disease They found that countries that have the highest rates of people who have ever been diagnosed with this disease range from 11 4 percent to 74 6 percent Countries

Statistics
Statistics101 What percentage of the FIES 102 What is the IQR What does the IQR represent 103 How many standard deviations away from the mean is the median Additional Information The population FTES for 2005 2006 through 2010 2011 was given in an updated report The data are reported here Year Total FTES 2005 2006 1 585 2006 2007 1 690 2007 2008 1 735 2008 2009 1 935 2009 2010 2 021 2010 2011 1 890

Statistics
Statistics2 4 Box Plots 90 In a survey of 20 year olds in China Germany and the United States people were asked the number of foreign countries they had visited in their lifetime The following box plots display the results 0 China Germany United States 1 Figure 2 45 2 3 4 6 7 8 9 10 11 a In complete sentences describe what the shape of each box plot implies about the distribution of the data collected b Have more Americans or more Germans surveyed been to more than eight foreign countries What do they imply about the foreign travel of 20 year old residents of the

Statistics
Statistics93 A survey was conducted of 130 purchasers of new black sports cars 130 purchasers of new red sports cars and 130 purchasers of new white sports cars In it people were asked the age they were when they purchased their car The following box plots display the results 25 Black sports cars Red sports cars White sports cars 30 Figure 2 48 35 40 45 i 31 35 ii 38 41 iii 41 64 50 55 60 65 70 75 80 a In complete sentences describe what the shape of each box plot implies about the distribution of the data collected for that car series b Which group is most likely to have an outlier Explain how you determined that c Compare the three box plots What do they imply about the age of purchasing a sports car from the series when compared to each other d Look at the red sports cars Which quarter has the smallest spread of data What is the spread e Look at the red sports cars Which quarter has the largest spread of data What is the spread f Look at the red sports cars Estimate the interquartile range IQR g Look at the red sports cars Are there more data in the interval 31 38 or in the interval 45 55 How do you know this h Look at the red sports cars Which interval has the fewest data in it How do you know this 94 Twenty five randomly selected students were asked the number of movies they watched the previous week The results are as follows

Statistics
Statistics91 Given the following box plot answer the questions 20 Figure 2 46 100 150 a Think of an example in words where the data might fit into the above box plot In two to five sente write down the example h What does it mean to have the first and second quartiles so close together while the second to th

Statistics
Statistics88 Given the following box plot answer the questions Figure 2 43 2 a Which quarter has the smallest spread of data What is that spread b Which quarter has the largest spread of data What is that spread c Find the interquartile range QR d Are there more data in the interval 5 10 or in the interval 10 13 How do you know this e Which interval has the fewest data in it How do you know this 1 0 2 II 2 4 ill 10 12 iv 12 13 20 information

Statistics
Statistics80 Suppose that three book publishers were interested in the number of fiction paperbacks adult consumers purchase per month Each publisher conducted a survey In the survey adult consumers were asked the number of fiction paperbacks they had purchased the previous month The results are as follows Number of Books 0 1 2 3 4 5 6 8 Table 2 65 Publisher A Number of Books 0 Frequency 10 12 16 12 8 6 2 2 Frequency 18 24 Relative Frequency Relative Frequency

Statistics
Statistics74 Find the value that is one standard deviation below the mean 75 Two baseball players Fredo and Karl on different teams wanted to find out who had the higher batting average when compared to his team Which baseball player had the higher batting average when compared to his team Baseball Player Fredo Karl Table 2 60 Batting Average 158 177 Team Batting Average 166 189 in throp standard deviations Team Standard Deviation 012 015

Statistics
ProbabilityUse the following information to answer the next two exercises Suppose 111 people who shopped in a special T shirt store were asked the number of T shirts they own costing more than 19 each Relative frequency 40 111 30 111 20 111 10 111 0 5 111 17 111 23 111 39 111 25 111 2 111 1 2 3 4 5 6 7 Number of T shirts costing more than 19 each 83 The percentage of people who own at most three T shirts costing more than 19 each is approximately a 21 b 59 c 41 d cannot be determined

Statistics
Statistics3 What type of study is the researcher conducting A poll was given to every 5th attendee at a football game asking if they would rather have hot chocolate or coffee 62 of those polled would rather have hot chocolate A cluster B stratified C self selected D systematic

Statistics
Statistics1 The following table shows number of hours students expect to spend weekly on statistics including 3 class hours Note that some intervals with zero frequency were omitted X Expected Hours 49 50 19 20 17 18 15 16 13 14 11 12 9 10 7 8 5 6 3 4 1 2 a Is the variable discrete or continuous Is it nominal ordinal interval or ratio Briefly explain your answers f 2 4 0 3 2 6 50 79 173 51 4 374

Statistics
Statisticsnumber of accidents occurring on that road in January speed limit of a certain road and the Posted Speed Limit Reported Number of Accidents 28 26 0 350 1 Find the slope of the regression line predicting the number of accidents from the posted speed limit Round to 3 decimal places 60 49 43 6 978 39 21 23 22 18 19 11 2 Find the intercept of the regression line predicting the number of accidents from the posted speed limit Round to 3 decimal places 1 3 Predict the number of reported accidents for a posted speed limit of 27 mph Do not round the slope and intercept in doing the calculation Round to the nearest whole number

Statistics
Probability130037 d A smaller sample of 15 students yielded the following data 5 4 7 6 8 1 6 6 5 3 8 10 10 19 50 Use a class interval of 1 to calculate the mean range and standard deviation and compare to values of the large sample How much do the extreme scores affect the larger sample compared to the smaller sample

Statistics
StatisticsCHOL 800 600 400 200 100 150 WT 200 250 The outlier on the graph is likely due to an error in recording the data Which of the following statements is true If the weight WT were measured in kilograms instead of pounds 1 lb 0 4536 kg the value of r would change accordingly If the outlier were removed the correlation coefficient r would increase A reasonable value of the correlation coefficient r for these data is 1 2 If the outlier were removed the correlation coefficient r would decrease

Statistics
ProbabilityThe distribution of the amount of money spent by students on textbooks in a semester is approximately normal in shape with a mean of 374 and a standard deviation of 32 According to the standard deviation rule almost 2 5 of the students spent more than what amount of money on textbooks in a semester Your Answer

Statistics
StatisticsHow many ways can Carlos choose 2 pizza toppings from a menu of 4 toppings if each topping can only be chosen once AnswerHow to ente your answer innens in new window 2 Points

Statistics
ProbabilityA veggie wrap at City Subs is composed of 4 different vegetables and 2 different condiments wrapped up in a tortilla If there are 7 vegetables 5 condiments and 6 types of tortilla available how many different veggie wraps can be made Answer How to enter your answer opens in new window Tables Keypad Keyboard Shortcut

Statistics
ProbabilityBen wants to buy a new collar for each of his 5 dogs The collars come in a choice of 9 different colors Step 1 of 2 How many selections of collars for the 5 dogs are possible if repetitions of colors are allowed Answer How to enter your answer opens in new window

Statistics
ProbabilityGarcia s Grill offers 8 side dishes 3 types of steak and 7 toppings How many different smothered steak dinners can be made if a smothered steak dinner consists of the customer s choice of steak served with 2 different toppings and 4 different side dishes Answer How to enter your answer opens in new window Tables Kavho E Keypad tout

Statistics
StatisticsApplication 1 5 How old are U S Presidents The table below gives the ages of the first 44 U S presidents when they took office President Age Washington 57 J Adams Jefferson Madison Monroe J Q Adams Jackson Van Buren Polk Taylor Fillmore Pierce Buchanan 61 Name 57 57 W H Harrison 68 Tyler 58 57 61 54 51 49 64 50 48 65 President Lincoln A Johnson Grant Hayes Garfield Arthur Cleveland B Harrison Cleveland McKinley T Roosevelt Taft Wilson Harding Coolidge Age 52 56 46 54 49 51 47 55 55 54 42 51 56 55 51 President Hoover F D Roosevelt 51 Truman Eisenhower Kennedy L B Johnson Nixon Ford Carter Reagan G H W Bush Clinton G W Bush Age 54 Hour 60 61 43 55 56 61 52 69 64 46 54 Date STATS MI 1 Make a frequency histogram of the data using intervals of width 4 starting at age 40 CLASS FREQ

Statistics
ProbabilityAn urn contains 10 red marbles 28 blue marbles and 29 yellow marbles One marble is to be chosen from the urn without looking What is the probability of choosing a red marble Your answer should be to rounded to 4 decimal places

Statistics
ProbabilityConsider the following X 22 50 69 100 106 Y 213 224 176 129 102 1 What is the slope of the regression line predicting Y from X rounded to 2 decimal

Statistics
StatisticsBrett is planning a banquet for 125 guests He needs to select 4 appetizers 4 entrees and 2 side dishes Carson s Catering has 18 appetizers 12 entrees and 14 side dishes to choose from How many different ways are there for Brett to plan the menu Answer Tables Keypa

Statistics
Statistics4 78 Refer to Exercise 4 77 Describe the sampling distribution for the sample sum Ey Is it unlikely improbable that Ey would be more than 70 units away from 960 Explain 4 79 Psychomotor retardation scores for a particular group of manic depressive patients have approximately a normal distribution with a mean of 930 and a standard deviation of 130 A ran dom sample of 20 patients from the group was selected and their mean psychomotor retardation score was obtained a What is the probability that their mean score was between 900 and 960 b What is the probability that their mean score was greater than 960 C What is the 90th percentile of their mean scores

Statistics
Statistics4 47 Knee replacements have emerged as a mainstream surgery According to the Knee Replacement Statistics Agency of Research and Quality AHRQ over 600 000 procedures were per formed in 2009 and the number is expected to grow into the millions by the year 2030 According to the American Academy of Orthopedic Surgeons AAOS serious complications occur in less than 2 of cases If AAOS is correct that only 2 of knee replacement patients have serious com plications would the next 10 patients at a major teaching hospital receiving a knee replacement constitute a binomial experiment with n 10 and 02 Justify your answer

Statistics
Statistics4 45 In an attempt to decrease drunk driving police set up vehicle checkpoints during the July 4 evening The police randomly select vehicles to be stopped for informational checks On a particular roadway assume that 20 of all drivers have a blood alcohol level above the legal limit For a random sample of 15 vehicles compute the following probabilities a All 15 drivers will have a blood alcohol level exceeding the legal limit b Exactly 6 of the 15 drivers will exceed the legal limit c Of the 15 drivers 6 or more will exceed the legal limit d All 15 drivers will have a blood alcohol level within the legal limit

Statistics
StatisticsIn Exercises 4 57 through 4 63 let z be a random variable with a standard normal distribution Basic 4 57 Find the probability that z is less than 1 23 Basic 4 58 Find the probability that z is greater than 0 35 Basic 4 59 Find the value of z denoted zo such that P Z Zo 5 Basic 4 60 Find the value of z denoted zo such that P z Zo 025

Statistics
Statistics4 77 A random sample of 16 measurements is drawn from a population with a mean of 60 and a standard deviation of 5 Describe the sampling distribution of y the sample mean Within what interval would you expect y to lie approximately 95 of the time

Statistics
Statistics4 49 Suppose the random Variable Y has a Poisson distribution Compute the following Probabilities a P y 4 given 2 b P Y 4 given M 3 5 C P Y74 given M 2 d PC12Y 24 given M 2

Statistics
Statistics4 35 Conditional probabilities can be useful in diagnosing disease Suppose that three differ ent closely related diseases A1 A2 and A3 occur in 25 15 and 12 of the population In addition suppose that any one of three mutually exclusive symptom states B B2 and B3 may be associated with each of these diseases Experience shows that the likelihood P BA of hav ing a given symptom state when the disease is present is as shown in the following table Find the probability of disease A2 given symptoms B B2 B3 and B4 respectively Symptom State Bj B B B3 B4 no symptoms Disease State A A 08 18 06 68 A2 17 12 07 64 A3 10 14 08 68

Statistics
Statistics4 67 Suppose that z is a random variable having a standard normal distribution a Find a value zo such that P z zo 01 b Find a value zo such that P z zo 025 c Find a value zo such that P zo z zo 95 4 68 Let y be a random variable having a normal distribution with mean equal to 250 and standard deviation equal to 50 a Find a value yo such that P y yo 01 b Find a value yo such that P y yo 025 C Find two values v and v such that v 2 250 and P v 95

Statistics
StatisticsBasic 4 53 Find the area under the standard normal curve between these values a z 0 and z 1 3 b z 0 and z 2 7 Basic 4 54 Find the area under the standard normal curve between these values a z 5 and z 1 3 b z 1 3 and z 0 Basic 4 55 Find the area under the standard normal curve between these values a z 2 5 and z 1 2 b 7 13 and 7 7 7

Statistics
Statistics4 41 A traditional call center has a simple mission Agents have to answer customer calls fast and end them as quickly as possible to move on to the next call The quality of service rendered by the call center was evaluated by recording the number of times a customer called the center back within a week of his or her initial call to the center y number of recalls P y 01 2 3 4 5 151 232 354 161 067 021 6 014 a What is the probability that a customer will recall the center more than three times b What is the probability that a customer will recall the center at least two times but less than five times c Suppose a call center must notify a supervisor if a customer recalls the center more than four times within a week of his or her initial call What proportion of customers who contact the call center will require a supervisor to be contacted

Statistics
Probability4 29 Of a finance company s loans 1 are defaulted not completely repaid The company routinely runs credit checks on all loan applicants It finds that 30 of defaulted loans went to poor risks 40 to fair risks and 30 to good risks Of the nondefaulted loans 10 went to poor risks 40 to fair risks and 50 to good risks Use Bayes Formula to calculate the probability that a poor risk loan will be defaulted

Statistics
Statistics4 36 Classify each of the following random variables as either continuous or discrete a The survival time of a cancer patient after receiving a new treatment for cancer b The number of ticks found on a cow entering an inspection station c The average rainfall during August in College Station Texas d The daily dose level of medication prescribed to a patient having an iron deficiency e The number of touchdowns thrown during an NFL game f The number of monthly shutdowns of the sewage treatment plant in a large
Statistics
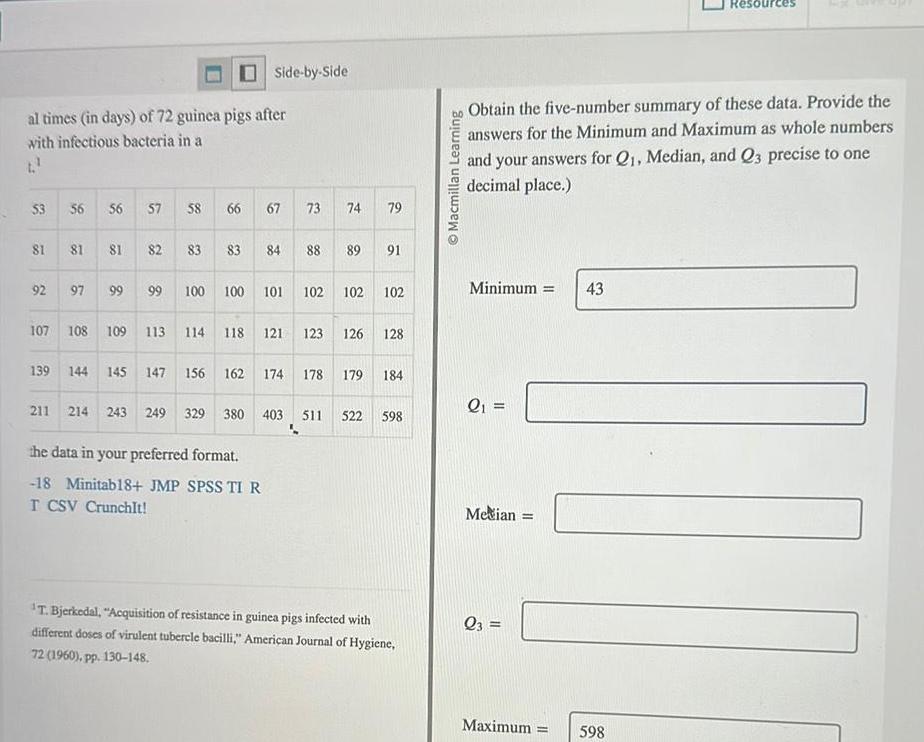
Statisticsal times in days of 72 guinea pigs after with infectious bacteria in a 53 81 92 107 139 56 56 Side by Side 57 58 66 67 81 81 82 83 73 74 79 83 84 88 89 91 97 99 99 100 100 101 102 102 102 108 109 113 114 118 121 123 126 128 the data in your preferred format 18 Minitab18 JMP SPSS TI R T CSV CrunchIt 144 145 147 156 162 174 178 179 184 211 214 243 249 329 380 403 511 522 598 T Bjerkedal Acquisition of resistance in guinea pigs infected with different doses of virulent tubercle bacilli American Journal of Hygiene 72 1960 pp 130 148 Macmillan Learning Obtain the five number summary of these data Provide the answers for the Minimum and Maximum as whole numbers and your answers for Q1 Median and Q3 precise to one decimal place Minimum Q Metian Q3 Maximum 43 Resources 598

Statistics
Statistics4 44 A survey is conducted to estimate the percentage of pine trees in a forest that are infected by the pine shoot moth A grid is placed over a map of the forest dividing the area into 25 foot by 25 foot square sections One hundred of the squares are randomly selected and the number of infected trees is recorded for each square Is this a binomial experiment

Statistics
Statisticscmillan Learning Oil Stacked Ratio 5 33 0 20 0 13 0 38 2 16 2 50 0 06 2 00 Shortening household 0 11 Shortening industrial 0 06 Perilla Walnut Wheat germ Mustard Sardine Salmon Mayonnaise Cod liver Oil 09640 Margarine Olive Shea nut Sunflower oleic Sunflower linoleic Flaxseed Canola Soybean Grape seed Menhaden Calculate the mean Round your answer to four decimal places Ratio 0 05 0 08 0 06 0 05 0 00 3 56 0 46 0 13 0 00 1 96 Oil Resources Herring Click to download the data in your preferred format Excel Minitab14 18 Minitab 18 JMP SPSS TI R Mac TXT PC TXT CSV CrunchIt Soybean hydrogenated Rice bran Butter Sunflower Corn Sesame Cottonseed Palm Cocoa butter Ex Give Up Ratio 2 67 0 07 0 05 0 64 0 03 0 01 0 01 0 00 0 02 0 04

Statistics
StatisticsMacmillan Learning wwww e Data A Data B SA Stacked 7 66 Incorrect www To access the complete data set click the link for your preferred software format Excel Minitab14 18 Minitab18 JMP SPSS TI R Mac TXT PC TXT CSV CrunchIt What is the mean of data set A Enter your answer rounded to three decimal places 9 14 8 14 8 74 8 77 9 26 8 10 6 13 3 10 9 13 7 26 6 58 5 76 7 71 8 84 8 47 7 04 5 25 5 56 7 91 6 89 12 50 incorrect un pe 1 90034 What is the standard deviation for data set A Enter your answer rounded to three decimal places 4 74 What is the mean of data set B Enter your answer rounded to three decimal places

Statistics
StatisticsSide by Side The dotplot displays the distribution of the percents of individuals younger than age 18 in each of the 50 states and the District of Columbia Note that the values in the dotplot are reported in increments of 0 5 percentage points Pont of the state population under 18 years of age Macmillan Learning Give the five number summary of this distribution Provide your answers precise to one decimal place Min Q 11 M Q3

Statistics
StatisticsA study of freely forming groups in bars throughout Europe examined the number of individuals found in groups whose members were laughing together The study reported on a total of 501 laughing groups distributed as follows Number of individuals in 2 3 4 5 6 Side by Side group Number of groups 254 168 52 216 G Dezecache and R I M Dunbar Sharing the joke the size of natural laughter groups Evolution and Human Behavior 33 2012 pp 775 779 doi 10 1016 j evolhumbehav 2012 07 002 Macmillan Learning Compute the mean laughing group size paying attention to the fact that the data are presented in frequencies x Does the computed mean fit your expectation This because the mean is fit with the prior expectation than the media
Statistics
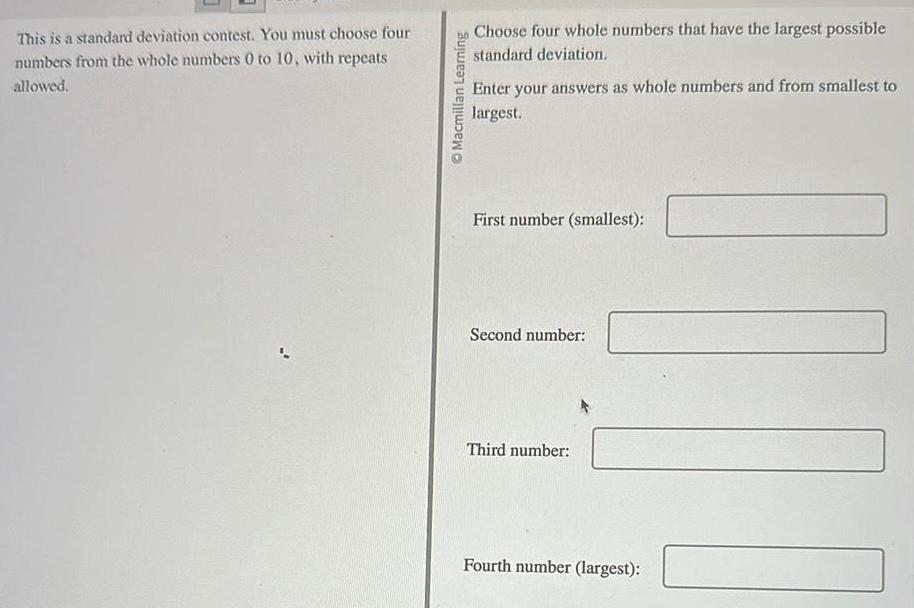
StatisticsThis is a standard deviation contest You must choose four numbers from the whole numbers 0 to 10 with repeats allowed Macmillan Learning Choose four whole numbers that have the largest possible standard deviation Enter your answers as whole numbers and from smallest to largest First number smallest Second number Third number Fourth number largest

Statistics
StatisticsMacmillan Learning of age at onset of anorexia for 691 Canadian girls diagnosed with the disorder If you round the age to whole numbers of years the first bar of the histogram the first class would include all girls diagnosed during their 11th year M Frequency 2 200 150 100 50 0 A 11 With a little care you can find the median and the quartiles from the histogram What are these numbers Enter your answers rounded to the nearest whole number 12 13 14 15 16 17 18 Age years at onset of anorexia

Statistics
StatisticsSide by Side This is a standard deviation contest You must choose four numbers from the whole numbers 0 to 10 with repeats allowed Macmillan Learning Choose four numbers that have the smallest possible standard deviation What is s in this case Enter your answer rounded to two decimal places S

Statistics
StatisticsSide by Side Some individuals have the ability to recall accurately vast amounts of autobiographical information without mnemonic tricks or extra practice This ability is called Highly Superior Autobiographical Memory HSAM A study recruited 11 adults with confirmed HSAM and 15 control individuals of similar age without HSAM All study participants were given a battery of cognitive and behavioral tests with the goal of finding out what might explain this extraordinary ability One of the cognitive test the study participants completed was the Leyton Obsessional Inventory test which has a maximum score of 30 points The results for the 11 HSAM individuals and for 14 of the controls are displayed below one individual in the control group left before completing this test HSAM 245 88 99 10 11 11 12 Control 1 2 2 2 2 4 4 4 5 7 8 8 12 12 Click to download the data in your preferred format Excel Minitab14 18 Minitab18 JMP SPSS TI R Mac TXT PC TXT CSV CrunchIt How do individuals with and without HSAM compare in terms of obsessional score Follow the four step process in reporting your work 1 A K R LePort et al Behavioral and neuroanataomical investigation of Macmillan Learning PLAN Compare the distributions as well as the means and standard deviations between the HSAM and control groups SOLVE Make dotplots for the HSAM and control groups Calculate the mean and standard deviation in obsessional score for the HSAM and control group Provide the answers for the sample mean x and sample standard deviation s results for the control group and the HSAM group with precision to two decimal places Xcontrol Scontrol HSAM

Statistics
StatisticsThe table provides the ratio of omega 3 to omega 6 fatty acids in common food oils The distribution is strongly right skewed with a high outlier Omega 3 fatty acids as a fraction of omega 6 fatty acids in food oils Oil Perilla 5 33 Walnut 0 20 Wheat germ Mustard 0 38 Sardine 2 16 Salmon 2 50 Mayonnais e Rat io Shortening industrial 0 13 0 06 Cod liver 2 00 Shortening household 0 11 0 06 Side by Side Omega 3 fatty acids as a fraction of omega 6 fatty acids in food oils Rat io Margarine 0 05 Olive 0 08 Shea nut 0 06 Sunflower oleic Oil 0 05 Sunflower linoleic Flaxseed 3 56 Canola 0 46 Soybean 0 13 Grape seed 0 00 Menhaden 1 96 0 00 Omega 3 fatty acids as a fraction of omega 6 fatty Macmillan Learning Calculate the mean Round your answer to four decimal places mean Calculate the median Round your answer to three decimal places median

Statistics
StatisticsUse the table below to find the standard deviation of the following data set Use at least three decimal places of accuracy at each step 12 30 33 35 36 44 X X x X T 12 30 33 35 36 44 SUM SUM n 1 SUM n 1

Statistics
StatisticsGraph 1 A BC a The mean is closest to b The median is closest to Graph 2 c Is this data skewed to the right symmetric or skewed to the left Enter SKEWED RIGHT SYMMETRIC or SKEWED LEFT without the quotations

Statistics
StatisticsThe timeplot below gives the share price in dollars of General Electric stock with the bar chart giving the volume in millions of shares The plots are for the one year period September 2001 September 2002 Click on the image for a larger view General Electric Co as of 24 Sep 2882 45 48 Millions 35 38 25 28 88 OC 339 89 OOO 48 Nov 1 Copyright 2882 Yahoo Inc Jan82 A 41 dollars OB 45 dollars OC 20 dollars D 25 dollars E None of the above Mar82 A 15 dollars B 35 dollars May82 Ju182 a The maximum price per share for this time period was about Splits C 25 dollars D 45 dollars E Cannot be determined from the graph c Which of the following is a true statement Any b If you bought a single share of stock at the maximum price and sold it at the minimum price during this one year period you would have lost about Sep82 http finance yahoo com A The price of General Electric stock has been stable for this year B The price should return to 40 dollars within six months because of the cycle C There has been a general upward trend in the stock price over this time period