Probability Questions and Answers
Statistics
ProbabilityIn a state s lottery you can bet 3 by selecting three digits each between 0 and 9 inclusive If the same three numbers are 600 Complete parts a through e a How many different selections are possible 1000 b What is the probability of winning Simplify your answer

Statistics
Probabilitypanying table which describes the number of adults in groups of five who reported sleepwalking Find the mean and standard deviation for the numbers eepwalkers in groups of five Click t Table of numbers of sleepwalkers and probabilities he mean 1244TOX 0 3 5 P x 0 184 0 359 0 296 0 128 0 031 0 002 X

Statistics
ProbabilitySuppose that textbook weights are normally distributed You measure 44 textbooks weights and find they have a mean weight of 63 ounces Assume the population standard deviation is 2 2 ounces Based on this construct a 95 confidence interval for the true population mean textbook weight Round answers to 2 decimal places Select an answer Select an answer 0

Statistics
ProbabilityA corporation must appoint a president chief executive officer CEO chief operating officer COO and chief financial officer CFO It must also appoint a planning committee with five different members There are 13 qualified candidates and officers can also serve on the committee Complete parts a through c below a How many different ways can the officers be appointed There are 17160 different ways to appoint the officers b How many different ways can the committee be appointed There are 1287 different ways to appoint the committee c What is the probability of randomly selecting the committee members and getting the five youngest of the qualified candidates P getting the five youngest of the qualified candidates Type an integer or a simplified fraction

Statistics
ProbabilityA Social Security number consists of nine digits in a particular order and repetition of digits is allowed After seeing the last four digits printed on a receipt if you randomly select the other digits what is the probability of getting the correct Social Security number of the person who was given the receipt The probability is Type an integer or a simplified fraction

Statistics
Probability16 The ages of clients seen in a local healthcare clinic is given in the following data set 37 38 45 47 48 51 54 54 58 60 62 63 63 65 69 71 74 75 78 78 80 84 86 89 92 94 96 What is the age range of the lower quartile O 37 51 O 59 O 65 Question navigation 14

Statistics
ProbabilityPart 1 of 4 The table below shows the results of a survey that asked 2853 people whether they are involved in any type of charity work A person is selected at random from the sample Complete parts a through d Total Frequently 224 Occasionally 453 430 Not at all 799 745 1476 202 1377 883 426 1544 2853 Male Female Total O a Find the probability that the person is frequently or occasionally involved in charity work P being frequently involved or being occasionally involved Round to the nearest thousandth as needed E

Statistics
ProbabilityA physics class has 50 students Of these 17 students are physics majors and 16 students are female Of the physics majors seven are female Find the probability that a randomly selected student is female physics major The probability that a randomly selected student is female or a physics major is Round to three decimal places as needed

Statistics
ProbabilityClassify the following statement as an example of classical probability empirical probability or subjective probability Explain your reasoning According to company records the probability that a washing machine will need repairs during an eight year period is 0 26 This is an example of probability since C the stated probability is calculated based on observations from the company records each washing machine has an equal chance of needing repairs during the period a washing machine is as likely to need repairs as it is to not need repairs it deals with a continuous period rather than a fixed number of trials tuition an educated guess or an estimate

Statistics
ProbabilityThirty of the 200 digital video recorders DVRs in an inventory are known to be defective What is the probability you randomly select a DVR that is not defective The probability is Type an integer or a decimal Do not round

Statistics
ProbabilityYou randomly select an integer from 0 to 39 inclusively and then randomly select an integer from 0 to 49 inclusively What is the probability of selecting a 37 both The probability is Type an integer or a decimal Do not round

Statistics
ProbabilityHypotheses for a statistical test are given followed by several possible confidence intervals for different samples In each case confidence interval to state a conclusion of the test for that sample and give the significance level used a 95 confidence interval for p 0 74 to 0 84 Conclusion Do not reject Significance level b 95 confidenc Conclusion Significance level c 99 confidenc 95 Conclusion 1 10 99 Conclusion 90 Significance level 5 Significance level Ho Hypotheses Ho p 0 8 vs Ha p 0 8 for p 0 97 to 1 18 Ho b 95 confidence interval for p 0 97 to 1 18 for p 0 78 to 0 81 V Ho c 99 confidence interval for p 0 78 to 0 81 Ho

Statistics
ProbabilityA confidence interval for a sample is given followed by several hypotheses to test using that sample In each case use the confidence interval to give a conclusion of the test if possible and also state the significance level you are using a Ho p 0 5 vs Ha p0 5 Conclusion Significance level b Ho p 0 78 Conclusion Significance level Conclusion 90 5 10 Conclusion 1 99 95 Significance level Ho b Ho p 0 78 vs Ha p 0 78 0 78 Significance level Ho A95 confidence interval for p 0 47 to 0 72 c Ho p 0 32 vs Ha p 0 32 Ho Ho

Statistics
Probability16 The life time of bulbs is as follows Can we accept the hypothesis that the average life is 4 hours Item 1 2 3 4 5 6 7 8 9 10 Life hours 4 2 4 6 3 9 5 2 3 8 3 9 4 3 4 4 5 6 4 1

Statistics
Probability12 Show that for distribution with n d f mean deviation about mean is given by n r n nr m 2 2

Statistics
ProbabilityWhich theory approaches medicine and health as disease being a threat to social order and sick individuals cannot fulfill their roles and contribute to society Structural Functionalist O Conflict Theory Symbolic interactionism O None of the Above

Statistics
ProbabilityFind the payment necessary to amortize a 12 loan of 2100 compounded quarterly with 17 quarterly payments The payment size is Round to the nearest cent www

Statistics
ProbabilityIf the variance of a variable is 36 what is the standard deviation This is a reading assessment question Be certain of your answer because you only get one attempt on this question The standard deviation is Type an integer or decimal rounded to two decimal places as needed

Statistics
ProbabilityWhat can be said about a set of data with a standard deviation of 0 This is a reading assessment question Be certain of your answer because you only get one attempt on this question Choose the correct answer below O A For every positive value there is a corresponding negative value as in 4 and 4 6 and 6 OB All the observations are the same value OC All the observations are 0

Statistics
ProbabilityIdentify the given statement as either true or false The standard deviation can be negative This is a reading assessment question Be certain of your answer because you only get one attempt on this question Choose the correct answer below False O True

Statistics
ProbabilityDescribe the shape of the distribution Relative Frequency OA skewed to the right B uniform OC skewed to the left

Statistics
ProbabilityThis question 1 point s possible K A student receives test scores of 62 83 and 91 The student s final exam score is 88 and homework score is 76 Each test is worth 20 of the final grade the final exam is 25 of the final grade and the homework grade is 15 of the final grade What is the student s final grade in the class A 90 6 OB 85 6 O C 76 6 OD 80 6 CHIB Submit

Statistics
ProbabilityThe graph below is an ogive of scores on a math test The vertical axis in an ogive is the cumulative relative frequency and can also be interpreted as a percentile Use the graph to approximate the percentile rank of an individual whose test score is 45 Q Percentile Ranks of Math Test Scores 100 90 80 70 60 50 40 30 20 104 0 0 10 20 30 40 50 60 70 80 90 100 Question 14 of 21 G EXIB This This OA 65 OB 60 O C 19 OD 14

Statistics
ProbabilityK The birth weights for twins are normally distributed with a mean of 2353 grams and a standard deviation of 647 grams Use z scores to determine which birth weight could be considered unusu O A 2000 g OB 1200 g OC 3647 g OD 2353 g

Statistics
ProbabilityThis question 1 point s possible Many firms use on the job training to teach their employees computer programming Suppose you work in the personnel department of a firm that just finished training a group of its en you have been requested to review the performance of one of the trainees on the final test that was given to all trainees The mean and standard deviation of the test scores are 70 ar distribution of scores is bell shaped and symmetric Suppose the trainee in question received a score of 67 Compute the trainee s z score OA Z 1 50 OB Z 0 93 OC z 0 93 OD z 1 5 MIXE

Statistics
ProbabilityPercentile The graph below is an ogive of scores on a math test The vertical axis in an ogive is the cumulative relative frequency and can also be interpreted as a percentile Use the graph to approximate the test score that corresponds to the 40th percentile Percentile Ranks of Math Test Scores 100 90 80 70 60 50 40 30 20 10 0 0 10 20 30 40 50 60 70 80 90 100 Test Sccore Q a Question 15 of 21 E This quiz 21 This questio OA 15 OB 10 OC 62 OD 56

Statistics
ProbabilityThe mean score of a competency test is 80 with a standard deviation of 5 Use the empirical rule to find the percentage of scores between 75 and 85 Assume the data set has a bell shape OA 99 7 OB 95 OC 50 D 68 OOO
Statistics
ProbabilityK The mean IQ score of adults is 100 with a standard deviation of 15 Use the empirical rule to find the percentage of adults with scores between 70 and 130 Assume the data set has a bell sham distribution OA 68 OB 100 OC 99 7 OD 95
Statistics
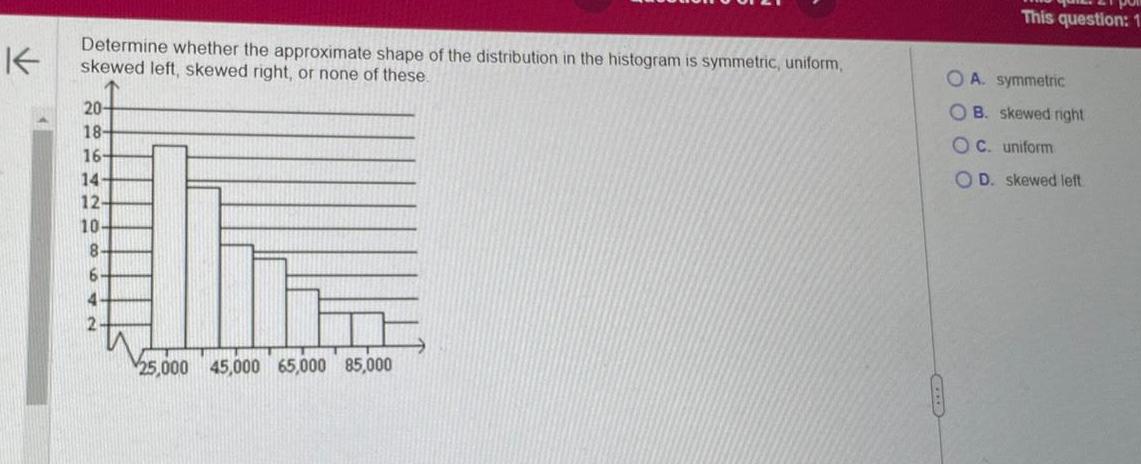
ProbabilityK Determine whether the approximate shape of the distribution in the histogram is symmetric uniform skewed left skewed right or none of these 20 18 16 14 12 10 8 6 4 2 L 25 000 45 000 65 000 85 000 This question 1 OA symmetric OB skewed right OC uniform OD skewed left

Statistics
ProbabilityAn experiment was conducted in which two fair dice were thrown 100 times The sum of the pips showing on the dice was then recorded The frequency histogram to the right gives the results Use the histogram to complete parts a through f a What was the most frequent outcome of the experiment b What was the least frequent c How many times did we observe a 6 d How many more 5 s were observed than 3 s Frequency 20 10 2 Sum of Two Dice st 6 8 Value of dice 10 12

Statistics
Probability1 To study about the correlation between height and shoe size you need to collect a sample of nine 9 people using a Systematic Sampling method a What is the population of people Where and how are you going to collect your sample Does your sample accurately represent your population Why or why not b Collect the sample and record the data Use a single unit for height Do not use a mixed unit like feet and inches Height Shoe Size Person 1 Person 2 Person 3 Person 4 Person 5 Person 6 Person 7 Person 8 Person 9 2 CLO 1 Construct a confidence interval to estimate the mean height and the mean shoe size you must complete the following questions by first choosing a Confidence Level You may choose from the familiar 90 95 or 99 level of confidence Denote this by choosing a a Find the sample mean and sample standard deviation of the height Denote them as x and sx respectively b Find the sample mean and sample standard deviation of the shoe sizes Denote them as y and sy respectively c Construct and interpret a confidence interval to estimate the mean height of the population You can use StatCrunch Microsoft Excel or any other statistical tool for the confidence interval and then substitute your appropriate numbers d Construct and interpret a confidence interval to estimate the mean shoe size of the population You can use StatCrunch Microsoft Excel or any other statistical tool for the confidence interval and then substitute your appropriate numbers
Statistics
ProbabilityDetermine if the statement is true or false When an observation that is much larger than the rest of the data is added to a data set the value of the median will increase substantially This is a reading assessment question Be certain of your answer because you only get one attempt on this question Choose the correct answer below O True False

Statistics
Probability1 Claim A coin favors heads when tossed You did 20 tosses of a fair well balanced coin and found 11 heads a Define H and H 0 a b Use the rare event rule to determine if the claim is valid
Statistics
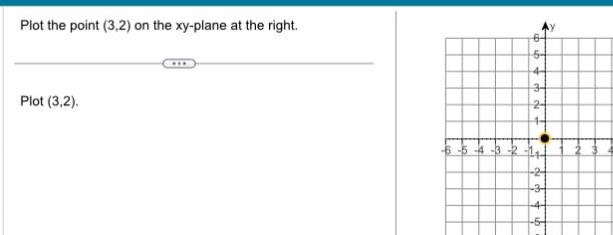
ProbabilityPlot the point 3 2 on the xy plane at the right Plot 3 2 6 54 4 34 24 5 4 3 2 1 7 24 34 4 5

Statistics
ProbabilityRationalize the denominator If possible simplify the rationalized expression by dividing the numerator and denominator by the greatest common factor 10


Statistics
ProbabilityA newspaper article claimed that the afternoon hours were the worst in terms of robberies and provided the graph to the right in support of this claim Explain how this graph is misleading Percent of Robberies 25 20 15 10 Hourly Crime Distribution Robbery 6a 9a 9a 12p 12p 6p 6p 9p 9p 12a 12a 3a 3a 6a Choose the correct answer below O A The vertical axis stops at 25 It should go all the way up to 100 to accurately show percentage data OB Not all of the time intervals are the same size Redistributing the time interval so they are all the same size ma lead to a different shape OC The vertical axis has no units This can mislead readers into thinking that the percentages are actually counts O D All of the bars are the same color so they tend to blend visually with each other This makes the graph hard to read

Statistics
ProbabilityThe blood platelet counts of a group of women have a bell shaped distribution with a mean of 247 2 and a standard deviation of 63 4 All units are 1000 cells uL Using the empirical rule find each approximate percentage below a What is the approximate percentage of women with platelet counts within 3 standard deviations of the mean or between 57 0 and 437 4 b What is the approximate percentage of women with platelet counts between 183 8 and 310 6 of women in this group have platelet counts within 3 standard deviations of the mean or between a Approximately 57 0 and 437 4 Type an integer or a decimal Do not round b Approximately of women in this group have platelet counts between 183 8 and 310 6 Type an integer or a decimal Do not round

Statistics
ProbabilityWhat is an ogive Choose the correct answer below OA A graph that represents the cumulative frequency or cumulative relative frequency for the class OB A circle divided into sectors each sector representing a category of data OC A graph that uses points connected by line segments to represent the frequency or relative frequency for class OD A bar graph whose bars are drawn in decreasing order of frequency or relative frequency


Statistics
Probability5 According to a recent survey the probability that the driver in a fatal vehicle accident is female event F is 0 2105 The probability that the driver is 24 years old or less event A is 0 1818 The probability that the driver is female and is 24 years old or less is 0 0418 Answer parts a through d below a Find the probability of FUA P FUA b Find the probability of F UA P F UA c Find the probability of FNA Round to four decimal places as needed Round to four decimal places as needed P FNA d Find the probability of F UA P F UA Round to four decimal places as needed Round to four decimal places as needed

Statistics
ProbabilityThe probability distribution of X the number of imperfections per 10 meters of a synthetic fabric in continuous rolls of uniform width is given by the accompa table Find the average number of imperfections per 10 meters of this fabric X f x 0 0 41 1 0 37 2 0 16 3 0 04 4 0 02 The average number of imperfections per 10 meters of this fabric is Type an integer or a decimal Round to two decimal places as needed

Statistics
ProbabilityCost Cost Number 9 8 17 3 37 8 10 6 19 7 38 2 11 8 20 5 38 7 12 5 35 5 22 3 39 2 13 7 36 4 24 0 39 5 Source Agency for Healthcare Research and Quality Part 1 of 2 Send data to Excel Number 34 3 34 2 34 9 a Compute the coefficient of determination Round the answer to at least three decimal places Part 1 2 The coefficient of determination is 0 97337 Part 2 of 2 b How much of the variation in mean cost of hospital stay is explained by the least squares regression line answer to at least one decimal place

Statistics
Probabilityhow many ways can 5 oaks 2 pines and 3 maples be arranged along a property line if one does not distinguish among trees of the same kind he trees can be arranged along a property line in ways if one does not distinguish among trees of the same kind Type a whole number

Statistics
ProbabilityThe table below represents the probability density function for the random variable X Find the standard deviation of X Round the final answer to two decimal places Provide your answer below X 2 5 P X X 1 4 1 4 1 4 1 4

Statistics
Probability0 08 0 44 6 The figure above shows the probability density function for the random variable 2 The shaded area represents P 1 z 5 What is P 1 5 Select the correct answer below 0 46 0 35 0 54 0 11 092 0 05 P z 1

Statistics
ProbabilityFrom a box containing 2 black balls and 3 green balls 3 balls are drawn in succession each ball being replaced in the box before the next draw is made Find the probability distribution for the number of green balls Denote by X the number of green balls in the three draws Complete the probability distribution 1 X P X x 0 Tyne inteners or simplified fractions 2 3

Statistics
ProbabilityDetermine the critical value or values for a one mean z test at the 6 significance level if the hypothesis test is left tailed Ha Ho Select the correct answer below O 1 881 O 1 555 O 1 555 1 881 O 1 881 and 1 881 1 555 and 1 555 ZO 48 0 050 30 24 20 12 20 06 20 03 0 706 1 175 1 555 1 881