Probability Questions and Answers

Statistics
Probability9 Each of the numbers from 1 to 30 is written on a card and placed in a bag If one card is drawn at random what is the probability that the number is a multiple of 2 or a multiple of 3

Statistics
Probability7 A card is selected from a deck of 52 cards What is the probability it is a red card or a Face card

Statistics
ProbabilityScenario 1 What is the probability that a marble randomly pulled from a bag is yellow OR red Click here for diagram answer In this scenario OR means we are looking for the items in union Therefore P red OR yellow P R UY fraction bar the two circles which is the Enter your answer as a reduced fraction using for th

Statistics
ProbabilitySimple Event B G R Y Outcome of Interest Choose a marble that is not green Choose a marble that is not red Choose a marble that is not blue Choose a marble that is not yellow where az is the probability of choosing the color 1 3 10 1 1 15 2 5 10 P x where z is the simple event P G 7 10 P R 3 P B P Y 14 15 10

Statistics
ProbabilityA person with high emotional intelligence has The ability to be aware of and manage their own emotions as well as their social interactions A high level of knowledge about emotions A high level of intelligence The ability to not feel their emotions and to help others be calm

Statistics
ProbabilityTo determine whether living near high voltage power lines is related to whether a person develops cancer researchers recruited a sample of people and determined whether each one lived within 500 meters of high voltage power lines Subjects were followed for 15 years to determine whether they developed cancer Total Cancer No Cancer Total 590 9848 590 22960 590 1167 590 9848 Which proportions would be compared to determine whether there is an association between living near power lines and developing cancer 9258 9848 and Cancer Total and and Near Power Lines 590 and No Cancer 9258 9848 O P P OP P OP P Q 577 22960 577 QUESTION 2 To determine whether living near high voltage power lines is related to whether a person develops cancer researchers recruited a sample of people and determined whether each one lived within 500 meters of high voltage power lines Subjects were followed for 15 years to determine whether they developed cancer Total 1167 577 13112 Not Near Power Lines 577 12535 13112 Near Power Lines 590 9258 9848 1167 21793 22960 Not Near Power Lines 577 12535 13112 1167 21793 22960 What is the null hypothesis to determine whether there is an association between living near power lines and developing cancer

Statistics
Probabilityc Find the area under the normal curve to the left of z 0 23 plus the area under the normal curve to the right of z 1 The combined area is Round to four decimal places as needed

Statistics
ProbabilityFind the percentage of the total area under the standard normal curve between the following 2 scores z 2 48 and z 0 05 Click here for page 1 of the Areas under the Normal Curve Table Click here for page 2 of the Areas under the Normal Curve Table The percentage of the total area between 2 2 48 and z 0 05 is Round to two decimal places as needed Areas under the Normal Curve page 1 Areas under the Normal Curve The column under A gives the proportion of the area under the entire curve that is between z 0 and a positive value of z z A A z 3315 1 44 3340 1 45 2 1844 96 1879 97 1915 1950 99 3389 1 47 1985 1 00 3413 1 48 2019 1 01 3438 1 49 98 3365 1 46 4306 4319 4332 4345 1 04 3508 1 52 4382 2054 1 02 3461 1 50 2088 1 03 3485 1 51 2123 4357 2157 1 05 3631 1 53 4370 2190 1 06 3554 1 54 2224 1 07 3577 1 55 2258 1 08 3599 1 56 2291 1 09 3621 1 57 2324 1 10 3643 1 58 2357 1 11 3665 1 59 2389 1 12 3686 1 60 4394 4406 4418 4430 Com Z 00 01 02 03 04 0160 05 0199 06 0239 0279 07 08 0319 0359 0398 0438 0478 13 0517 0557 0596 0636 BETE 888 SIN688 09 10 11 12 14 15 A 0000 0040 0080 0120 51 16 IT 2988283886 48 49 50 52 53 54 55 56 57 58 59 60 28828 61 62 63 64 A 4251 4265 4279 4292 4441 4452 PORN

Statistics
ProbabilityAccording to flightstats com American Airlines flights from Dallas to Chicago are on time 80 of the time Suppose 10 flights are randomly selected and the number of on time a Explain why this is a binomial experiment b Determine the values of n and p c Find and interpret the probability that exactly 6 flights are on time d Find and interpret the probability that fewer than 6 flights are on time e Find and interpret the probability that at least 6 flights are on time f Find and interpret the probability that between 4 and 6 flights inclusive are on time c Using the binomial distribution the probability that exactly 6 flights are on time is Round to four decimal places as needed Interpret the probability In 100 trials of this experiment it is expected that about will result in exactly 6 flights being on time Round to the nearest whole number as needed d Using the binomial distribution the probability that fewer than 6 flights are on time is Round to four decimal places as needed Interpret the probability In 100 trials of this experiment it is expected that about Round to the nearest whole number as needed will result in fewer than 6 flights being on time e Using the binomial distribution the probability that at least 6 flights are on time is Round to four decimal places as needed Interpret the probability In 100 trials of this experiment it is expected that about Round to the nearest whole number as needed will result in at least 6 flights being on time f Using the binomial distribution the probability that between 4 and 6 flights inclusive are on time is Round to four decimal places as needed Interpret the probability D inclusivo being on time

Statistics
ProbabilityThe following table gives the number of fatal work injuries categorized by cause from 2015 in a certain country Cause Number of Fatalities 2462 740 749 823 402 Transportation accidents Assaults and violent acts Contacts with objects and equipment Falls Exposure to harmful substances or environments Fires and explosions Other Find the probability that a randomly chosen work fatality had the following cause Assaults and violent acts There were a total of fatal work injuries The probability is Round to four decimal places as needed 140 11

Statistics
ProbabilityJonathan a college business student wants to study how many pages of notes fellow classmates took during a semester for a finance class Past data reveals that pages of notes for a finance college class has a mean of 95 with standard deviation 25 pages He plans to take a random sample of 30 such college students and will calculate the mean pages of notes they take to compare to the known pages of notes students take for a finance college class For these values the mean and standard deviation of the sampling distribution of sample means for a sample of size 30 are 95 and 4 6 25 30 What is the probability that the sample mean for a sample of size 30 will be at least 99 You may use a calculator or the portion of the z table given below Round your answer to the nearest percent Z 0 5 0 6 0 7 0 8 0 9 1 0 1 1 1 2 0 00 0 01 0 02 0 03 0 06 0 07 0 08 0 05 0 7088 0 7123 0 6915 0 6950 0 6985 0 7019 0 7157 0 7190 0 04 0 7054 0 7389 0 7704 0 7734 0 7764 0 7257 0 7291 0 7324 0 7357 0 7422 0 7454 0 7486 0 7517 0 7580 0 7611 0 7642 0 7673 0 7794 0 7823 0 7881 0 7910 0 7939 0 7967 0 8078 0 8106 0 7995 0 8023 0 8051 0 8289 0 8159 0 8186 0 8212 0 8238 0 8264 0 8315 0 8340 0 8365 0 8413 0 8438 0 8461 0 8485 0 8508 0 8531 0 8554 0 8577 0 8599 0 8643 0 8665 0 8686 0 8708 0 8729 0 8749 0 8770 0 8790 0 8810 0 8849 0 8869 0 8888 0 8907 0 8925 0 8944 0 8962 0 8980 0 8997 0 09 0 7224 0 7549 0 7852 0 8133 0 8389 0 8621 0 8830 0 9015

Statistics
ProbabilityRespondents to a survey indicated the following categorizations pertaining to attendance at religious services There were a total of 2025 respons Number of Respondents 255 129 474 288 24 Find the probability that a randomly chosen person attends religious services with the indicated frequency in parts a through c below Attendance Never Less than once a year Once a year Several times a year Once a month Number of Respondents 755 147 317 377 160 a once a month The probability is Round to four decimal places as needed b every week The probability is Round to four decimal places as needed c nearly every week or more frequently The probability is Round to four decimal places as needed Attendance 2 3 times a month Nearly every week Every week More than once a week Don t know no answer CHE

Statistics
ProbabilityWhether the study depicts an observational study or an experiment Professional weightlifters are randomly divided into two groups One group is given a diet of mostly protein the other is given a diet of mostly carbohydrates After 1 week each group is given a ifting test to compare strength Choose the correct description of the study OA The study is an observational study because the study examines individuals in a sample but does not try to influence the variable of interest OB The study is an experiment because the study examines individuals in a sample but does not try to influenc the variable of interest OC The study is an observational study because the researchers control one variable to determine the effect on response variable OD The study is an experiment because the researchers control one variable to determine the effect on the response variable
Statistics
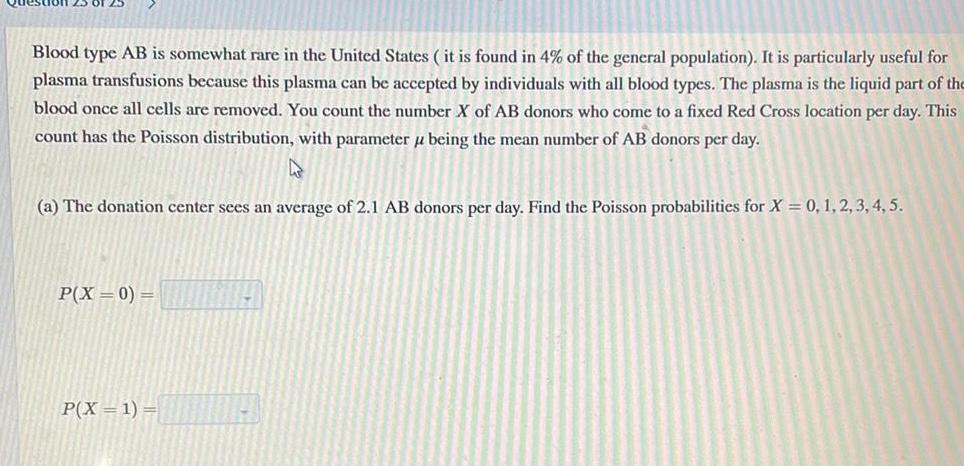
ProbabilityBlood type AB is somewhat rare in the United States it is found in 4 of the general population It is particularly useful for plasma transfusions because this plasma can be accepted by individuals with all blood types The plasma is the liquid part of the blood once all cells are removed You count the number X of AB donors who come to a fixed Red Cross location per day This count has the Poisson distribution with parameter u being the mean number of AB donors per day a The donation center sees an average of 2 1 AB donors per day Find the Poisson probabilities for X 0 1 2 3 4 5 P X 0 P X 1

Statistics
ProbabilityK Is an inherent zero Describe three examples of data sets that have inherent zeros and three that do not Choose the correct answer below OA An inherent zero is a value that the variable can take OB An inherent zero is a zero that implies none OC An inherent zero is a zero that occurs in the data set naturally Select three examples of data sets that have inherent zeros below A Average monthly precipitation in inches B Average IQ score of a high school class C Temperature in degrees Fahrenheit D A student s level of happiness measured from 0 to 10 E Average age of college students in years F Maximum wind speed during a hurricane Select three examples of data sets that do not have inherent zeros below A Temperature in degrees Fahrenheit B Average IQ score of a high school class C A student s level of happiness measured from 0 to 10 D Average age of college students in years E Average monthly precipitation in inches F Maximum wind speed during a hurricane

Statistics
ProbabilityA modified roulette wheel has 44 slots One slot is 0 another is 00 and the others are numbered 1 through 42 respectively You are placing a bet that the outcome is an odd number In roulette 0 and 00 are neither odd nor even Type an integer or a simplified fraction b What are the actual odds against winning The actual odds against winning are 23 21 c When you bet that the outcome is an odd number the payoff odds are 1 1 How much profit do you make if you bet 19 and win If you win the payoff is 19 d How much profit should you make on the 19 bet if you could somehow convince the casino to change its payoff odds so that they are the same as the actual odds against winning s Round to the nearest cent as needed

Statistics
ProbabilitySimple Event Enter fractions in reduced form using a for the fraction bar Do not use any spaces in your answer except for the Outcome of Interest G R Y marbles and one blue marble respectively Outcome of Interest Choose a marble that is not green Choose a marble that is not red roles three green marbles two yellow Choose a marble that is not blue Choose a marble that is not yellow 1 P x where x is the probability of choosing the color 1 1 1 2 19 P x where I is the simple event P G 7 10 P R P Y

Statistics
ProbabilityA modified roulette wheel has 36 slots One slot is 0 another is 00 and the others are numbered 1 through 34 respectively You are placing a bet that the outcome is an odd number In roulette 0 and 00 are neither odd nor even a What is your probability of winning 17 36 The probability of winning is Type an integer or a simplified fraction b What are the actual odds against winning The actual odds against winning are 19 17 c When you bet that the outcome is an odd number the payoff odds are 1 1 How much profit do you make if you bet 14 and win If you win the payoff is s

Statistics
ProbabilityA modified roulette wheel has 40 slots One slot is 0 another is 00 and the others are numbered 1 through 38 respectively You are placing a bet that the outcome is an even number In roulette 0 and 00 are neither odd nor even a What is your probability of winning 19 40 The probability of winning is Type an integer or a simplified fraction b What are the actual odds against winning The actual odds against winning are GEXED

Statistics
ProbabilityAn airliner carries 250 passengers and has doors with a height of 70 in Heights of men are normally distributed with a mean of 69 0 in and a standard deviation of 2 8 in Complete parts a through d The probability is Round to four decimal places as needed b If half of the 250 passengers are men find the probability that the mean height of the 125 men is less than 70 in The probability is Round to four decimal places as needed c When considering the comfort and safety of passengers which result is more relevant the probability from part a or the probability from part b Why OA The probability from part b is more relevant because it shows the proportion of flights where the mean height of the male be less than the door height passengers will B The probability from part b is more relevant because it shows the proportion of male passengers that will not need to bend OC The probability from part a is more relevant because it shows the proportion of flights where the mean height of the male passengers will be less than the door height OD The probability from part a is more relevant because it shows the proportion of male passengers that will not need to bend d When considering the comfort and safety of passengers why are women ignored in this case OA There is no adequate reason to ignore women A separate statistical analysis should be carried out for the case of women un

Statistics
ProbabilityAssume that there is a 11 rate of disk drive fallure in a year a If all your computer data is stored on a hard disk drive with a copy stored on a second hard disk drive what is the probability that during a year you can avold catastroph with at least one working drive b If coples of all your computer data are stored on three Independent hard disk drives what is the probability that during a year you can avoid catastrophe with at least on working drive a With two hard disk drives the probability that catastrophe can be avoided is Round to four decimal places as needed

Statistics
ProbabilityThe data represent the results for a test for a certain disease Assume one individual from the group is randomly selected Find the probability of getting someone who tested negative given that he or she had the disease The probability is approximately The individual actually had the disease Yes No 135 23 Positive Negative Round to three decimal places as needed www 10 132

Statistics
ProbabilityIn an experiment college students were given elther four quarters or a 1 bill and they could elther keep the money or spend it on gum The results are summarized in the table Complete parts a through c below Students Given Four Quarters Students Given a 1 Bill Purchased Gum 31 16 Kept the Money 12 29 a Find the probability of randomly selecting a student who spent the money given that the student was given four quarters The probability is Round to three decimal places as needed

Statistics
ProbabilityIn a certain country the true probability of a baby being a boy is 0 515 Among the next nine randomly selected births in the country what is the probability that at least one of them is a girt The probability is Round to three decimal places as needed

Statistics
ProbabilityIf n 20 what constant do we use to calculate the 99 confidence interval of the mean O 2 861 O2 086 O 2 846

Statistics
ProbabilityA college professor never finishes his lecture before the end of the hour and always finishes his lectures within 2 min after the hour Let X the time that elapses between the end of the hour and the end of the lecture and suppose the pdf of X is as follows kx 0 x 2 otherwise a Find the value of k Enter your answer to three decimal places Draw the corresponding density curve Hint Total area under the graph of f x is 1 f x f x 1 5 1 0 0 5 f x 1 5 1 0 0 5 0 5 0 5 1 0 1 0 1 5 1 5 2 0 2 0 X 1 5 3197633301 1 0 0 5 f x 1 5 1 0 0 5 0 5 0 5 1 0 1 0 1 5 1 5 2 0 2 0 b What is the probability that the lecture ends within 1 min of the end of the hour Enter your answer to three decimal places c What is the probability that the lecture continues beyond the hour for between 60 and 90 sec Round your answer to four decimal places X X Page 2 of 11

Statistics
ProbabilityFigure 8 6 The vertical distance between points A and B represents a tax in the market 22 20 18 16 14 12 10 6 4 Supply Demand 100 200 300 400 500 600 700 800 900 1000 Ob 6 O c 16 O d 4 Quantity Refer to Figure 8 6 When the tax is imposed in this market the price buyers effectively pay is a 10

Statistics
ProbabilityThe time it takes for a fisherman to catch a fish is exponentially distributed with an average wait time of 33 minutes Identify the parameters of the exponential distribution Enter your answer for A as a fraction Provide your answer below 2 0 4 0 0 0

Statistics
ProbabilityAs in the previous problem 56 customers are randomly selected at Sun Valley Bank If X is the number of customers who have a high yield savings account then the distribution of X can be approximated with a normal distribution N 28 3 7 where the mean u is 28 and standard deviation o is 3 7 Using this approximation find the probability of 30 or 31 customers having a high yield savings account You may use the portion of the Standard Normal Table below Z 0 00 0 01 0 02 0 03 0 04 0 05 0 06 0 07 0 08 0 09 0 3 0 6179 0 6217 0 6255 0 6293 0 6331 0 6368 0 6406 0 6443 0 6480 0 6517 0 4 0 6554 0 6591 0 6628 0 6664 0 6700 0 6736 0 6772 0 6808 0 6844 0 6879 0 5 0 6915 0 6950 0 6985 0 7019 0 7054 0 7088 0 7123 0 7157 0 7190 0 7224 0 6 0 7257 0 7291 0 7324 0 7357 0 7389 0 7422 0 7454 0 7486 0 7517 0 7549 0 7 0 7580 0 7611 0 7642 0 7673 0 7704 0 7734 0 7764 0 7794 0 7823 0 7852 0 8 0 7881 0 7910 0 7939 0 7967 0 7995 0 8023 0 8051 0 8078 0 8106 0 8133 0 9 0 8159 0 8186 0 8212 0 8238 0 8264 0 8289 0 8315 0 8340 0 8365 0 8389 Round the final answer to two decimal places

Statistics
ProbabilityQUESTION 9 S POINTS The weight of a chocolate bar is 4 4 ounces but can vary Let W be a random variable that represents the weight of a chocolate bar The probability density function of Wis given below Move the left and right sliders so that the area of the blue shaded region represents the probability that a chocolate bar is at least 3 ounces but no more than 10 ounces Provide your answer below 0 2 0 18 0108 10 RESET 12 13 left Area under ourve 0 79046592 14 4 11 8 right 9 11 12 10 Weight s

Statistics
Probabilitymagazine claims that the mean amount spent by a customer at Burger Stop is greater than the mean amount spent by a customer at Fry World The results for samples of customer transactions for the wo fast food restaurants are shown below At 0 10 can you support the magazine s claim Assume the population variances are equal Assume the samples are random and independent and the opulations are normally distributed Complete parts a through e below Burger Stop X 11 36 S1 0 81 n 17 Fry World X2 10 73 S2 0 65 n2 8 he null hypothesis Ho is The alternative hypothesis Ha is Which hypothesis is the claim The null hypothesis Ho The alternative hypothesis Ha o Find the critical value s and identify the rejection region s Enter the critical value s below

Statistics
ProbabilityWaiting times in minutes of customers at a bank where all customers enter a single waiting line and a bank where customers wait in individual lines at th different teller windows are listed below Find the coefficient of variation for each of the two sets of data then compare the variation Bank A single line 6 6 6 6 6 7 6 9 7 2 7 3 7 4 7 7 7 7 7 8 Bank B individual 4 0 5 3 5 8 6 3 6 7 7 7 7 7 8 6 9 3 9 9 lines The coefficient of variation for the waiting times at Bank A is Round to one decimal place as needed
Statistics
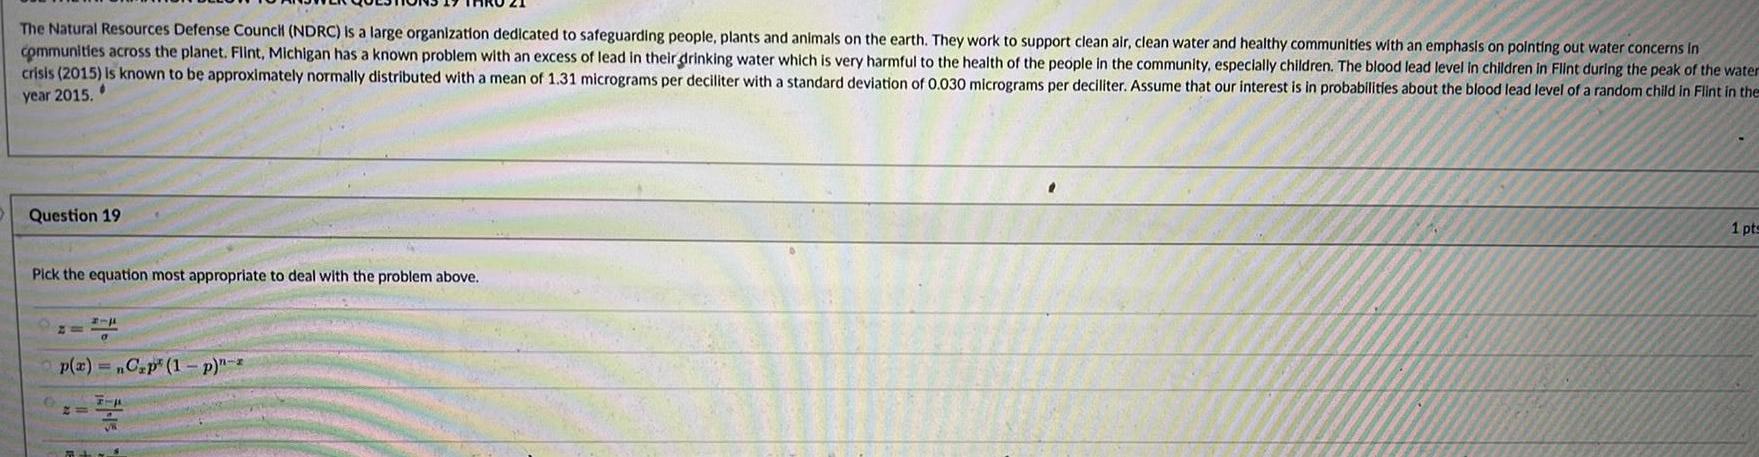
ProbabilityThe Natural Resources Defense Council NDRC is a large organization dedicated to safeguarding people plants and animals on the earth They work to support clean air clean water and healthy communities with an emphasis on pointing out water concerns in communities across the planet Flint Michigan has a known problem with an excess of lead in their drinking water which is very harmful to the health of the people in the community especially children The blood lead level in children in Flint during the peak of the water crisis 2015 is known to be approximately normally distributed with a mean of 1 31 micrograms per deciliter with a standard deviation of 0 030 micrograms per deciliter Assume that our interest is in probabilities about the blood lead level of a random child in Flint in the year 2015 Question 19 Pick the equation most appropriate to deal with the problem above 2 p x nCap 1 p FIA MS C 1 pts

Statistics
ProbabilityDo you carpool Let X represent the number of occupants in a randomly chosen car on a certain stretch of highway during morning commute hours A survey of cars showed that the probability distribution of X is as follows 1 P x 0 67 x Send data to Excel Part 1 of 7 a Find P 4 P 4 Part 2 of 7 2 0 14 Plaronter 3 0 12 b Find P greater than or equal to 2 4 5 0 04 0 03

Statistics
ProbabilityThe Masterfoods company says that before the introduction of purple the distribution of colors among plain M Ms was yellow 0 20 red 0 18 Prob brown Question 1 1 point Orange 0 08 Blue 0 20 Green 0 14 Brown Suppose you have a very large party bag with thousands of plain M M s The bag is so large that drawing one M M from the bag makes no real difference to the proportions of the M M s remaining in the bag You pick one M M at random from the bag

Statistics
ProbabilityAn automobile tire manufacturer collected the data in the table relating tire pressure x in pounds per square inch and mileage in thousands of miles Use quadratic regression on a graphing utility to find the quadratic function f x that best fits the data f x x x Round to three decimal places as needed x 28 30 32 34 36 Mileage 44 50 56 51 45

Statistics
ProbabilityIn order to say that a distribution is negatively skewed which of the following must be true choose one or more O Right tail must be longer than the left O Right and left tails must be equal O Curve must be bell shaped Left tail must be longer than the right

Statistics
ProbabilityIf the kurtosis value is negative which of the following statements are true choose one or more The dstribution is platykurtic The distribution is leptokurtic The distribution is flat The distribution is peaked
Statistics
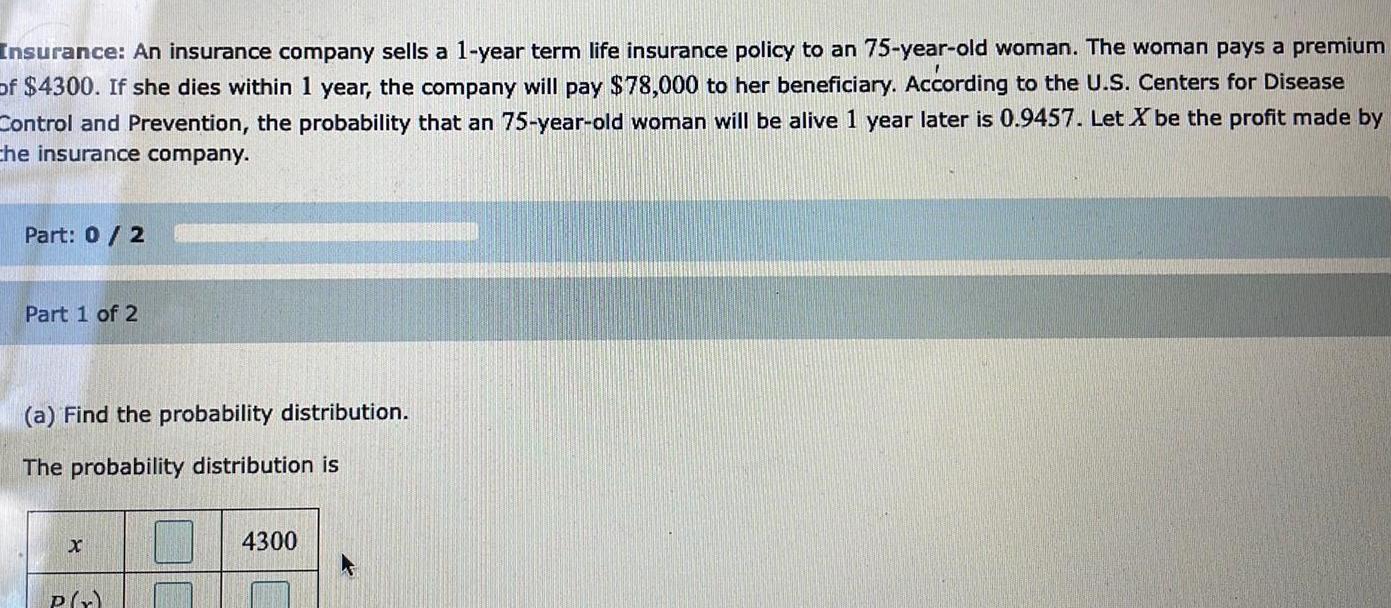
ProbabilityInsurance An insurance company sells a 1 year term life insurance policy to an 75 year old woman The woman pays a premium of 4300 If she dies within 1 year the company will pay 78 000 to her beneficiary According to the U S Centers for Disease Control and Prevention the probability that an 75 year old woman will be alive 1 year later is 0 9457 Let X be the profit made by the insurance company Part 0 2 Part 1 of 2 a Find the probability distribution The probability distribution is X P x 4300

Statistics
ProbabilityPain A recent survey asked 825 people how many days they would wait to seek medical treatment if they were suffering pain that interfered with their ability to work The results are presented in the following table Number of Days 0 1 2 3 4 5 Total Send data to Excel Consider these 825 people to be a population Let X be the number of days for a person sampled at random from this population Part 0 5 Part 1 of 5 X Frequency 24 436 260 75 18 12 825 a Construct the probability distribution of X Round the answer to three decimal places 0 1 4 5 X 5 2 3 ola

Statistics
ProbabilityTo help assess student learning in her developmental science courses a science professor at a university implemented pre and post tests for her developmental science students A knowledge gained score was obtained by taking the difference of the two test scores What type of experimental design is this Randomized block design Case control Completely randomized design Matched pair What is the response variable in this experiment O The score on the posttest O Difference in test scores O The score on the pretest O Total in test scores

Statistics
ProbabilityDetermine the required value of the missing probability to make the distribution a discrete probability distribution P 4 Type an integer or a decimal X 345 O 6 P x 0 35 0 37 0 07

Statistics
ProbabilityWhat is replication in an experiment Choose the correct answer below O A Replication is grouping together similar experimental units and then using random assignm B Replication is pairing up related experimental units O C Replication is applying each treatment to more than one experimental unit D Replication is randomly assigning each experimental unit to a treatment

Statistics
ProbabilityAccording to a poll about 19 of adults in a country bet on professional sports Data indicates that 48 4 of the adult population in this country is male Complete parts a through E a Are the events male and bet on professional sports mutually exclusive Explain OA Yes A person cannot be both male and bet on professional sports at the same time OB No A person cannot be male and bet on professional sports at the same time OC No A person can be both male and bet on professional sports at the same time D Yes A person can be both male and bet on professional sports at the same time b Assuming that betting is independent of gender compute the probability that an adult from this country selected at random is a male and bets on professional sports P male and bets on professional sports Type an integer or decimal rounded to four decimal places as needed c Using the result in part b compute the probability that an adult from this country selected at random is male or bets on professional sports P male or bets on professional sports Type an integer or decimal rounded to four decimal places as needed d The poll data indicated that 11 9 of adults in this country are males and bet on professional sports What does this indicate about the assumption in part b OA The assumption was correct and the events are independent OB The assumption was incorrect and the events are not independent e How will the information in part d affect the probability you computed in part c Select the correct choice below and fill in any answer boxes within your choice OA P males or bets on professional sports Type an integer or decimal rounded to four decimal places as needed B This information does not affect the probability computed in part c
Statistics
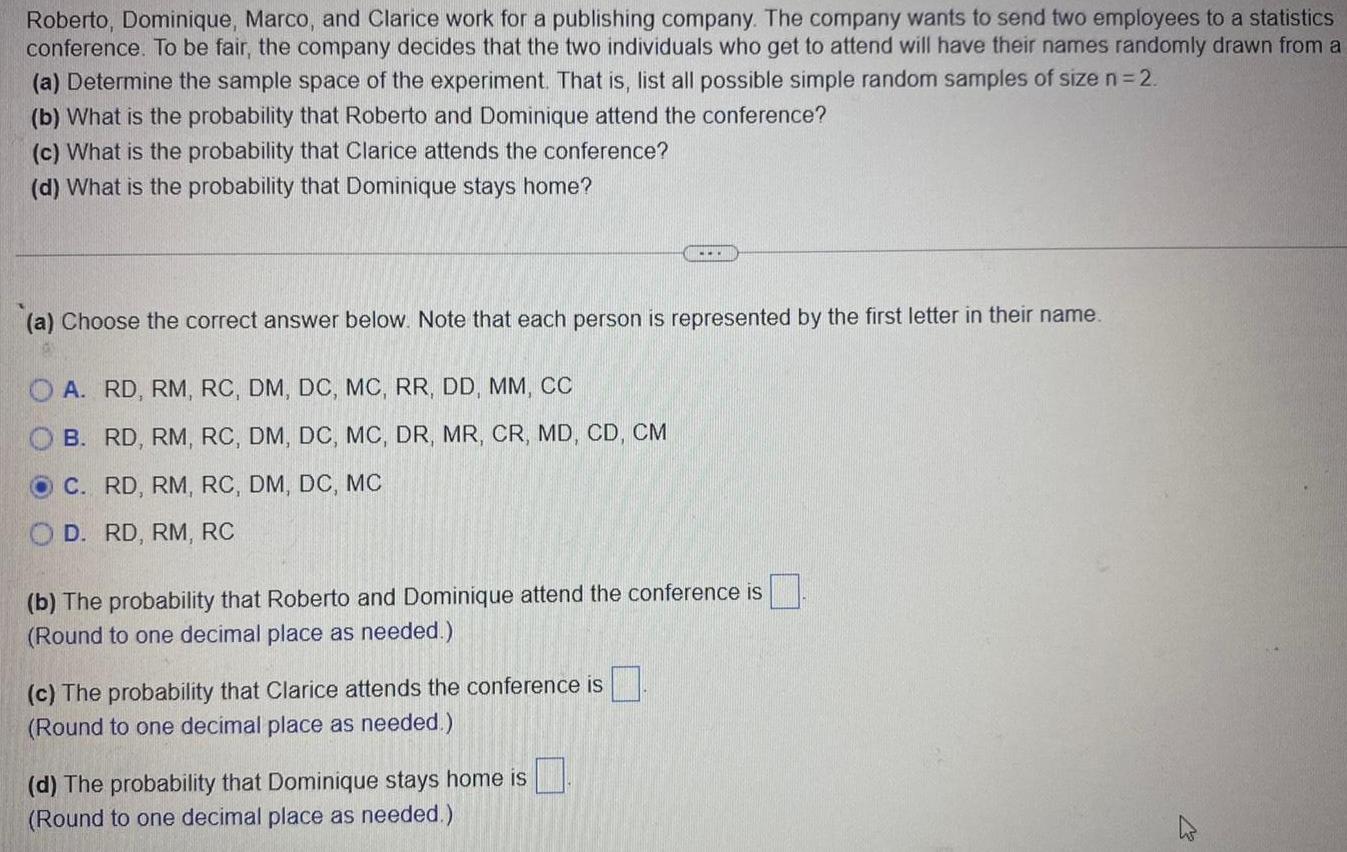
ProbabilityRoberto Dominique Marco and Clarice work for a publishing company The company wants to send two employees to a statistics conference To be fair the company decides that the two individuals who get to attend will have their names randomly drawn from a a Determine the sample space of the experiment That is list all possible simple random samples of size n 2 b What is the probability that Roberto and Dominique attend the conference c What is the probability that Clarice attends the conference d What is the probability that Dominique stays home a Choose the correct answer below Note that each person is represented by the first letter in their name A RD RM RC DM DC MC RR DD MM CC B RD RM RC DM DC MC DR MR CR MD CD CM C RD RM RC DM DC MC D RD RM RC b The probability that Roberto and Dominique attend the conference is Round to one decimal place as needed c The probability that Clarice attends the conference is Round to one decimal place as needed d The probability that Dominique stays home is Round to one decimal place as needed 2

Statistics
ProbabilityAccording to a survey the probability that a randomly selected worker primarily drives a van to work is 0 861 The probability that a randomly selected worker primarily takes public transportation to work 0 047 Complete parts a through d OECOR a What is the probability that a randomly selected worker primarily drives a van or takes public transportation to work P worker drives a van or takes public transportation to work Type an integer or decimal rounded to three decimal places as needed b What is the probability that a randomly selected worker primarily neither drives a van nor takes public transportation to work P worker neither drives a van nor takes public transportation to work Type an integer or decimal rounded to three decimal places as needed c What is the probability that a randomly selected worker primarily does not drive a van to work P worker does not drive a van to work Type an integer or decimal rounded to three decimal places as needed d Can the probability that a randomly selected worker primarily walks to work equal 0 15 Why or why not A No The probability a worker primarily drives walks or takes public transportation would be less than 1 OB Yes The probability a worker primarily drives walks or takes public transportation would equal 1 OC No The probability a worker primarily drives walks or takes public transportation would be greater than 1 D Yes If a worker did not primarily drive or take public transportation the only other method to arrive at work would be to walk

Statistics
ProbabilityConsider the two questions shown below a Who is your favorite actor b How interested are you in playing on a hockey team Will the order in which the questions are asked affect the survey results If so what can the pollster do to alleviate this response bias Choose the correct answer below OA Yes question order will affect the survey results The pollster cannot do anything to alleviate this response bias OB Yes question order will affect the survey results The pollster should alternate the order of the questions given in the questionnaire so that different respondents receive questionnaires with the same questions but different question orderings OC No there is no obvious reason that question order would affect the survey results in this scenario D Yes question order will affect the survey results The pollster should try to make the questions more impartial

Statistics
ProbabilityWhat is a closed question What is an open question Discuss the advantages and disadvantages of each type of question What is a closed question What is an open question OA A closed question always has yes or no answers whereas an open question is a free response question OB A closed question has many correct answers whereas an open question has only one correct answer OC A closed question has fixed choices for answers whereas an open question is a free response question OD A closed question is a free response question whereas an open question has fixed choices for answers
Statistics
Probabilitymarketing company runs a web campaign that includes running an ad on the common platforms There are an average of 3 3 ad clicks per hour the Poisson distribution to find the probability that there are exactly 4 ad clicks in a given hour not round intermediate computations and round your answer to three decimal places necessary consult a list of formulas X S 4

Statistics
Probabilitythe time Suppose 13 flights are randomly selected and the number of on time flights is a Explain why this is a binomial experiment b Determine the values of n and p c Find and interpret the probability that exactly 9 flights are on time d Find and interpret the probability that fewer than 9 flights are on time e Find and interpret the probability that at least 9 flights are on time f Find and interpret the probability that between 7 and 9 flights inclusive are on time b Using the binomial distribution determine the values of n and p Type an integer or a decimal Do not round Type an integer or a decimal Do not round n p c Using the binomial distribution the probability that exactly 9 flights are on time is n