Questions
The best high school and college tutors are just a click away, 24×7! Pick a subject, ask a question, and get a detailed, handwritten solution personalized for you in minutes. We cover Math, Physics, Chemistry & Biology.

Calculus
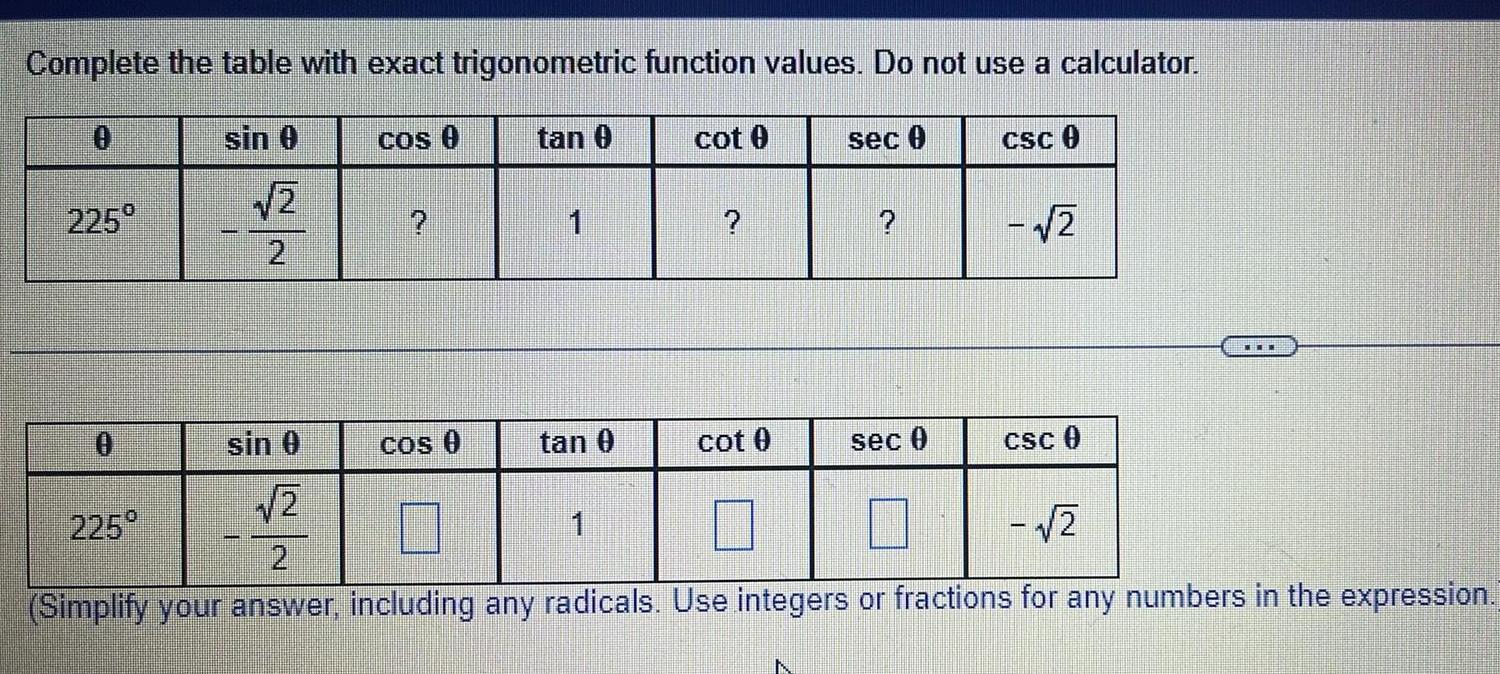
Application of derivativesComplete the table with exact trigonometric function values Do not use a calculator 0 225 sin 0 2 2 sin 0 2 COS COS tan 0 1 tan 0 cot 0 1 cot 0 sec sec CSC 2 CSC 0 1 225 2 Simplify your answer including any radicals Use integers or fractions for any numbers in the expression

Math - Others
Mathematical ReasoningSolve by completing the square and applying the square root property Express the solution set in exact simplest form 4m 2 28m 3 0 The solution set is 0 16 3

Math - Others
Linear Algebraolve the Inequality and write the solution set in Interval notation if possible Write numbers as simplified fractions or Integers 8 4x 19 5 The solution set is DO 0 0 Innl


Math - Others
Basic MathSolve by completing the square and applying the square root property Express the solution set in exact simplest form 2y y 2 6 3y

Math - Others
Basic Mathcomes to playing basketball and tall people are more efficient because they can ch the basket easily allowing for more points per game as well as more rebounds and blocked shots If you watch National Basketball Association NBA games regularly you certainly notice that many players are quite tall We will explore the distribution of NBA player heights using a sample of players active in the 2019 2020 season by making a histogram of HEIGHT INCHES with bins stating at 68 inches and bin width of 2 inches We will then determine the z scores for players who are 71 inches 5 11 and b 84 inches 7 0 The dataset consists of the NBA player s name team and height measured in inches for players active in the 2019 2020 season Aaron Gordon Player Aaron Holiday Adam Mokoka Abdel Nader Admiral Schofield WAS Z Variable symmetric Numerical Variable Team Height Inches ORL Data value a x x S IND LUSE SALT OKC Import the dataset into SALT for analyzing Data value b x x CHI After you have clicked the tab for your selected topic and read the problem answer the questions below a Use SALT to summarize the data and fill in the following table rounding values to four decimal places as needed Data value a is N 80 529 73 77 77 77 b Create a histogram with Starting Point and Bin Class Width values asked for The distribution for this variable is mound shaped and is Mean 78 393 Our sample s minimum value is not Standard Deviation 3 4505 c Determine the relative standing for the two data values of interest using the z score formula appropriate for samples Round your answers to two decimal places standard deviations below Median 78 Find the data value with a z score of 3 rounded to two decimal places x 2 5 X Minimum Value standard deviations above to determine the number of standard deviations each data value is away from the mean Find the data value with a z score of 3 rounded to two decimal places X Z S X 69 the mean whereas data value b is the mean Remember to take the absolute value of the z scort maximum is histogram in SALT it can be observed that almost all A Maximum Value 89 d Most data points are within three standard deviations of the mean In other words most observations will have a score that is larger than 3 and less than 3 at least roughly further than 3 standard deviations below the mean Our sample s further than 3 standard deviations above the mean Upon further inspection of the observations would have a z score between 3 and

Geometry
2D GeometryFind the exact value of csc CSC T IN Simplify your answer including any radicals Use integers or fractions for any numbers in
Calculus
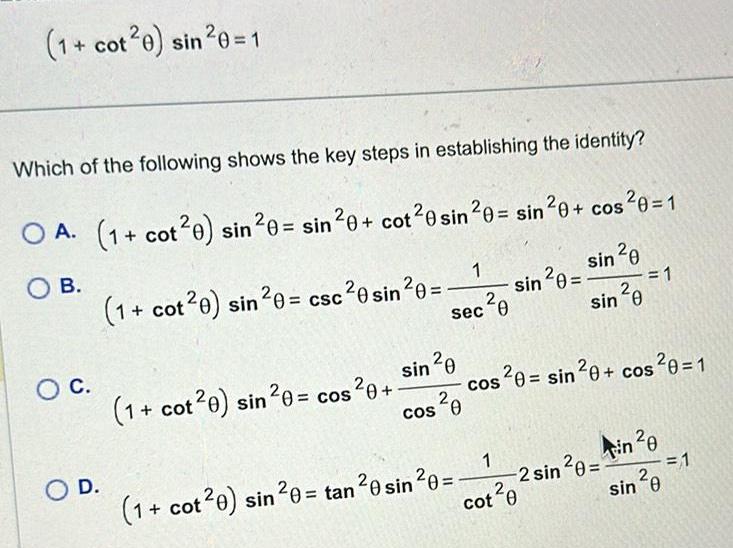
Limits & Continuity1 cot 0 sin 0 1 Which of the following shows the key steps in establishing the identity OA 1 cot20 sin 0 sin 0 cot 0 sin 0 sin 0 cos 0 1 OB sin 0 O C O D 1 cot20 sin 0 csc 0 sin 0 sin 20 1 cot 0 sin 0 cos 0 sec cos 0 0 1 ec 0 1 cot20 sin 0 tan 0 sin 0 sin 20 S 1 cot 0 sin 0 1 cos 20 sin 20 cos 0 1 2 sin 0 in 0 sin 0 1

Math - Others
Mathematical InductionMake an appropriate substitution and solve the equation 2 7 2 7 72 0 The solution set is 3

Math - Others
Simple & Compound Interest2 pints Manny a calendar year taxpayer uses the cash method of accounting for his sole proprietorship In late December he performed 42 000 of legal services for a client Manny typically requires his clients to pay his bills immediately upon receipt Assume Manny s marginal tax rate is 37 percent this year and next year and that he can earn an after tax rate of return of 7 percent on his investments Required a What is the after tax income if Manny sends his client the bill in December b What is the after tax income if Manny sends his client the bill in January Use Exhibit 3 1 Note Round your answer to the nearest whole dollar amount c Based on requirements a and b should Manny send his client the bill in December or January Complete this question by entering your answers in the tabs below Required A Required B Answer is complete but not entirely correct Required C What is the after tax income if Manny sends his client the bill in December

Math - Others
Inverse Trigonometric functionsReaction time is the amount of time it takes to respond to a stimulus and for automobile drivers it is an important factor in staying safe while on the road by avoiding rear end collisions Reaction times vary from driver to driver and tend to be longer than one might think A recent study determined that the time for an in traffic driver to react to a brake signal from standard brake lights can be modeled with a normal distribution having mean value 1 24 seconds and standard deviation of 0 45 seconds If we let X denote reaction time for automobile drivers use the appropriate Normal Distribution to determine each of the following 1 What is the probability that a driver has a reaction time less than 0 6 seconds 2 Approximately what proportion of drivers have a reaction time more than 2 5 seconds 3 Within what limits centered about the mean would you expect driver reaction times to lie with 95 probability What are the z scores for these limits 4 What is the reaction time for which only 1 of drivers have a shorter reaction time What is its z score 5 What is the reaction time for which only about 5 of drivers have a longer reaction time What is its z score 4 X 6 Approximately what proportion of drivers have a reaction time within three standard deviations of the mean After you have clicked the tab for your selected topic and read the problem answer the questions below a To model the random variable X defined by the selected scenario use the Normal Distribution with mean 1 24 and standard deviation 0 45 USE SALT b Determine each of the following values rounded to four decimal places 1 2 3 The smaller value is The larger value is 5 X Z score with a corresponding z score of with a corresponding z score of
Calculus
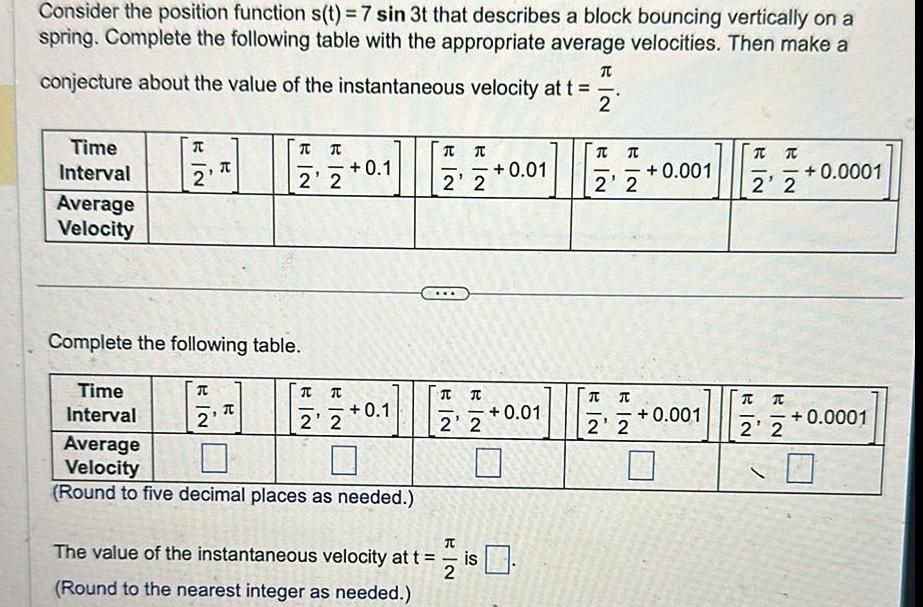
Vector CalculusConsider the position function s t 7 sin 3t that describes a block bouncing vertically on a spring Complete the following table with the appropriate average velocities Then make a conjecture about the value of the instantaneous velocity at t 2 Time Interval Average Velocity T 2 Time Interval Complete the following table 2 T 2 2 T T 2 2 0 1 0 1 Average Velocity Round to five decimal places as needed T T 2 2 EIN EN 2 2 T The value of the instantaneous velocity at t Round to the nearest integer as needed 2 is 0 01 0 01 T B EN 2 2 T 2 2 0 001 0 001 T 2 2 KIN T T 2 2 0 0001 0 0001


Math - Others
Basic MathMake an appropriate substitution and solve the equation 9x 3 3 9x 3 108 0 The solution set is 0 0
Calculus
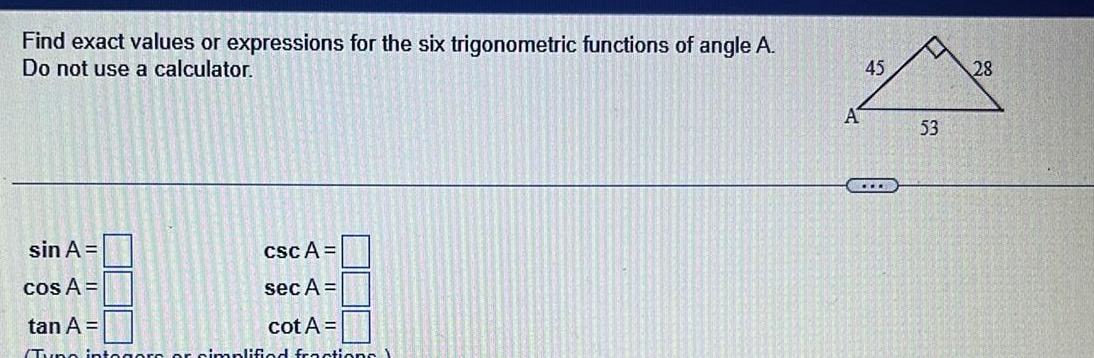
Application of derivativesFind exact values or expressions for the six trigonometric functions of angle A Do not use a calculator sin A cos A tan A Tuno csc A sec A cot A gore or simplified fractions A 45 53 28
Calculus
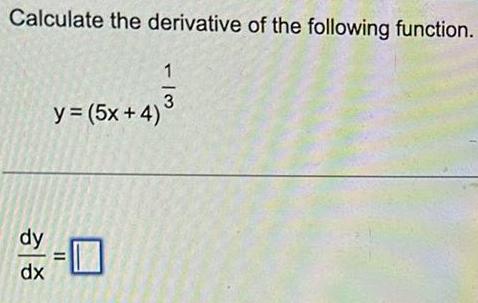
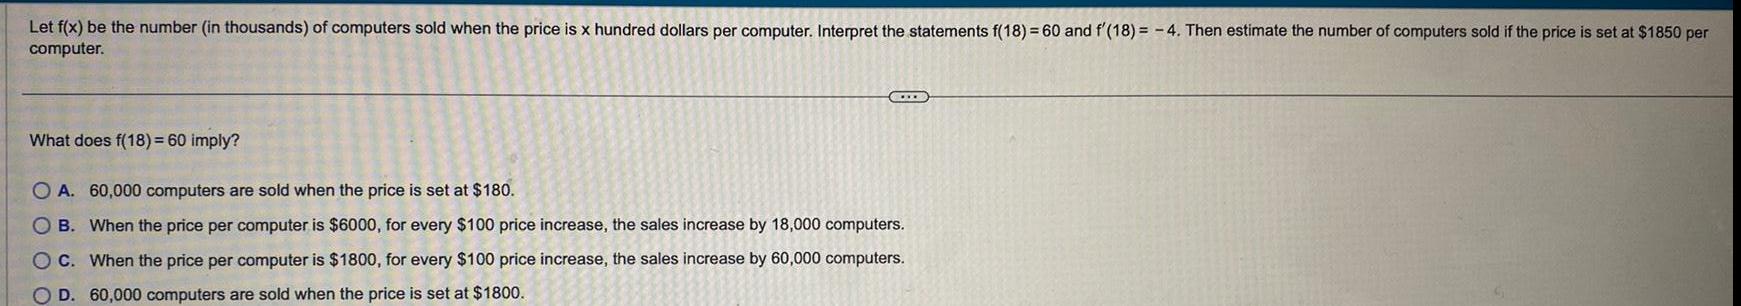
Application of derivativesLet f x be the number in thousands of computers sold when the price is x hundred dollars per computer Interpret the statements f 18 60 and f 18 4 Then estimate the number of computers sold if the price is set at 1850 per computer What does f 18 60 imply OA 60 000 computers are sold when the price is set at 180 B When the price per computer is 6000 for every 100 price increase the sales increase by 18 000 computers OC When the price per computer is 1800 for every 100 price increase the sales increase by 60 000 computers O D 60 000 computers are sold when the price is set at 1800
Calculus
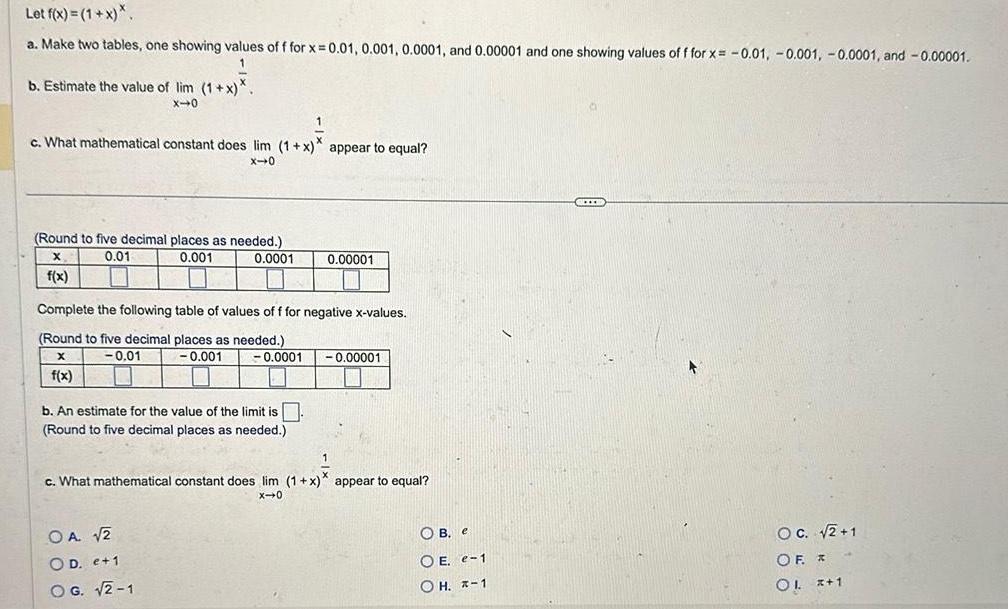
Application of derivativesLet f x 1 x a Make two tables one showing values of f for x 0 01 0 001 0 0001 and 0 00001 and one showing values of f for x 0 01 0 001 0 0001 and 0 00001 1 b Estimate the value of lim 1 x X 0 1 c What mathematical constant does lim 1 x appear to equal x 0 Round to five decimal places as needed X 0 01 0 001 0 0001 f x Complete the following table of values of f for negative x values Round to five decimal places as needed X 0 01 0 001 0 0001 f x b An estimate for the value of the limit is Round to five decimal places as needed 0 00001 OA 2 OD e 1 OG 2 1 0 00001 1 c What mathematical constant does lim 1 x appear to equal X 0 OB e OE e 1 OH 1 II OC 2 1 OF OL x 1
Calculus
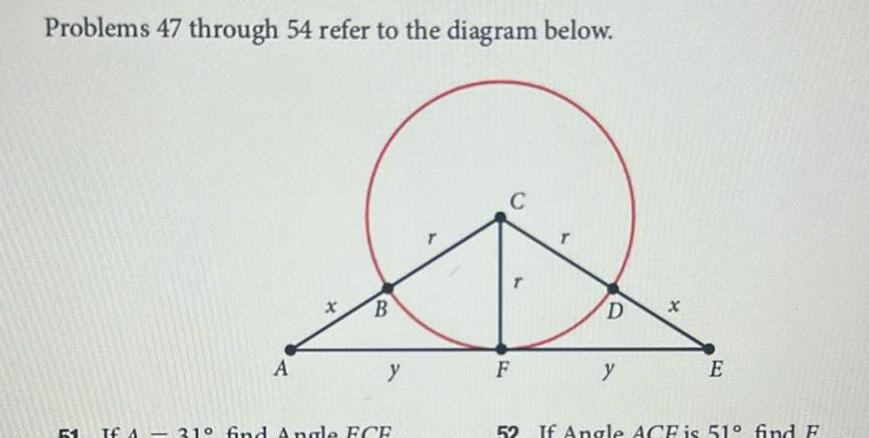
Application of derivativesProblems 47 through 54 refer to the diagram below Y A B y TE A 31 find Angle FCE C F T D y X E 52 If Angle ACE is 51 find F

Math - Others
Inverse Trigonometric functionsSuppose that a linear system has fewer equations than variables What can you determine about the solution set of the system

Math - Others
Mathematical InductionTawana owns and operates a sole proprietorship and has a 37 percent marginal tax rate She provides her son Jonathon 17 000 a year for college expenses Jonathon works as a pizza delivery person every fall and has a marginal tax rate of 15 percent Required a What could Tawana do to reduce her family tax burden b How much pretax income does it currently take Tawana to generate the 17 000 after taxes given to Jonathon c If Jonathon worked for his mother s sole proprietorship what salary would she have to pay him to generate 17 000 after taxes ignoring any Social Security Medicare or self employment tax issues d How much money would the strategy in part c save Complete this question by entering your answers in the tabs below Required A Required B Answer is not complete Required C Required D How much money would the strategy in part c save


Math - Others
Basic Mathin pounds lbs We will treat a subset of this dataset as a representative sample of realized values for our random variable The first five rows of the data look like this Weight in lbs 4 9 12 0 9 2 9 5 6 1 Import the dataset into SALT for analyzing After you have clicked the tab for your selected topic and read the problem answer the questions below a Create a histogram in SALT to determine if the distribution of our sample is mound shaped and symmetric with no outliers When a data s distribution is mound shaped and at least roughly symmetric with no outliers a normal distribution can be used to model the variable s behavior USE SALT Since the histogram for our sample is mound shaped and is O at least roughly symmetric with no outliers the normal distribution can be used to approximate the behavior for this random variable b Locate the sample mean and standard deviation for our variable Round your answers to four decimal places X X S c Draw the normal distribution with a mean of x and a standard deviation of s on SALT s Distribution Calculators page Round your answers to two decimal places The random variable value that is predicted to be one standard deviation above the mean is The random variable value that is predicted to be two standard deviations below the mean is The random variable that is predicted to have a z score of 3 00 is X x x x d Use the Probability and Z Score sections on the left panel and radio buttons on the right panel to answer the following questions Remember to convert the percentage to a proportion before entering the value into SALT Round your answers to four decimal places Approximately 2 8 of values for our random variable are predicted to be larger than what value Approximately 90 of values for our random variable are expected predicted to be centered around the mean with a lower value of X and an upper value of The Z scores for these two values are Z X and z e How well is the normal distribution modeling the random variable represented by our sample data Use SALT s data filters and Descriptive Statistics page to answer the following questions In part d you found the boundary values where the normal model predicts the middle 90 of data values are located Use the filters on the Dataset page to filter out observations that are outside of this range then return to the Descriptive Statistics page to locate the number of sample values within this region There are sample values within this region Remove the filter and return to the Descriptive Statistics page There are values in the entire sample Use these two counts to determine the actual proportion of sample values within this region Rounded to three decimal places the proportion of sample values within this middle region is How different are the actual and predicted proportions Subtract the predicted proportion from the actual proportion and take the absolute value of the result to determine how different they are Calculate the following quantity difference in proportions actual proportion predicted proportion Also in part d you found the boundary value that the normal model predicts 2 8 of values are larger than Enter this value into SALT s data filter and determine the number of sample values that meet this criteria There are sample values within this region Use this count and the size of the sample to determine the actual proportion of sample values within this region Rounded to three decimal places the proportion of sample values within this region is How different are the actual and predicted proportions Subtract the predicted proportion from the actual proportion and take the absolute value of the result to determine how different they are Calculate the following quantity difference in proportions actual proportion predicted proportion


Math - Others
Mathematical Inductionin pounds lbs We will treat a subset of this dataset as a representative sample of realized values for our random variable The first five rows of the data look like this Weight in lbs 4 9 12 0 9 2 9 5 6 1 Import the dataset into SALT for analyzing After you have clicked the tab for your selected topic and read the problem answer the questions below a Create a histogram in SALT to determine if the distribution of our sample is mound shaped and symmetric with no outliers When a data s distribution is mound shaped and at least roughly symmetric with no outliers a normal distribution can be used to model the variable s behavior USE SALT Since the histogram for our sample is mound shaped and is O at least roughly symmetric with no outliers the normal distribution can be used to approximate the behavior for this random variable b Locate the sample mean and standard deviation for our variable Round your answers to four decimal places X X S c Draw the normal distribution with a mean of x and a standard deviation of s on SALT s Distribution Calculators page Round your answers to two decimal places The random variable value that is predicted to be one standard deviation above the mean is The random variable value that is predicted to be two standard deviations below the mean is The random variable that is predicted to have a z score of 3 00 is X x x x d Use the Probability and Z Score sections on the left panel and radio buttons on the right panel to answer the following questions Remember to convert the percentage to a proportion before entering the value into SALT Round your answers to four decimal places Approximately 2 8 of values for our random variable are predicted to be larger than what value Approximately 90 of values for our random variable are expected predicted to be centered around the mean with a lower value of X and an upper value of The Z scores for these two values are Z X and z e How well is the normal distribution modeling the random variable represented by our sample data Use SALT s data filters and Descriptive Statistics page to answer the following questions In part d you found the boundary values where the normal model predicts the middle 90 of data values are located Use the filters on the Dataset page to filter out observations that are outside of this range then return to the Descriptive Statistics page to locate the number of sample values within this region There are sample values within this region Remove the filter and return to the Descriptive Statistics page There are values in the entire sample Use these two counts to determine the actual proportion of sample values within this region Rounded to three decimal places the proportion of sample values within this middle region is How different are the actual and predicted proportions Subtract the predicted proportion from the actual proportion and take the absolute value of the result to determine how different they are Calculate the following quantity difference in proportions actual proportion predicted proportion Also in part d you found the boundary value that the normal model predicts 2 8 of values are larger than Enter this value into SALT s data filter and determine the number of sample values that meet this criteria There are sample values within this region Use this count and the size of the sample to determine the actual proportion of sample values within this region Rounded to three decimal places the proportion of sample values within this region is How different are the actual and predicted proportions Subtract the predicted proportion from the actual proportion and take the absolute value of the result to determine how different they are Calculate the following quantity difference in proportions actual proportion predicted proportion
Calculus
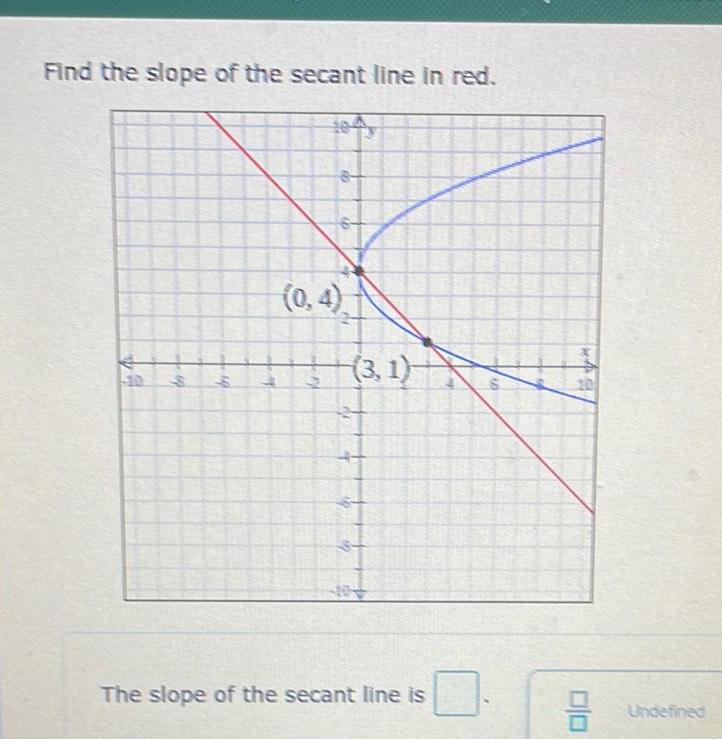
Limits & ContinuityFind the slope of the secant line in red 510 to br p 09 ind 10 0 4 3 1 The slope of the secant line is 00 Undefined


Statistics
Statistics1 ok int rint erences Hui is currently considering investing in municipal bonds that earn 8 40 percent interest or in taxable bonds issued by the Coca Cola Company that pay 11 20 percent Required a If Hui s tax rate is 22 percent which bond should he choose b Which bond should he choose if his tax rate is 32 percent c At what tax rate would he be indifferent between the bonds d What strategy is this decision based upon Complete this question by entering your answers in the tabs below Required A Required B Required C Required D If Hui s tax rate is 22 percent which bond should he choose
Calculus
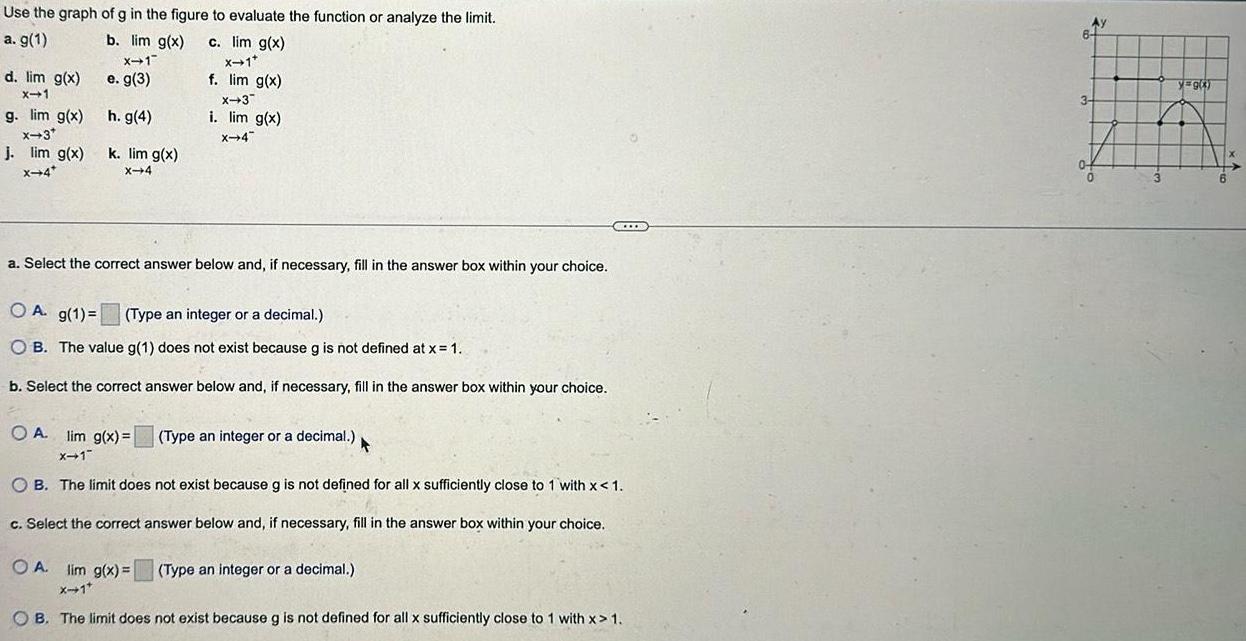
Application of derivativesUse the graph of g in the figure to evaluate the function or analyze the limit a g 1 b lim g x c lim g x X 1 X 1 e g 3 f lim g x h g 4 k lim g x X 4 d lim g x X 1 g lim g x x 3 j lim g x x 4 X 3 i lim g x X 4 a Select the correct answer below and if necessary fill in the answer box within your choice A g 1 Type an integer or a decimal OB The value g 1 does not exist because g is not defined at x 1 b Select the correct answer below and if necessary fill in the answer box within your choice OA lim g x X 1 OB The limit does not exist because g is not defined for all x sufficiently close to 1 with x 1 c Select the correct answer below and if necessary fill in the answer box within your choice Type an integer or a decimal F OA lim g x Type an integer or a decimal X 1 OB The limit does not exist because g is not defined for all x sufficiently close to 1 with x 1 AY 3 0 yag
Calculus
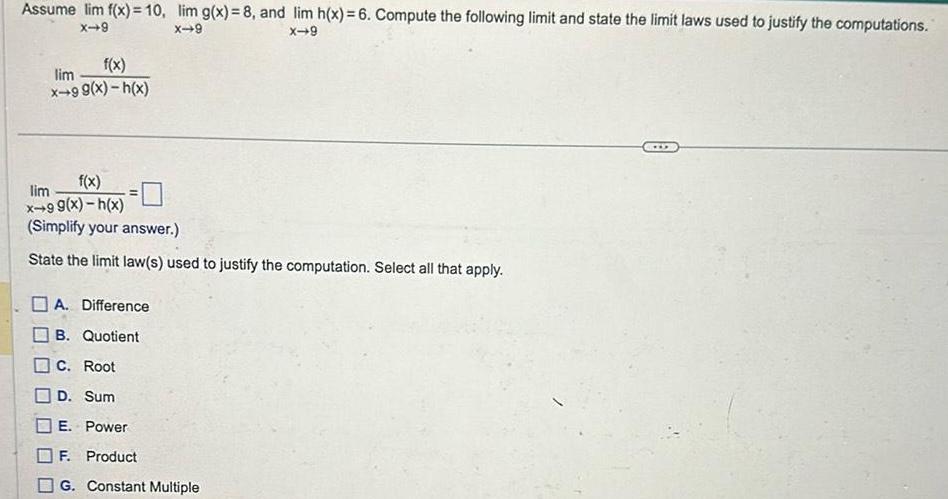
Limits & ContinuityAssume lim f x 10 lim g x 8 and lim h x 6 Compute the following limit and state the limit laws used to justify the computations X 9 X 9 X 9 f x lim x 99 x h x f x x 99 x h x Simplify your answer State the limit law s used to justify the computation Select all that apply lim A Difference B Quotient C Root D Sum E Power F Product G Constant Multiple D
Calculus
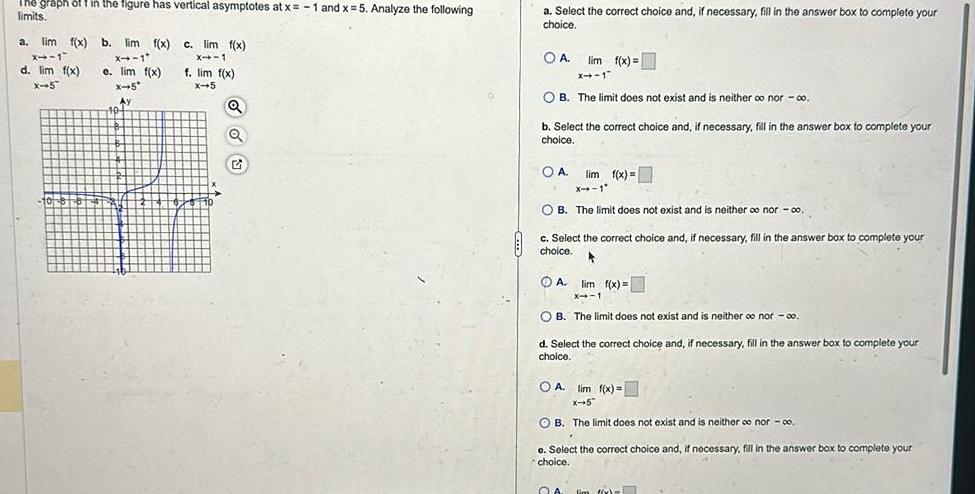
Application of derivativesThe graph off in the figure has vertical asymptotes at x 1 and x 5 Analyze the following limits a lim f x b lim f x x 1 X 1 e lim f x d lim f x x 5 X 5 Ay 10 c lim f x X 1 f lim f x X 5 Q Q a Select the correct choice and if necessary fill in the answer box to complete your choice OA lim f x x 1 OB The limit does not exist and is neither co nor co b Select the correct choice and if necessary fill in the answer box to complete your choice OA lim f x X 1 OB The limit does not exist and is neither oo nor co c Select the correct choice and if necessary fill in the answer box to complete your choice 4 A lim f x X 1 OB The limit does not exist and is neither oo nor co d Select the correct choice and if necessary fill in the answer box to complete your choice OA lim f x X 5 OB The limit does not exist and is neither co nor 00 e Select the correct choice and if necessary fill in the answer box to complete your choice QA lim f x
Calculus
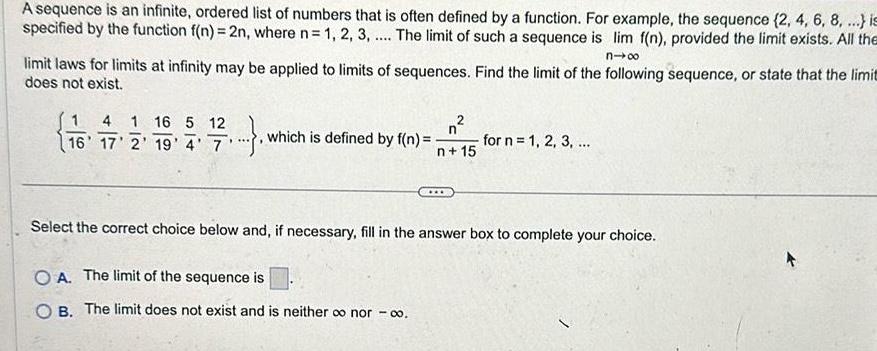
DifferentiationA sequence is an infinite ordered list of numbers that is often defined by a function For example the sequence 2 4 6 8 is specified by the function f n 2n where n 1 2 3 The limit of such a sequence is lim f n provided the limit exists All the nx limit laws for limits at infinity may be applied to limits of sequences Find the limit of the following sequence or state that the limit does not exist 1 4 1 16 5 12 16 17 2 19 4 7 which is defined by f n n 15 for n 1 2 3 Select the correct choice below and if necessary fill in the answer box to complete your choice OA The limit of the sequence is B The limit does not exist and is neither o nor 00
Calculus
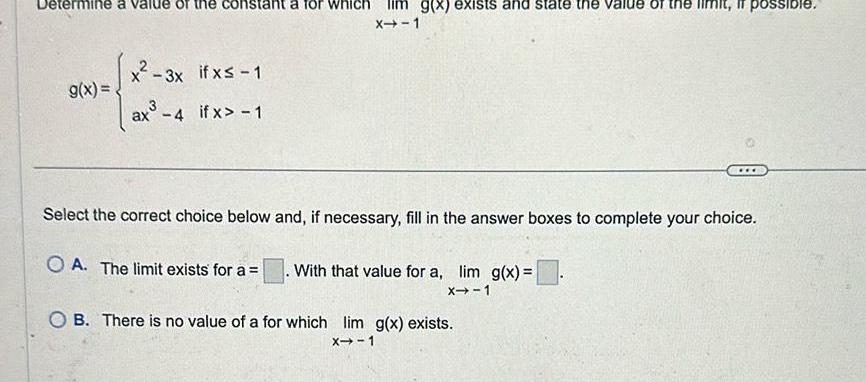
Application of derivativesrmine a value of the g x x 3x 3x if x 1 ax 4 if x 1 ant a for wh X 1 g x exists and state the value of the limi possible Select the correct choice below and if necessary fill in the answer boxes to complete your choice OA The limit exists for a With that value for a lim g x X 1 OB There is no value of a for which lim g x exists X 1
Calculus
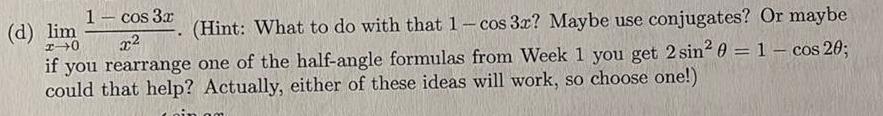
Limits & Continuity1 cos 3x Hint What to do with that 1 cos 3x Maybe use conjugates Or maybe x if you rearrange one of the half angle formulas from Week 1 you get 2 sin 0 1 cos 20 could that help Actually either of these ideas will work so choose one d lim 20
Calculus
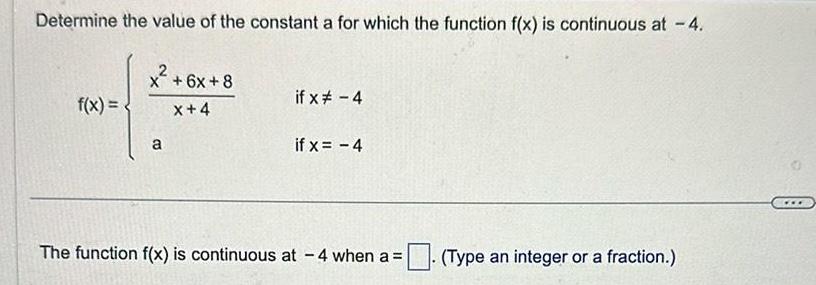
Application of derivativesDetermine the value of the constant a for which the function f x is continuous at 4 x 6x 8 X 4 a if x 4 if x 4 The function f x is continuous at 4 when a Type an integer or a fraction O

Algebra
Quadratic equationsGiven the following functions find each f x x 3x 4 g x x 4 f g x f g x f g x
Calculus
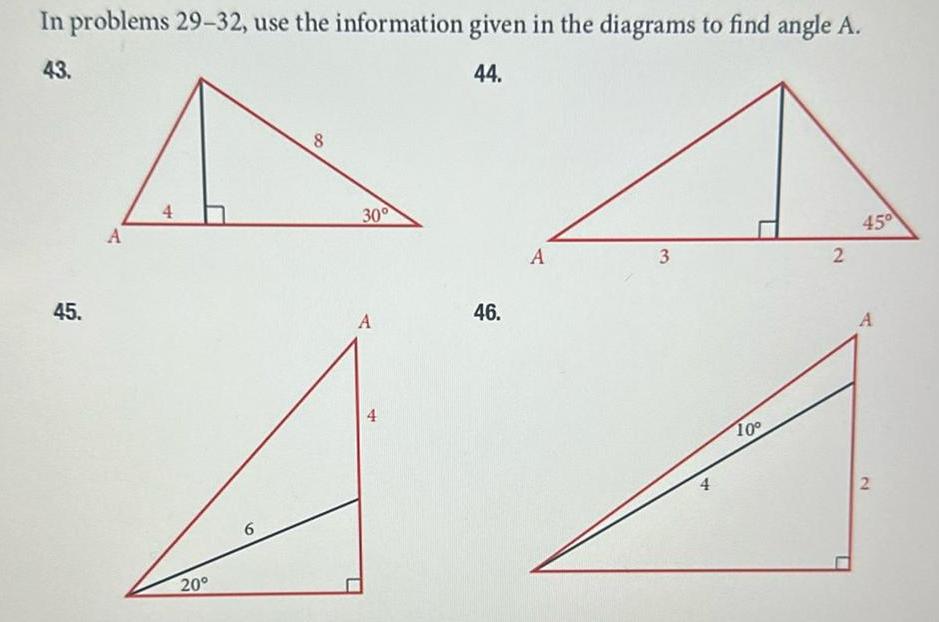
Limits & ContinuityIn problems 29 32 use the information given in the diagrams to find angle A 43 44 45 A 4 20 6 8 30 A 4 46 A 3 10 2 45 A 2

Geometry
Coordinate systemWhat is the missing angle in radians Verify the following identities 1 CSCX tan T 2 secx sin x tan x csc x 2 2 tan x CSC CSCX cos x cot x Bec x

Anatomy and Physiology
Introduction to PhysiologyQ4 1 1 Point We want to remove Land bubble up from H and L to K What color does H become red black double black negative red Save Answer Last saved on Jan 29 at 12 58 PM Q4 2 1 Point What color does K become red black double black negative red Save Answer Last saved on Jan 29 at 12 59 PM Q4 3 1 Point After the double black elimination shown at the beginning of thi question what is the parent of L J H G Q4 4 1 Point Now let s remove L Is the result a valid red black tree Yes No Save Answer
Calculus
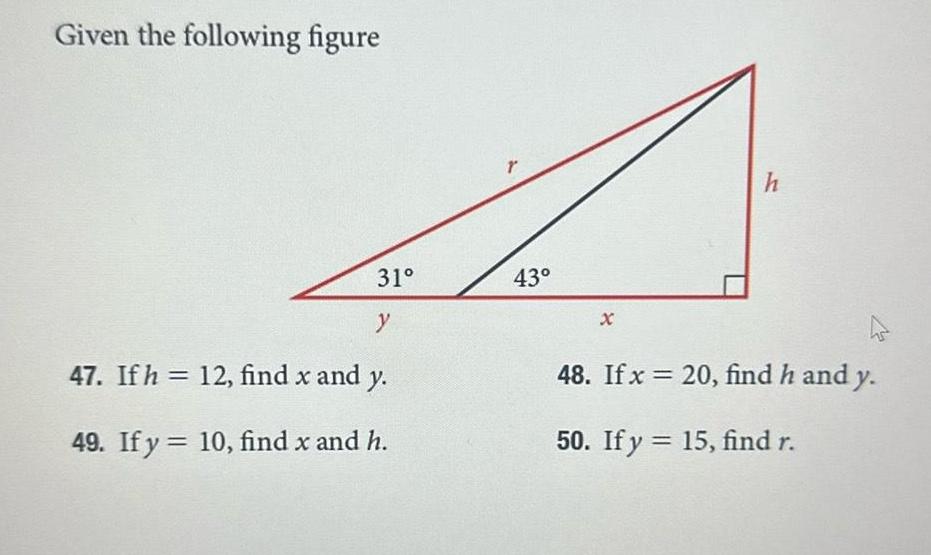
DifferentiationGiven the following figure 31 y 47 If h 12 find x and y 49 If y 10 find x and h r 43 h 48 If x 20 find h and y 50 If y 15 find r
Calculus
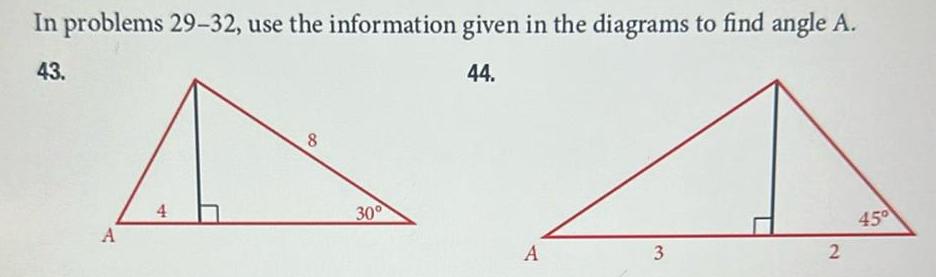
Application of derivativesIn problems 29 32 use the information given in the diagrams to find angle A 43 44 A 4 8 30 A 3 2 45

Geometry
Coordinate systemEven f x f x Symmetric Identities Even Odd y sinx sinx is sin x A A A A A y cs cx U V A 1 Fev Odd f x f x CSCX is csc x Verify the following identities 1 sinxcsd x 1 y cOSA A A COSX is cos x y secx W ALA secx is sed x 2 cod y tanx tanx is tan x y cotx cotx is cot x

Algebra
Quadratic equationsQuestion Consider the region bounded by the graphs of y x y 17 and x 6 in the first quadrant What is the volume of solid obtained by rotating this region about the line x 2 Select the correct answer below 17 2 O af Ty 6 16 dy JU 17 Ty 4 36 dy 17 OT Ty 2 16 dy LF 01 26 14
Calculus
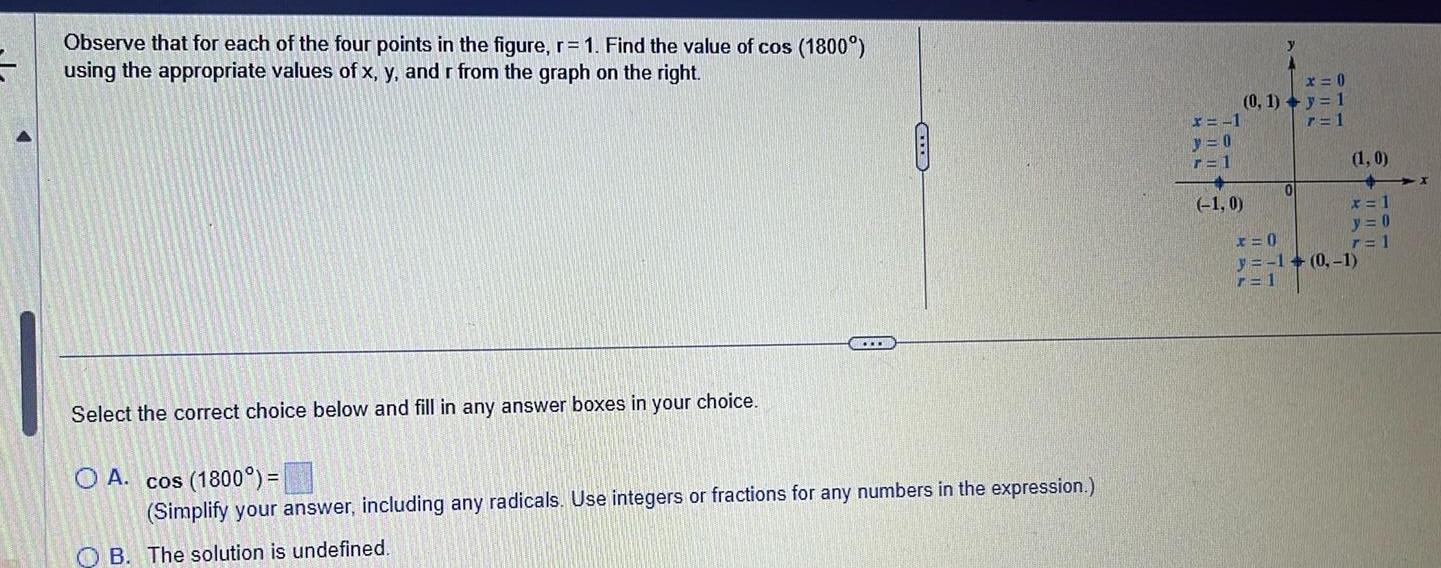
Application of derivativesObserve that for each of the four points in the figure r 1 Find the value of cos 1800 using the appropriate values of x y and r from the graph on the right www Select the correct choice below and fill in any answer boxes in your choice O A cos 1800 Simplify your answer including any radicals Use integers or fractions for any numbers in the expression B The solution is undefined y x 0 0 1 y 1 7 1 x 1 y 0 r 1 1 0 0 1 0 x 1 y 0 r 1 x 0 y 1 0 1 r 1

Math - Others
Inverse Trigonometric functionswhere R is the Sem how that Ifrsino drido 24 R 3 Y 29 Cose above The Intial line 020 circle

Statistics
ProbabilityForty plasma TVs were tested and the number of watts per hour they used recorded Given that the lowest value is 429 find the class limits to be used in the construction of a frequency distribution for the data with 6 classes and a class width of w 13 Begin the first class with the smallest data value given above and write the limits for the classes in the table provided in the answer box below

Algebra
Quadratic equationsFind the magnitude of the vector given below Also find the measure in degrees of the acute angle formed by the vector and x axis Do not round any intermediate computations and round your responses to 2 decimal places y 0 a magnitude of the vector b 0 X

Geometry
Coordinate system2 9 4 0 1 0 1 m 0 x 4 x0 3 1 4 0 4 1 60 4 and 1 8 X 12 5 6 Write in slope intercept form y x 2 4 and 1 3 X Ya X Y 7X2 y 8 4 m 2 c 10 Y 2m 4 C 8 X 1 and y 3 9 3 m 1 c m 3 tc 23 44c My 3 C MEI 261 4 c 2 4 C Y mX C 13 2 Find the slope 2 points Use the first point and slope to go into point slope form 1 pt Distribute 2 points Isolate y 2 points Final Answer 1 point Find the slope 2 points Use the first point and slope to go into point slope form 1 pt Distribute 2 points Isolate y 2 points Final Answer 1 point