Statistics Questions
The best high school and college tutors are just a click away, 24×7! Pick a subject, ask a question, and get a detailed, handwritten solution personalized for you in minutes. We cover Math, Physics, Chemistry & Biology.

Statistics
Probabilitydata to uct the relative quency Natural births randomly selected from four hospitals in New York State occurred on the days of the week in the order of Monday through Sunday with the frequencies 54 66 72 55 53 46 54 Does it appear that such births occur on the days of the week with equal frequency Construct the relative frequency distribution Relative Frequency Day Monday Tuesday Wednesday Thursday Friday Saturday Sunday

Statistics
Statisticsthe weights appear to be reported or actually measured What can be said about the accuracy of the results 0000000011223445555555555668899 Complete the frequency distribution below Last digit Frequency 0 1 2 3 4 Type integers or decimals Last digit Frequency 67856 9

Statistics
StatisticsMany families in California are using backyard structures for home offices art studios and hobby areas as well as for additional storage Suppose that the mean price for a customized wooden shingled backyard structure is 3 100 Assume that the standard deviation is 1 400 a What is the z score for a backyard structure costing 2 400 Round your answer to two decimal places Z b What is the z score for a backyard structure costing 6 600 Z c Interpret the z scores in parts a and b Comment on whether either should be considered an outlier The cost 2 400 is 0 5 standard deviations Select the mean therefore it is Select therefore it is Select Z d The cost for a backyard shed office combination built in Albany California is 11 850 Compute the z score for this structure Should this structure be considered an outlier Explain This structure is Select because the z score is Select The cost 6 600 is 2 50 standard deviations Select the r 6 37 A C v

Statistics
StatisticsF Weights of 67 college students in kilograms in September of freshman year are provided in the accompanying data set Construct a frequency distribution Begin with a lower class limit of 40 kg and use a class width of 10 kg Does the distribution appear to be a normal distribution Click the icon to view the freshman weights Construct the frequency distribution Weight kg Frequency 40 Type integers or decimals Do not round

Statistics
StatisticsDoes the frequency distribution appear to have a normal distribution Explain Choose the correct answer below F 45 49 50 54 55 59 60 64 65 69 70 74 75 79 37474 C 3 12 OA Yes because the frequencies start low proceed to one or two high frequencies then increase to and the distribution is not symmetric OB No because the frequencies start low proceed to one or two high frequencies then decrease to a low frequency and the distribution is approximately symmetric OC Yes because the frequencies start low proceed to one or two high frequencies then decrease to a low frequency and the distribution is approximately symmetric two high frequencies then decrease to a

Statistics
StatisticsConsider a sample with data values of 26 24 21 16 31 33 29 and 24 Compute the 20th 25th 65th and 75th percentiles 20th percentile 25th percentile 65th percentile 75th percentile

Statistics
StatisticsThe accompanying data set lists the F scale intensities of recent tornadoes in the United States Construct a frequency distribution Do the intensities appear to have a normal distribution Assume that the intensities are quantitative Click the icon to view the F scale intensities Complete the frequency distribution F Scale Intensity 0 Frequency

Statistics
ProbabilityConsider a sample with data values of 7 19 8 15 and 11 Compute the z score for each of the five observations z score for 7 z score for 19 Z score for 8 z score for 15 z score for 11

Statistics
Statisticse following table displays round trip flight prices from 14 major U S cities to Atlanta and Salt Lake City Round Trip Cost Departure City Cincinnati New York Chicago Denver Los Angeles Seattle Detroit Philadelphia Washington D C Miami San Francisco Las Vegas Phoenix Dallas Atlanta 339 10 320 60 292 60 339 60 360 60 383 60 309 60 415 60 292 60 250 60 538 60 456 60 358 60 332 90 Salt Lake City 570 10 355 60 465 60 218 60 312 60 297 60 472 60 619 40 512 60 524 20 380 60 160 60 268 60 458 60 a Compute the mean price for a round trip flight into Atlanta and the mean price for a round trip flight into Salt Lake City Round your answers to two deci

Statistics
StatisticsThe Graduate Management Admission Test GMAT is a standardized exam used by many universities as part of the assessment for admission to graduate study in busines The average GMAT score is 547 t Assume that GMAT scores are bell shaped with a standard deviation of 100 a What percentage of GMAT scores are 647 or higher b What percentage of GMAT scores are 747 or higher c What percentage of GMAT scores are between 447 and 547 d What percentage of GMAT scores are between 447 and 747 6 24 C M

Statistics
StatisticsP G Adjusted Stock Price Apple Adjusted Stock Price bie The DATAfile StockComparison contains monthly adjusted stock prices for technology company Apple Inc and consumer goods company Procter Gamble P G from 2013 2018 a Develop a scatter diagram with Apple stock price on the horizontal axis and P G stock price on the vertical axis 100 200 O 80 60 40 20 0 0 200 150 100 50 0 nload 0 50 150 Apple Adjusted Stock Price 100 parison xlsx 20 60 40 80 P G Adjusted Stock Price 200 Interpret the sample covariance 100 DO O Apple Adjusted Stock Price 150 100 50 0 c Compute the sample covariance Round your answer to two decimal places 60 40 P G Adjusted Stock Price 20 80 100 DO P G Adjusted Stock Price 100 80 60 40 20 b What appears to be the relationship between these two stock prices The scatter diagram shows Select relationship with Select Apple stock prices associated with higher P G stock prices 0 50 150 Apple Adjusted Stock Price 100 200

Statistics
StatisticsConsider a sample with data values of 10 20 14 12 and 11 Compute the range and interquartile range range interquartile range

Statistics
StatisticsConsider a sample with data values of 10 20 12 17 and 16 Compute the variance and standard deviation sample variance sample standard deviation
Statistics
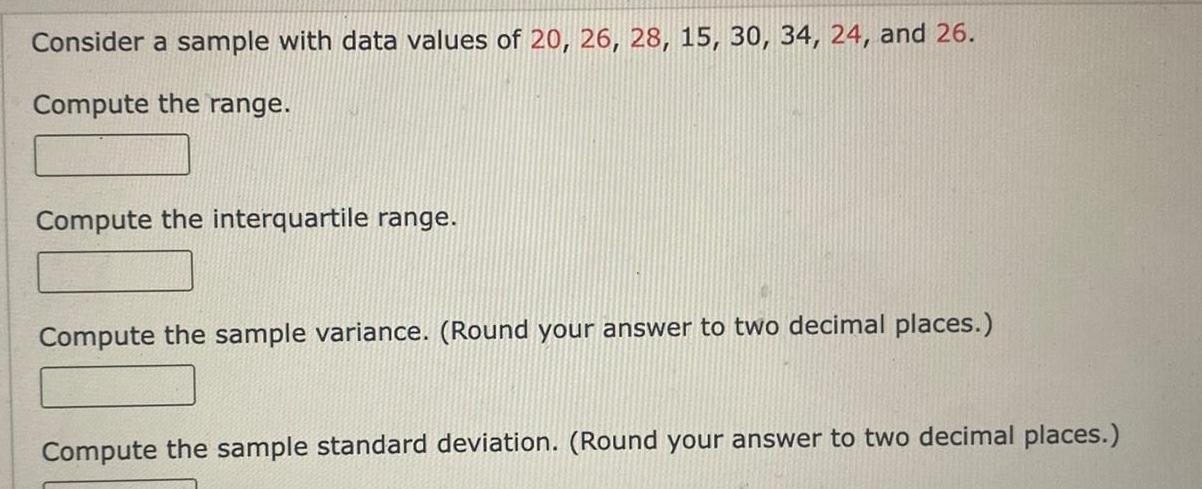
ProbabilityConsider a sample with data values of 20 26 28 15 30 34 24 and 26 Compute the range Compute the interquartile range Compute the sample variance Round your answer to two decimal places Compute the sample standard deviation Round your answer to two decimal places

Statistics
StatisticsFive observations taken for two variables follow 20 18 16 14 12 10 8 6 4 2 0 O 0 a Develop a scatter diagram for these data y y 20 X 6 Y 7 8 18 16 14 12 10 8 6 4 2 11 5 15 21 27 7 17 11 10 15 20 25 30 X y 20 18 16 14 12 10 8 6 4 2 0 5 10 15 20 25 X 30 O 20 y 18 16 14 12 10 8 6 4 2 0 0 5 10 15 20 2

Statistics
Statistics80 70 60 50 40 30 20 10 0 0 80 70 60 50 40 30 20 10 Develop a scatter diagram with x on the horizontal axis y 0 11 3 5 Y 50 60 40 60 30 16 10 10 15 15 20 X X 20 y 80 70 60 50 40 30 20 10 0 0 y 80 70 60 50 40 30 20 10 0 0 5 10 10 15 15

Statistics
StatisticsThe creator of a new online multiplayer survival game has been tracking the monthly downloads of the newest game The following table shows the monthly downloads housands for each month of the current and previous year Round your answers to the nearest whole number Month previous year February March April May June July August September October November December Downloads thousands 33 34 34 32 32 35 34 37 37 35 33 Month current year January February March April May June July August September October Downloads thousands 37 37 37 38 37 36 37 35 33 32 a Compute the mean median and mode for number of downloads in the previous year mean median mode

Statistics
StatisticsConsider a sample with data values of 10 20 21 12 18 and 15 Compute the mean and median mean median

Statistics
StatisticsConsider a sample with data values of 52 54 70 58 64 57 52 69 57 68 and 52 Compute the mean Round your answer to two decimal places Compute the median Compute the mode

Statistics
StatisticsYou may need to use the appropriate technology to answer this question To study the effect of temperature on yield in a chemical process five batches were produced at each of three temperature levels The results follow Source of Variation 50 C 60 C 70 C Treatments Error Total 34 Temperature 23 36 38 29 29 31 35 22 28 24 29 Construct an analysis of variance table Round your values for MSE and F to two decimal places and your p value to four decimal places 27 29 36 Sum Degrees of Squares of Freedom Mean Square jue hunsthases F p value Use a 0 05 level of significance to test whether the temperature level has an effect on the mean yield of the process

Statistics
StatisticsYou may need to use the appropriate technology to answer this question A company manufactures printers and fax machines at plants located in Atlanta Dallas and Seattle To measure how much employees at these plants know about quality management a random sample of 6 employees was selected from each plant and the employees selected were given a quality awareness examination The examination scores for these 18 employees are shown in the following table The sample means sample variances and sample standard deviations for each group are also provided Managers want to use these data to test the hypothesis that the mean examination score is the same for all three plants Sample mean Treatments Error Sample variance Sample standard deviation Plant 1 Atlanta 86 76 82 75 72 89 80 45 2 6 72 Plant 2 Dallas 72 74 73 74 68 83 74 24 4 4 94 Plant 3 Seattle Degrees of Freedom 58 64 62 69 75 62 65 Set up the ANOVA table for these data Round your values for MSE and F to two decimal places and your p value to four decimal places Sum Source of Variation of Squares 36 8 6 07 Mean Square F p value

Statistics
Statisticsj 1 The given data are below 7 x j 1 SSTR k n x 7 2 Sample mean Sample variance XatXBtxc k 29 45 37 Treatment Treatment A B 33 29 30 25 28 29 8 50 44 42 45 46 48 45 5 00 Treatment C 34 36 There are 3 treatments so k Each treatment has 5 observations so nA nB nc The total number of observations is n A 8 ne Since each treatment has the same number of observations the overall sample mean for the k sample means is found as follows Find the overall sample mean 36 37 42 37 9 00


Statistics
StatisticsDetermine the value of c such that the function f x y cx y for 2 x 6 and 0 y 4 satisfies the properties of a joint probability density function Determine the following a Marginal probability distribution of X b P Y 1 c P X 2 Y 2 d P 2 5 X 4 5 Y 3 e E X f Var Y g Cov X Y h Cor X Y i Are X and Y independent Why or why not

Statistics
ProbabilityYou are playing a game where you must roll two 4 sided dice each die can yield a value of 1 2 3 or 4 The goal is to obtain a score of at least 6 You initially roll both dice and are allowed to reroll one of them the other die value must be kept For example if you roll the dice and obtain the results of 1 and 3 you will want to reroll the die with a value of 1 to try to get a higher value You do not need to roll again if your initial roll obtains a combined score of at least 6 Find the following a The probability that you succeed without needing to reroll the dice the odds that the values sum to at least 6 when you first roll both dice b In what scenario would you be unable to succeed after your first roll think what values must be present on both dice in which rerolling one of them will never allow them to sum to at least 6 What is the likelihood of this c You discover that one of the die is rigged and will always roll a 2 Given this information what is the chance of each of the following i You succeed in any given turn your chance to obtain a total score of 6 or greater given the initial rules ii After 5 tries you succeed at least 3 times iii You succeed exactly 5 times after 7 tries

Statistics
Statisticsou have noticed some variation in the amount of rice provided in your usual order of General so s Chicken You ask the store manager about this issue and they confirm that the reparation of your order isn t directly measured In each order you are supposed to be given cup of rice which should be 250 grams if measured exactly Based on data provided by the manager you find that the true amount of rice given follows a normal distribution with an verage of 252 grams and a standard deviation of 1 5 grams Given this information a How often will you receive less rice than you pay for less than 250 grams b If your rice container can only fit 256 grams how often will it overflow when your cook is filling it c If both these situations are considered as errors how many errors should you expect after ordering 10 times

Statistics
Statistics1 2 3 4 5 6 7 8 9 10 11 12 13 14 15 16 17 18 19 20 21 22 23 24 2 LO 5 4 4 5 3 3 5 5 3 1 4 st 3 4 4 LO 5 3 5 5 2 5 5 5 2

Statistics
StatisticsThe following stem and leaf plot was constructed using the number of telephone calls made by 20 executives during a randomly selected week Make a list of the data represented by the plot from smallest to largest Stems Leaves 1 2 12588 02246894 3 137 4 5 19 389

Statistics
ProbabilityBriefly explain the error in the construction of the ogive below which illustrates the average quantitative GRE scores to the top 30 graduate schools of engineering Cumulative Frequency 2 25 20 15 10 S 0 744 756 770 777 784

Statistics
ProbabilityLet s assume that the function f x y c 3x 2y represents a joint probability mass function for x 1 3 5 and y 2 4 6 Determine a The value of c b P X 3 5 Y 3 c P X 3 d E X e V Y f Marginal probability distribution of X g Are X and Y independent Why or why not

Statistics
Probabilityn average a certain intersection results in an average of 1 3 traffic accidents pe etermine the probability of the following situations for any given week a Exactly I accident occurs b No more than 2 accidents occur c At least 3 accidents occur

Statistics
StatisticsProfessor for one of your classes takes random sample of 100 student grades and obtains a mple mean of 85 with a sample standard deviation of 6 7 a Construct a 95 confidence interval for the true average grade b If this professor guessed that the standard deviation for grades overall is 10 what sample size would be required to obtain an interval width of 3 for a confidence level of 90

Statistics
Statisticscomes to playing basketball and tall people are more efficient because they can ch the basket easily allowing for more points per game as well as more rebounds and blocked shots If you watch National Basketball Association NBA games regularly you certainly notice that many players are quite tall We will explore the distribution of NBA player heights using a sample of players active in the 2019 2020 season by making a histogram of HEIGHT INCHES with bins stating at 68 inches and bin width of 2 inches We will then determine the z scores for players who are 71 inches 5 11 and b 84 inches 7 0 The dataset consists of the NBA player s name team and height measured in inches for players active in the 2019 2020 season Aaron Gordon Player Aaron Holiday Adam Mokoka Abdel Nader Admiral Schofield WAS Z Variable symmetric Numerical Variable Team Height Inches ORL Data value a x x S IND LUSE SALT OKC Import the dataset into SALT for analyzing Data value b x x CHI After you have clicked the tab for your selected topic and read the problem answer the questions below a Use SALT to summarize the data and fill in the following table rounding values to four decimal places as needed Data value a is N 80 529 73 77 77 77 b Create a histogram with Starting Point and Bin Class Width values asked for The distribution for this variable is mound shaped and is Mean 78 393 Our sample s minimum value is not Standard Deviation 3 4505 c Determine the relative standing for the two data values of interest using the z score formula appropriate for samples Round your answers to two decimal places standard deviations below Median 78 Find the data value with a z score of 3 rounded to two decimal places x 2 5 X Minimum Value standard deviations above to determine the number of standard deviations each data value is away from the mean Find the data value with a z score of 3 rounded to two decimal places X Z S X 69 the mean whereas data value b is the mean Remember to take the absolute value of the z scort maximum is histogram in SALT it can be observed that almost all A Maximum Value 89 d Most data points are within three standard deviations of the mean In other words most observations will have a score that is larger than 3 and less than 3 at least roughly further than 3 standard deviations below the mean Our sample s further than 3 standard deviations above the mean Upon further inspection of the observations would have a z score between 3 and

Statistics
Statistics1 ok int rint erences Hui is currently considering investing in municipal bonds that earn 8 40 percent interest or in taxable bonds issued by the Coca Cola Company that pay 11 20 percent Required a If Hui s tax rate is 22 percent which bond should he choose b Which bond should he choose if his tax rate is 32 percent c At what tax rate would he be indifferent between the bonds d What strategy is this decision based upon Complete this question by entering your answers in the tabs below Required A Required B Required C Required D If Hui s tax rate is 22 percent which bond should he choose

Statistics
ProbabilityForty plasma TVs were tested and the number of watts per hour they used recorded Given that the lowest value is 429 find the class limits to be used in the construction of a frequency distribution for the data with 6 classes and a class width of w 13 Begin the first class with the smallest data value given above and write the limits for the classes in the table provided in the answer box below

Statistics
Probability4 2 2 5 In example of lecture 5 Sec 2 2 An enterprising man proposes a game let the player throw a die Let the reward becomes Z u X X a Find the pmf of Z say h z b Find E Z c How much on average can the enterprising man expect to win on each play from players if he charges 10 dollars per play

Statistics
ProbabilityAssume that the U S Mint manufactures dollar coins so that the standard deviation is 0 0390 g The accompanying list contains weights grams of dollar coins manufactured with a new process designed to decrease the standard deviation so that it is less than 0 0390 g This sample has these summary statistics n 16 x 8 066 g s 0 02 g A 0 05 significance level is used to test the claim that the sample is from a population with a standard deviation less than 0 0390 g The null and alternative hypotheses are Ho o 0 0390 g and H o 0 0390 g For this sample data we get a P value of 0 0099 when testing the claim that o 0 0390 g Complete parts a through c a What should we conclude about the null hypothesis 4 O A Accept the null hypothesis OB Fail to reject the null hypothesis OC Fail to accept the null hypothesis OD Reject the null hypothesis

Statistics
ProbabilityUse the accompanying 200 Los Angeles commute times to test the claim that the mean Los Angeles commute time is less than 32 minutes Assume that a simple random sample has been selected Use a 0 10 significance level Compare the sample mean to the claimed mean of 32 minutes Is the difference between those two values statistically significant Click the icon to view the Los Angeles commute times Identify the null and alternative hypotheses Ho 32 H 32 Type integers or decimals Do not round Identify the test statistic Round to two decimal places as needed 4

Statistics
Statisticsadults in a recent year Construct a frequency distribution that has seven classes Adapted the out of pocket prescription medicine expenses in dollars for 30 U S from Health United States 2015 Create a frequency distribution for this data 200 239 155 252 384 165 296 405 303 400 307 241 256 315 330 317 352 266 276 345 238 306 290 271 345 312 293 195 168 342 Total Class 3 Tally Frequency f Relative Frequency

Statistics
StatisticsIn the following problem check that it is appropriate to use the normal approximation to the binomial Then use the normal distribution to estimate the requested probabilities Ocean fishing for billfish is very popular in a certain region of Mexico In this region about 39 of strikes while trolling resulted a catch Suppose that on a given day a fleet of fishing boats got a total of 28 strikes Find the following probabilities Round you answers to four decimal places USE SALT a 12 or fewer fish were caught b 5 or more fish were caught c between 5 and 12 fish were caught

Statistics
ProbabilityIn the following problem check that it is appropriate to use the normal approximation to the binomial Then use the normal distribution to estimate the requested probabilities Do you take the free samples offered in supermarkets About 58 of all customers will take free samples Furthermore of those who take the free samples about 39 will buy what they have sampled Suppose you set up a counter in a supermarket offering free samples of a new product The day you were offering free samples 309 customers passed by your counter Round your answers to four decimal places USE SALT a What is the probability that more than 180 will take your free sample b What is the probability that fewer than 200 will take your free sample c What is the probability that a customer will take a free sample and buy the product Hint Use the multiplication rule for dependent events Notice that we are given the conditional probability P buy sample 0 39 while P sample 0 58 0 2262 d What is the probability that between 60 and 80 customers will take the free sample and buy the product Hint Use the probability of success calculated in part c

Statistics
ProbabilityA survey about social media reported that 77 of B2B marketers marketers that focus primarily on attracting businesses plan to increase their use of social media as compared to 56 of B2C marketers marketers that primarily target consumers The survey was based on 1 426 B2B marketers and 1 618 B2C marketers The accompanying table summarizes the results Complete parts a through d below Click the icon to view the contingency table about social media use and marketers a What is the probability that a randomly selected respondent plans to increase use of social media Round to three decimal places as needed U P O DE E SE ELEV

Statistics
Statistics2 Ms Lioktsis has opened up multiple bags of M M chocolates and counted how many chocolates are in each The amounts are shown in the box below 7 marks 58 58 52 54 55 49 34 34 34 35 42 41 35 39 39 37 42 42 43 43 44 45 45 45 46 58 a Organize the data into the frequency table Be sure to show all your work Interval 30 34 35 39 40 44 45 49 50 54 55 59 Total Interval Frequency Sum Midpoint Cumulative Freq Frequency x mean


Statistics
StatisticsA firework is shot straight up into the air with an initial velocity of 500 feet per second from 5 feet off the ground The function modeling the path of the firework is h t 16t 500 5 A At what time will the firework hit the ground numerical answer only round to the nearest tenth 31 3 B Write the inequality that represents when the firework is below 2500 feet Enter your answer here 16 500 5 2500 C Solve the inequality you wrote in B and enter your answer here round to the nearest tenth 6 2 t 31 3

Statistics
StatisticsDetermine the number of solutions for each of the graphs DRAG DROP THE ANSWER One Solution Two Solutions No Solution

Statistics
StatisticsWhat are the solution s to the system of equations Select all that apply 2 5 25 D 1 0 10 3 75 325