Probability Questions and Answers

Statistics
ProbabilityAn experiment involves tossing a pair of dice one green and one red and recording the numbers that come up If x equals the outcome on the green die and y the outcome on the red die the sample space S consists of all the possible ordered pairs x y Event A is the event that the sum is less than 5 Event B is the event that a 3 occurs on either die Event C is the event that a number less than 4 comes up on the green die Assume that all elements of the sample space are equally likely to occur Complete parts a through c below Click the icon to view the sample space a Find the probability of event A P A Type an integer or a simplified fraction b Find the probability of event C P C Type an integer or a simplified fraction c Find the probability of event An C P ANC Type an integer or a simplified fraction Sample Space 1 1 1 2 1 3 1 4 1 5 2 4 2 1 2 2 2 3 2 5 3 1 3 2 3 3 3 4 3 5 4 1 4 2 4 3 4 4 4 5 5 1 5 2 5 3 5 4 5 5 6 1 6 2 6 3 6 4 6 5 102 Mer Her 1 6 2 6 3 6 4 6 5 6 6 6 I

Statistics
ProbabilityThe probability density function for the random variable X is shown below Find P X 2 Select the correct answer below 01 0 0 1 10 O O 29 19 49 0 f x 4 5 6 7 8 19 10 11

Statistics
Probabilityg UA ACO 20 16 12 8 4 C Tar 0 14 0 4 8 12 16 20 UB ACO 20 16 12 8 4 10 Tar 0 4 8 12 16 20 Is there a relationship between cigarette tar and CO OA No there appears to be no relationship OB Yes as the amount of tar increases the amount of carbon monoxide also increases C ACO 20 165 125 8 4 0 0 4 8 12 16 20 Tar Q GU ACO 20 16 12 8 4 0 Tar 0 4 8 12 16 20

Statistics
ProbabilityA sample of blood pressure measurements is taken for a group of adults and those values mm Hg are listed below The values are matched so that 10 subjects each have a systolic and diastolic measurement Find the coefficient of variation for each of the two samples then compare the variation Systolic 116 129 160 94 156 120 115 135 128 122 Diastolic 81 77 76 51 90 89 57 64 71 82 The coefficient of variation for the systolic measurements is Type an integer or decimal rounded to one decimal place as needed CTD The coefficient of variation for the diastolic measurements is Type an integer or decimal rounded to one decimal place as needed Compare the variation The coefficients of variation for each data set are within 5 percentage points of each other Therefore the systolic measurements vary the diastolic

Statistics
Probability10 The numbers of on time flights and the number Airline of delayed or cancelled flights for four major airlines for a given month is given in the table Which airline had the highest probability of an on time flight A B C D On time 63 207 65 339 93 411 37 506 The airline with the highest probability of an on time flight is Airline 1 probability of Type an integer or decimal rounded to four decimal places as needed 1 O B Delayed or Cancel 15 788 11 424 23 859 8 851 with a

Statistics
Probability8 According to a recent survey the probability that the driver in a fatal vehicle accident is female event F is 0 2745 The probability that the driver is 24 years old or less event A is 0 1868 The probability that the driver is female and is 24 years old or less is 0 0511 Answer parts a through d below a Find the probability of FUA P FUA b Find the probability of F UA P F UA c Find the probability of FNA P FOA d Find the probability of F UA P F UA 0 4102 Round to four decimal places as needed Round to four decimal places as needed Round to four decimal places as needed Round to four decimal places as needed

Statistics
ProbabilityConsider the information in the Why we can t lose weight chart shown to the right which is in the magazine style of graph Could the information provided be organized into a pie chart Why or why not Choose the correct answer below 63 Metabolism too slow 59 OND OA No The values in the table are not decimals B Yes The information could be organized into a pie chart OC No There are more than 3 categories of data D No The percentages add up to more than 100 Don t exercise 50 Why we can t lose weight Don t have self discipline 49 Splurge on favorite foods

Statistics
ProbabilityThe following graph represents the results of a survey in which a random sample of adults in a certain country was asked if a certain action was morally wrong in general Complete parts a through c below Opinion Regarding an Action Depends on situation Morally wrong Morally acceptable a What percent of the respondents believe the action is morally acceptable About of the respondents Round to the nearest whole number as needed 0 20 40 60 80 10 Percentage of respondents

Statistics
ProbabilityIn a study of a sample of babies born at hospitals in one state it was found that the average mean weight at birth wa 3165 6 grams Identify whether this value is a statistic or a parameter Choose the correct answer below OA The value is a parameter because it describes some characteristic of a sample OB The value is a statistic because it describes some characteristic of a population OC The value is a statistic because it describes some characteristic of a sample OD The value is a parameter because it describes some characteristic of a population

Statistics
Probabilitye pie chart below depicts the beverage size customers Dose while at a fast food restaurant Complete parts a ough c Most popular beverage sizes at a restaurant Small 22 Medium 16 Large 52 XL 10 a What is the most popular size What percentage of customers choose this size OA XL 10 B Large 52 OC Small 22 OD Medium 16 b What is the least popular size What percentage of customers choose this size OA Small 22 B Medium 16 C XL 10 D Large 52 c What percent of customers choose a medium sized beverage A 19 B 22 C 16

Statistics
ProbabilityWhich of the following is associated with a parameter Choose the correct answer below O A Data that were obtained from a sample B A numerical measurement describing some characteristic of a sample OC Data that were obtained from a voluntary poll at the end of a service call OD Data that were obtained from an entire population

Statistics
ProbabilityThe following Pareto chart shows the position played by the most valuable player MVP in certain baseball league for the last 86 years Use the chart to answer parts a through d a Which position had the most MVPs The position with the most MVPs was Frequency 40 35 30 25 20 505 15 10 Most Valuable Player Award 00 OF 1B 3B PC SS 2B Position

Statistics
Probabilitywhether the given value is a statistic or a parameter A homeowner measured the voltage supplied to his home on 43 different days and the average mean value is 105 volts Choose the correct answer below OA The given value is a parameter for the year because the data collected represent a population B The given value is a statistic for the year because the data collected represent a sample OC The given value is a statistic for the year because the data collected represent a population OD The given value is a parameter for the year because the data collected represent a sample

Statistics
Probabilitythe underlined number is a statistic or a parameter In a study of all 2430 professors at a college it is found that 65 own a television Choose the correct statement below O Parameter because the value is a numerical measurement describing a characteristic of a sample Parameter because the value is a numerical measurement describing a characteristic of a population Statistic because the value is a numerical measurement describing a characteristic of a population Statistic because the value is a numerical measurement describing a characteristic of a sample

Statistics
ProbabilityIn a relative frequency distribution what should the relative frequencies add up to Select the correct choice and if necessary fill in the answer box to complete your choice OA The relative frequencies add up to OB The relative frequencies add up to the total number of observations

Statistics
Probability5 Data from a survey can allow one to estimate how many people who classified their work status as part time or full time actually worked in the last week Find the probability that the hours worked were 29 or less given that the worker was part time Labor Force Status Hours Worked in the Last Week 50 or More 0 19 20 29 30 39 40 49 21 Full Time Worker Part Time 72 85 83 Worker Total 93 129 216 The probability that the hours worked were 29 or less and that the worker was part time is 44 133 692 371 42 21 734 392 Round to four decimal places as needed The probability that the hours worked were 29 or less given that the worker was part time is Round to four decimal places as needed To 1261 303 1564

Statistics
ProbabilityThe number of chocolate chips in a popular brand of cookie is normally distributed with a mean of 22 chocolate chips per cookie and a standard deviation of 2 5 chips When the cookies come out of the oven only the middle 90 in terms of the number of chocolate chips are acceptable the rest are considered defective What are the cutoff numbers for the number of chocolate chips in acceptable cookies Give your answers to three decimal places

Statistics
ProbabilityReview the following box and whisker chart What is the interquartile range for employee scores A 46 67 B 57 67 C 46 57 D 25 70 Leadership Assessment Score 80 70 60 50 40 30 20 10 0 Leadership By Position Type 70 25 12 Employee 767 57 46 ANRE 70 46 32 Manager 169 5 60 56 5

Statistics
Probability1 30 points The fat content in 8 ayran samples was calculated by method A and method B and given in the table below Add your date of birth to Method B Example if your date of birth is 12 07 2003 it will be placed in the boxes in B as 1 2 0 7 2 0 0 3 A 5 7 3 9 8 2 a If method A is an accredited method test whether method B can be used instead of A with a method independent of the normal distribution at a 0 05 level and comment 30 points
Statistics
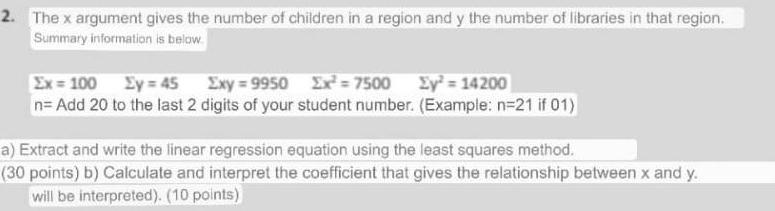
Probability2 The x argument gives the number of children in a region and y the number of libraries in that region Summary information is below Ex 100 Ey 45 Exy 9950 Ex 7500 Ey 14200 n Add 20 to the last 2 digits of your student number Example n 21 if 01 a Extract and write the linear regression equation using the least squares method 30 points b Calculate and interpret the coefficient that gives the relationship between x and y will be interpreted 10 points

Statistics
ProbabilityWhat is the age distribution of patients who make office visits to a doctor or nurse The following table is based on ased on informa Under 15 10 65 and older 60 Suppose you are a district manager of a health management organization HMO that is monitoring the office of a local doctor or nurse in general family practice This morning the office you are monitoring has eight office visits on the schedule What is the probability of the following USE SALT Age group years Percent of office visitors 15 24 5 25 44 15 45 64 10 a At least half the patients are under 15 years old Round your answer to three decimal places 0 002 X Explain how this can be modeled as a binomial distribution with 8 trials where success is visitor age is under 15 years old and the probability of success is 10 O Let n 8 p 0 90 and compute the probabilities using the binomial distribution O Let n 8 p 0 15 and compute the probabilities using the binomial distribution Let n 8 p 0 10 and compute the probabilities using the binomial distribution O Let n 15 p 0 10 and compute the probabilities using the binomial distribution b From 2 to 5 patients are 65 years old or older include 2 and 5 Round your answer to three decimal places 0 382 x c From 2 to 5 patients are 45 years old or older include 2 and 5 Hint Success if 45 or older Use the table to compute the probability of success on a single trial Round your answer to three decimal places d All the patients are under 25 years of age Round your answer to three decimal places e All the patients are 15 years old or older Round your answer to three decimal places

Statistics
ProbabilityAssume that a coin is tossed twice The coin may not be fair The sample space consists of the outcomes HH HT TH TT Is the given a probability model Choose one No Outcome HH Probability 0 16 HT TH TT 0 60 0 90 0 47

Statistics
ProbabilityFind the area to the right of the z score 1 40 and to the left of the z score 1 58 under the standard normal curve Z 0 00 0 01 0 02 0 03 0 04 0 05 0 06 0 07 0 08 0 09 1 3 0 9032 0 9049 0 9066 0 9082 0 9099 0 9115 0 9131 0 9147 0 9162 0 9177 1 4 0 9192 0 9207 0 9222 0 9236 0 9251 0 9265 0 9279 0 9292 0 9306 0 9319 1 5 0 9332 0 9345 0 9357 0 9370 0 9382 0 9394 0 9406 0 9418 0 9429 0 9441 1 6 0 9452 0 9463 0 9474 0 9484 0 9495 0 9505 0 9515 0 9525 0 9535 0 9545 1 7 0 9554 0 9564 0 9573 0 9582 0 9591 0 9599 0 9608 0 9616 0 9625 0 9633 1 8 0 9641 0 9649 0 9656 0 9664 0 9671 0 9678 0 9686 0 9693 0 9699 0 9706 1 9 0 9713 0 9719 0 9726 0 9732 0 9738 0 9744 0 9750 0 9756 0 9761 0 9767 Use the value s from the table above Provide your answer below

Statistics
ProbabilityHow many kids In a survey 46 200 women were asked how many children they had The results were as follows Number of Number of Children Women 0 1 2 3 4 5 6 7 8 or more Part 1 of 4 Total Send data to Excel 12 598 7467 11 269 7038 3782 1820 925 522 779 46 200 a What is the probability that a sampled woman has three children Round your answer to four decimals The probability that a sampled woman has three children is 0 1523

Statistics
ProbabilityAge Range Less than 1 year 1 17 18 44 45 64 65 84 85 and up Total Send data to Excel art 1 of 3 What is the probability that an asthma patient is between 45 and 64 years old he probability that an asthma patient is between 45 and 64 years old is 0 2971 art 1 3 Number 7865 103 038 79 655 121 726 80 656 16 755 409 695 art 2 of 3 What is the probability than an asthma patient is less than 1 year old

Statistics
ProbabilityDuring a bowling league tournament the number of times that teams scored a strike every ten minutes was recorded by a scorekeeper The table below represents the probability density function for the random variable X the number of strikes every ten minutes Find the standard deviation of X Round the final answer to two decimal places Provide your answer below X 0 3 4 8 P X X 1 6 1 6 1 3 1 3

Statistics
ProbabilityQuality control A population of 584 semiconductor wafers contains wafers from three lots The wafers are categorized by lot and by whether they conform to a thickness specification with the results shown in the following table A wafer is chosen at random from the population Write your answer as a fraction or a decimal rounded to four decimal places Lot A B C Conforming 82 156 253 Send data to Excel Nonconforming 17 45 31 a What is the probability that the wafer is from Lot C b What is the probability that the wafer is nonconforming c What is the probability that the wafer is from Lot C and is nonconforming d Given that the wafer is from Lot C what is the probability that it is nonconforming from Lot C e Given that the wafer is nonconforming what is the probability that it f Let E be the event that the wafer comes from Lot C and let E be the event that the wafer is nonconforming Are E and E independent TIT olo 11

Statistics
ProbabilityThe table below shows the results of a survey that asked 2859 people whether they are involved in any type of charity work A person is selected at random from the sample Complete parts a through d Male Female Total Frequently 221 207 428 Occasionally 456 440 896 Not at all 792 743 1535 Total 1469 1390 2859 a Find the probability that the person is frequently or occasionally involved in charity work M b Find the probability that the person is female or not involved in charity work at all P being frequently involved or being occasionally involved Round to the nearest thousandth as needed P being female or not being involved Round to the nearest thousandth as needed c Find the probability that the person is male or frequently involved in charity work P being male or being frequently involved

Statistics
ProbabilityFollowing is the probability distribution of a random variable that represents the number of extracurricular activities a college freshman participates in Part 1 of 3 Part 1 3 0 Part 2 of 3 1 P x 0 07 0 13 Send data to Excel 2 3 4 a Find the probability that a student participates in exactly four activities The probability that a student participates in exactly four activities is 0 14 0 45 0 21 0 14 b Find the probability that a student participates in less than three activities

Statistics
ProbabilityA binomial probability experiment is conc probability of x successes in the n independent trials of the experiment n 20 p 0 9 x 19 P 19 Do not round until the final answer Then round to four decimal places as need

Statistics
Probabilityding to flightstats com American Airlines flights from Dallas to Chicago are on time me Suppose 17 flights are randomly selected and the number of on time flights is re xplain why this is a binomial experiment etermine the values of n and p nd and interpret the probability that exactly 11 flights are on time ind and interpret the probability that fewer than 11 flights are on time nd and interpret the probability that at least 11 flights are on time nd and interpret the probability that between 9 and 11 flights inclusive are on time Using the binomial distribution the probability that fewer than 11 flights are on time is und to four decimal places as needed pret the probability 00 trials of this experiment it is expected that about will result in fewer than 11 flig ng on time und to the nearest whole number as needed
Statistics
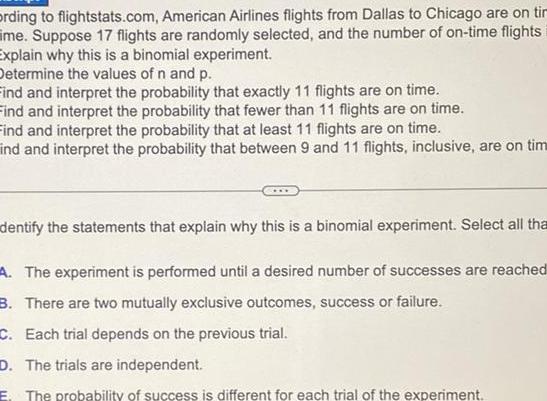
Probabilityording to flightstats com American Airlines flights from Dallas to Chicago are on tir me Suppose 17 flights are randomly selected and the number of on time flights Explain why this is a binomial experiment Determine the values of n and p Find and interpret the probability that exactly 11 flights are on time Find and interpret the probability that fewer than 11 flights are on time Find and interpret the probability that at least 11 flights are on time ind and interpret the probability that between 9 and 11 flights inclusive are on tim dentify the statements that explain why this is a binomial experiment Select all tha A The experiment is performed until a desired number of successes are reached B There are two mutually exclusive outcomes success or failure C Each trial depends on the previous trial D The trials are independent E The probability of success is different for each trial of the experiment

Statistics
ProbabilityIn a particular survey of internet users 3612 respondents say that they use social networking sites and 1495 respondents say that they do not use social networking sites What is the probability that a randomly selected person uses a social networking site Does that result suggest that it is likely with a probability of 0 5 or greater for someone to use social networking sites The probability that a randomly selected person uses a social networking site is Round to three decimal places as needed Is it likely for a respondent to use social media OA Yes because the probability of a respondent using social media is greater than 0 5 O B Yes because the probability of a respondent using social media is less than or equal to 0 5 OC No because the probability of a respondent using social media is greater than 0 5 O D No because the probability of a respondent using social media is less than or equal to 0 5

Statistics
ProbabilityS College students are randomly selected and arranged in groups of three The random variable x X is the number in the group who say that they take one or more online courses Determine whether 0 a probability distribution is given If a probability distribution is given find its mean and standard deviation If a probability distribution is not given identify the requirements that are not satisfied 1 2 Does the table show a probability distribution Select all that apply A Yes the table shows a probability distribution B No the numerical values of the random variable x are not associated with probabilities C No the random variable x is categorical instead of numerical D No the sum of all the probabilities is not equal to 1 E No not every probability is between 0 and 1 inclusive O A students Round to one decimal place as needed 3 Find the mean of the random variable x Select the correct choice below and if necessary fill in the answer box to complete your choice P x 0 107 0 351 0 396 0 146

Statistics
Probabilityprobability that a randomly selected 5 year old male stink bug will live to be 6 years 3976 What is the probability that two randomly selected 5 year old male stink bugs will live rs old What is the probability that six randomly selected 5 year old male stink bugs will live t rs old What is the probability that at least one of six randomly selected 5 year old male stink not live to be 6 years old Would it be unusual if at least one of six randomly selected ear old male stink bugs did not live to be 6 years old

Statistics
ProbabilityThe word and in probability implies that we use the The word and in probability implies that we use the rule ru subtraction division

Statistics
Probabilitytermine whether the events E and F are independent or dependent Justify your answ a E A person having a high GPA F The same person being a heavy reader of assigned course materials OA E and F are dependent because being a heavy reader of assigned course materi affect the probability of a person having a high GPA OB E and F are dependent because having a high GPA has no effect on the probabil person being a heavy reader of assigned course materials OC E and F are independent because being a heavy reader of assigned course mate has no effect on the probability of a person having a high GPA OD E and F are independent because having a high GPA has no effect on the probat

Statistics
ProbabilityA university conducted a survey of 365 undergraduate students regarding satisfaction with student government Results of the survey are shown in the table by class rank Complete parts a through d below Satisfied Neutral Not satisfied Total Freshman 51 30 16 97 Sophomore Junior Senior 49 61 14 23 98 10 19 78 60 19 13 92 a If a survey participant is selected at random what is the probability that he or she is satisfied with student government Total 221 73 71 365 P satisfied Round to three decimal places as needed b If a survey participant is selected at random what is the probability that he or she is a junior P junior Round to three decimal places as needed P satisfied and junior Round to three decimal places as needed c If a survey participant is selected at random what is the probability that he or she is satisfied and a junior P satisfied or junior Round to three decimal places as needed d If a survey participant is selected at random what is the probability that he or she is satisfied or a junior

Statistics
ProbabilityWhat do we call the outcome yellow www OA Unusual event B Certain event C Impossible event D Not so unusual event green blue UU NU VOcause for all the products are greater than brown yellow orange C

Statistics
Probabilitythe following a probability model What do we call e outcome yellow Color red green blue brown yellow orange Probability 0 25 0 2 0 1 0 1 0 0 3 the table above an example of a probability model A Yes because the probabilities sum to 1 and they are all greater than or equal to 0 and less than or equal to 1 B Yes because the probabilities sum to 1 C No because the probabilities do not sum to 1 D No because not all the probabilities are greater than 0

Statistics
Probability1 What is the sample space of the spinner S 0 1 2 3 4 5 6 7 2 What is set A A 0 1 2 3 4 3 What is the probability of spinning a number less than 5 P 5 4 What is set B B 5 What is the probability of spinning a natural number P N 6 What is A and B A and B 1 2 3 4 7 What is the probability of spinning a natural number and a number less than 5 P A and B Enter the values from least to greatest Do not use spaces in your answer 8 What is A and B A and B 9 What is the probability of spinning a number not less than 5 or a natural num

Statistics
Probability5 A bakery has determined that the number of loaves of its white bread demanded daily has a normal distribution with mean 7 200 loaves and standard deviation 300 loaves Based on cost considerations the company has decided that its best strategy is to produce a sufficient number of loaves so that it will fully supply demand on 94 of all days a How many loaves of bread should the company produce 6734 7897 8100 0 000 b Based on the production in part a on what percentage of days will the company have a demand of less than 6500 loaves of bread 7666 0 0000 0 0000 0 0013

Statistics
Probability4 Researchers at the Terry College of Business at the University of Georgia sampled 344 business students and asked them this question Over the course of your lifetime what is the maximum numbe of years you expect to work for any one employer The sample resulted in x 19 1 years Assume that the sample of students was randomly selected from the 6 000 undergraduate students at the Terry College and that o 6 years a Describe the sampling distribution of x b If the mean for the 6 000 undergraduate students is 18 5 years find P x 19 1 c If the mean for the 6 000 undergraduate students is 19 5 years find P x 19 1 d If P x 19 1 0 50 what is e If P x 19 1 0 20 is greater than or less than 19 1 years f Why do you think that these are approximate probabilities Please circle your answer The population may not be normal Because the Central Limit Theorem Because the standard deviation is known Because all of the above v Because i and ii only

Statistics
Probability1 The optimal scheduling of preventative maintenance tests of some but not all of n independently operating components was developed in Reliability Engineering and System Safety January 2006 The time in hours between failures of a component was approximated by an exponential distribution with mean 8 a Suppose 0 1 000 hours Find the probability that the time between component failures ranges between 1 200 and 1 500 hours b Again assume 0 1 000 hours Find the probability that the time between component failures is at least 1 200 hours c Given that the time between failures is at least 1 200 hours what is the probability that the time between failures is less than 1 500 hours

Statistics
Probability3 Almost all companies utilize some type of year end performance review for their employees Human Resources HR at the University of Texas Health Science Center provides guidelines for supervisors rating their subordinates For example raters are advised to examine their ratings for a tendency to be either too lenient or too harsh According to HR If you have this tendency consider using a normal distribution 10 of employees rated exemplary 20 distinguished 40 competent 20 marginal and 10 unacceptable Suppose you are rating an employee s performance on a scale of 1 lowest to 100 highest Also assume the ratings follow a normal distribution with a mean of 50 and a standard deviation of 15 a What is the lowest rating you should give to an exemplary employee if you follow the University of Texas HR guidelines b What is the lowest rating you should give to a competent employee if you follow the University of Texas HR guidelines

Statistics
ProbabilityFitting a straight line to a set of data yields the following prediction line Complete a through c below 6 10X a Interpret the meaning of the Y intercept bo Choose the correct answer below OA The Y intercept bo 6 implies that the average value of Y is 6 B The Y intercept bo 6 implies that for each increase of 1 unit in X the value of Y is expected to increase by 6 units OC The Y intercept bo 6 implies that when the value of X is 0 the mean value of Y is 6 OD The Y intercept bo 10 implies that when the value of X is 0 the mean value of Y is 10 b Interpret the meaning of the slope b Choose the correct answer below OA The slope b 10 implies that the average value of Y is 10 OB The slope b 6 implies that for each increase of 1 unit in X the value of Y is expected to in rease by 6 units OC The slope b 10 implies that for each increase of 1 unit in X the value of Y is expected to decrease by 10 units OD The slope b 10 implies that for each increase of 1 unit in X the value of Y is expected to increase by 10 units c Predict the mean value of Y for X 4 Y Simplify your answer

Statistics
Probability3 Decide if the following is a probability distribution X P x 1 0 25 2 0 65 3 0 30 4 0 11

Statistics
Probability11 If 2 cards are selected from a standard deck of cards The first card is NOT placed back in the deck before the second card is drawn Find the following probabilities a P heart and club b P red card and a 4 of spades
Statistics
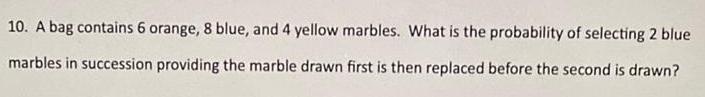
Probability10 A bag contains 6 orange 8 blue and 4 yellow marbles What is the probability of selecting 2 blue marbles in succession providing the marble drawn first is then replaced before the second is drawn

Statistics
Probability8 A card is drawn from a standard deck of cards What is the probability of drawing an ace or a black card