Statistics Questions and Answers
Math
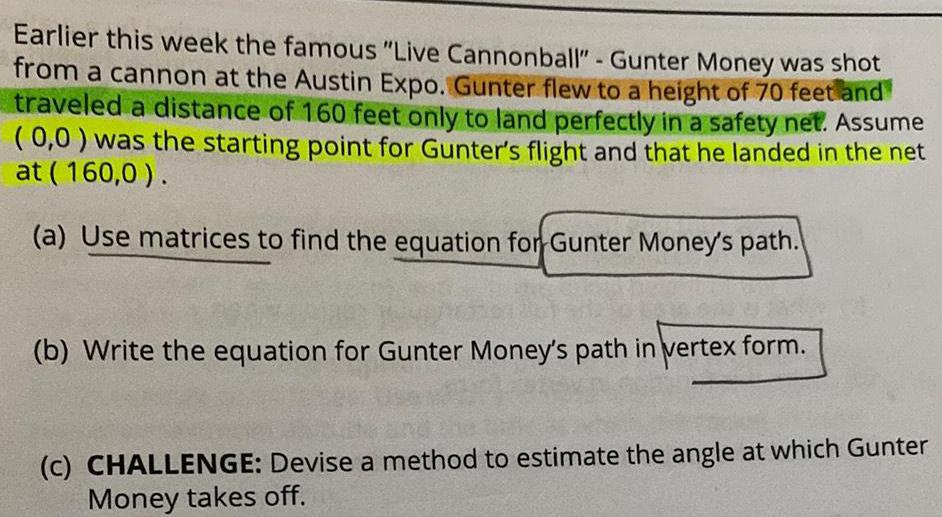
StatisticsEarlier this week the famous "Live Cannonball" - Gunter Money was shot
from a cannon at the Austin Expo. Gunter flew to a height of 70 feet and
traveled a distance of 160 feet only to land perfectly in a safety net. Assume
(0,0) was the starting point for Gunter's flight and that he landed in the net
at (160,0).
(a) Use matrices to find the equation for Gunter Money's path.
(b) Write the equation for Gunter Money's path in vertex form.
(c) CHALLENGE: Devise a method to estimate the angle at which Gunter
Money takes off.

Math
StatisticsA political scientist surveys 28 of the current 119 representatives in a state's legislature.
What is the size of the sample:
What is the size of the population:
Math
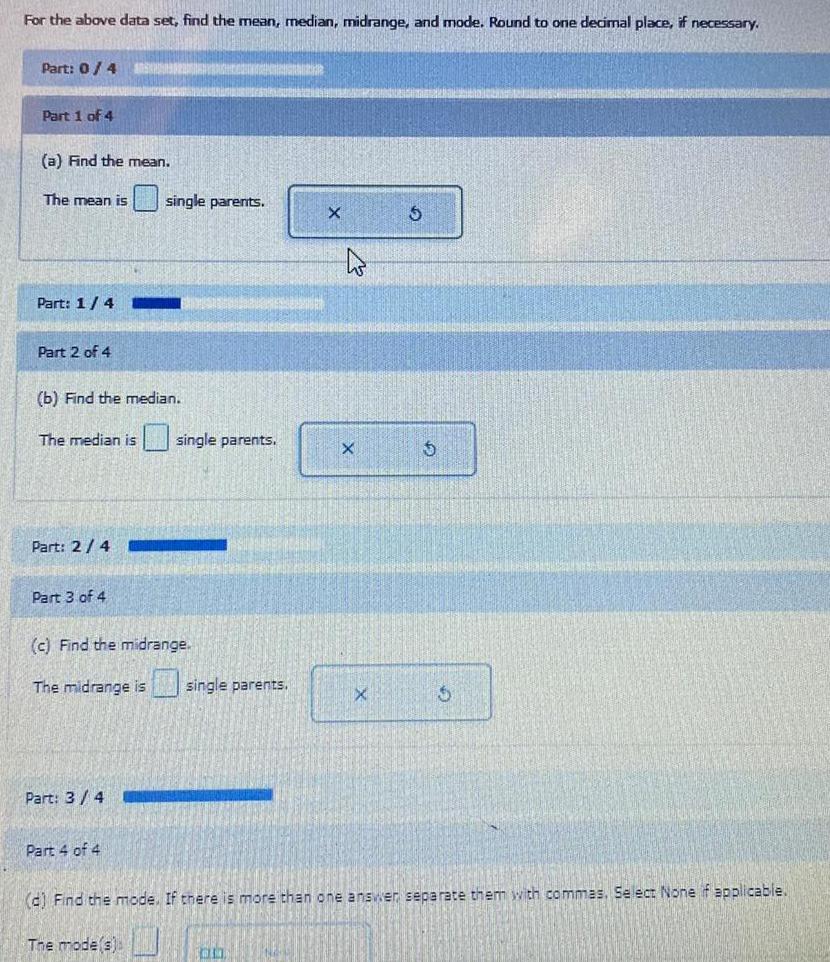
StatisticsFor the above data set, find the mean, median, midrange, and mode. Round to one decimal place, if necessary.
Part: 0/4
Part 1 of 4
(a) Find the mean.
The mean is single parents
Part 2 of 4
(b) Find the median.
The median is single parents.
Part 3 of 4
(c) Find the midrange.
The midrange is single parents.
Part 4 of 4
(d) Find the mode. If there is more than one answer separate them with commas. Select None if applicable.
The mode(s)
Math
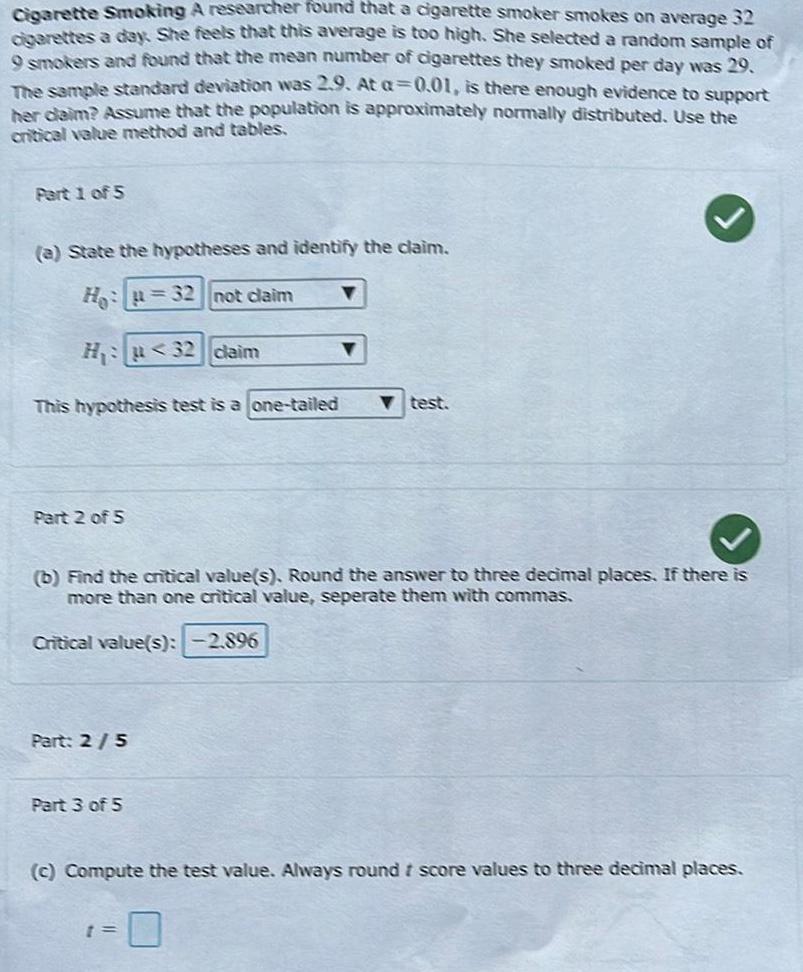
StatisticsCigarette Smoking A researcher found that a cigarette smoker smokes on average 32
cigarettes a day. She feels that this average is too high. She selected a random sample of
9 smokers and found that the mean number of cigarettes they smoked per day was 29.
The sample standard deviation was 2.9. At a=0.01, is there enough evidence to support
her claim? Assume that the population is approximately normally distributed. Use the
critical value method and tables.
Part 1 of 5
(a) State the hypotheses and identify the claim.
Hu µ=32 not claim
H₁ µ<32 claim
This hypothesis test is a one-tailed
Part 2 of 5
Part: 2/5
Part 3 of 5
▼
(b) Find the critical value(s). Round the answer to three decimal places. If there is
more than one critical value, seperate them with commas.
Critical value(s): -2.896
▼
I=
▼test.
(c) Compute the test value. Always round t score values to three decimal places.
Math
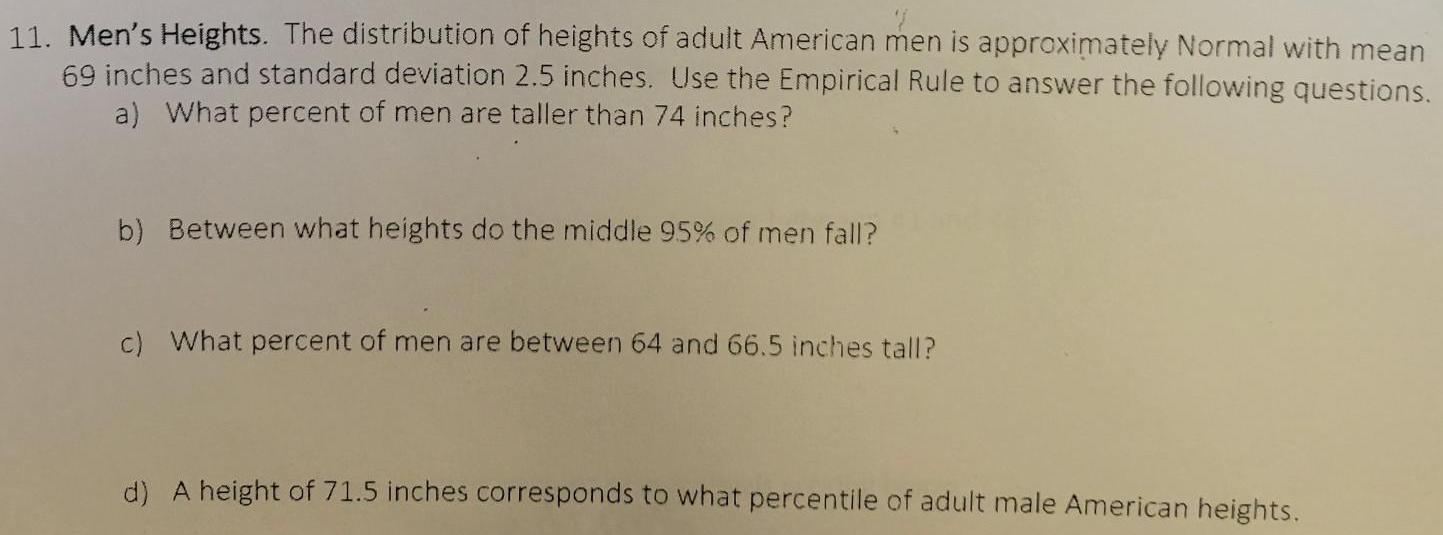
StatisticsMen's Heights. The distribution of heights of adult American men is approximately Normal with mean 69 inches and standard deviation 2.5 inches. Use the Empirical Rule to answer the following questions.
a) What percent of men are taller than 74 inches?
b) Between what heights do the middle 95% of men fall?
c) What percent of men are between 64 and 66.5 inches tall?
d) A height of 71.5 inches corresponds to what percentile of adult male American heights.

Math
StatisticsSuppose a man took out a 30-year loan with an annual rate of 6% to put an addition on his house. His banker encouraged him to put other expenses into the loan if he wished, so he increased the loan in order to purchase furniture,a new car, and a computer. Suppose the computer cost $1,400. Assume that the loan is an add on loan to calculate parts a. and b.
a. What was the amount of interest that he paid on the computer part of his loan?
b. What was the total cost of his computer?
a. The total interest is $
(Simplify your answer.)
*****

Math
StatisticsThe amount of time a certain brand of light bulb lasts is normally distributed with a mean of 1400 hours and a standard deviation of 50 hours. Using the empirical rule, determine what interval of hours represents the lifespan of the middle 68% of light bulbs.

Math
StatisticsNew-Homes Prices If the average price of a new one-family home is $246,300 with a standard deviation of $15,000, find the minimum and maximum prices of the houses that a contractor will build to satisfy the middle 48% of the market. Assume that the variable is normally distributed. Round z- value calculations to 2 decimal places and final answers to the nearest dollar.
Minimum price: $
Maximum price: $

Math
StatisticsA formal hypothesis test is to be conducted to test the claim that the wait times at the Space Mountain ride in Walt Disney World have a mean equal to 38 minutes. Complete parts (a) through (d).
a. What is the null hypothesis, and how is it denoted?
minute(s)
(Type an integer or a decimal. Do not round.)

Math
StatisticsPolice Academy Acceptance Exams To qualify for a police academy, applicants are given a test of physical fitness. The scores are normally distributed with a mean of 70 and a standard deviation of 7. If only the top 22% of the applicants are selected, find the cutoff score. Round z-value calculations to 2 decimal places and the final answer up to the nearest whole number.

Math
Statistics8. Students whose test score is within 12 points of the number 87 will earn free tuition to a generous University. First, re-write this statement in plain English using mathematical language; then, write it mathematically, using absolute value notation; use the variable x for the score. Finally, give us the range of scores that guarantee free tuition on this particular exam.

Math
StatisticsUsing a random sample of 1396 TV households, Acme Media Statistics found that 36.2% watched the final episode of "I Can't Take it Anymore!"
a. Find the margin of error in this percent.
b. Write a statement about the percentage of TV households in the population who tuned into the final episode of "I Can't Take it Anymore!"
a. The margin of error is ±%.
(Do not round until the final answer. Then round to the nearest hundredth as needed.)

Math
StatisticsA student was asked to find a 95% confidence interval for widget width using data from a random sample of size n = 20. Which of the following is a correct interpretation of the interval 10 < µ < 29.9?
Check all that are correct.
The mean width of all widgets is between 10 and 29.9, 95% of the time. We know this is true because
the mean of our sample is between 10 and 29.9.
With 95% confidence, the mean width of all widgets is between 10 and 29.9.
There is a 95% chance that the mean of the population is between 10 and 29.9.
With 95% confidence, the mean width of a randomly selected widget will be between 10 and 29.9.
There is a 95% chance that the mean of a sample of 20 widgets will be between 10 and 29.9.

Math
StatisticsDetermine whether the value 95% is a parameter or statistic:
95% of College A's students are women
O Statistic
Parameter

Math
StatisticsIn an all boys school, the heights of the student body are normally distributed with a mean of 67 inches and a standard deviation of 4.5 inches. Using the empirical rule, determine the interval of heights that represents the middle 68% of male heights from this school.

Math
StatisticsUsing a random sample of 998 TV households, Acme Media Statistics found that 37.7% watched the final episode of "When Will it End?"
a. Find the margin of error in this percent.
b. Write a statement about the percentage of TV households in the population who tuned into the final episode of "When Will it End?"
a. The margin of error is t
%.
(Do not round until the final answer. Then round to the nearest hundredth as needed.)

Math
StatisticsThe distribution of heights of adult men is approximately normal with a mean of 69 inches and a standard deviation of 2 inches.
Bob's height has a Z-score of -0.5 when compared to all adult men. Which of the following is true?
Bob is shorter than 69 inches tall.
Bob's height is half of a standard deviation below the mean.
Bob is 68 inches tall.
All of the above.

Math
StatisticsA patient recently diagnosed with Alzheimer's disease takes a cognitive abilities test and scores a 45. The mean on this test is 52 and the standard deviation is 5. What percent of patients have his score and below?
Math
StatisticsAt a large high school, students took a series of advanced tests. Each test covered a different subject area, had a different number of items, and a different mean and standard deviation. One of the students, Marquita, wants to see on which tests she performed the best. Which of the following methods should she use?
Compare her total scores on each test.
Compare her standardized z score on each test.
Compare her percent correct for each test.
All of the above would lead to the same conclusion.

Math
StatisticsWhen Serenity commutes to work, the amount of time it takes her to arrive is normally distributed with a mean of 39 minutes and a standard deviation of 5 minutes. Using the empirical rule, determine the interval that represents the middle 99.7% of her commute times.

Math
StatisticsRhonda started a business. Her business made $30,000 in profits the first year. Her annual profits have increased by an average of 5% each year since then.
(a) Write an iterative rule to model the sequence formed by the profits of Rhonda's business each year.
(b) Use the rule to determine what the annual profits of Rhonda's business can be predicted to be 15 years from the start of her business. Round your answer to the nearest dollar. Do not round until the end. Show your work.

Math
StatisticsAn airline sells all tickets for a certain route at the same price. If it charges 250 dollars per ticket, it sells 5000 tickets. For every 5 dollars the ticket price is reduced, an extra 500 tickets are sold. It costs the airline a hundred dollars to fly a person.
What price will generate the greatest profit for the airline?
price = $

Math
StatisticsHeart Rates For a certain group of individuals, the average heart rate is 70 beats per minute. Assume the variable is normally distributed and the standard deviation is 2 beats per minute. If a subject is selected at random, find the probability that the person has the following heart rate.
Round the final answers to at least four decimal places and intermediate z-value calculations to two decimal places.
(a) Between 67 and 71 beats per minute
P(67<X<71)=

Math
StatisticsCheryl Wilcox is planning for her retirement, so she is setting up a payout annuity with her bank. She wishes to receive a payout of $1,800 per month for twenty years.
(a) How much money must she deposit if her money earns 8% interest compounded monthly? (Round your answer to the nearest
cent.)
(b) Find the total amount that Cheryl will receive from her payout annuity.
$

Math
StatisticsThe data in a data set are normally distributed with a mean of 190 and a standard deviation of 20. Estimate the percent of the data that are less than 150 or greater than 230.
%
Math
StatisticsCommute Time to Work The average commute to work (one way) is 25 minutes according to the 2005 American Community Survey. If we assume that commuting times are normally distributed and that the standard deviation is 6.1 minutes, calculate the probability that a randomly selected commuter spends for the following cases. Round the final answers to at least four decimal places and intermediate z-value calculations to two decimal places.
(a) More than 37 minutes commuting one way
P(X>37)=
Math
StatisticsSuppose you want to borrow $200,000 from the bank to buy a home and agree to repay the loan in 360 equal monthly payments, including all interest due. The bank charges 0.35% per month on the unpaid balance (4.2% per year compounded monthly).
Answer the following questions about this loan.
How much is the monthly payment?
$ Round to the nearest cent.
Math
StatisticsSuppose you decide to wait 5 years to save up before buying the house. You are able to put a down payment of $30,000 on the house, so that you only need to borrow $170,000 from the bank. Assume the interest rate is still the same, but you are now in a better financial position, and you can pay off the loan in 240 equal monthly payments.
Answer the following questions about this loan.
After making 240 monthly payments, how much will you have paid in total to the bank?
_______$ Round to the nearest cent.

Math
StatisticsWhich data set has a mean of 80, a median of 83, and a mode of 91?
Set A 91, 91, 65, 68, 85, 86, 93, 56, 63, 74, 90
Set B 91, 63, 74, 94, 98, 85, 62, 66, 90, 79, 63
Set C 83, 92, 82, 56, 67, 91, 96, 66, 87, 91, 69
Math
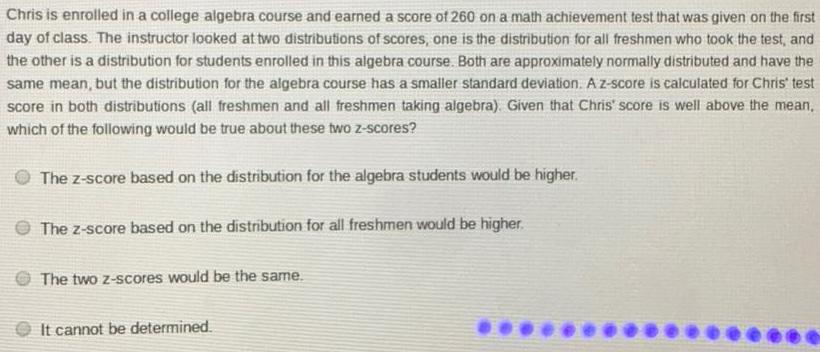
StatisticsChris is enrolled in a college algebra course and earned a score of 260 on a math achievement test that was given on the first day of class. The instructor looked at two distributions of scores, one is the distribution for all freshmen who took the test, and the other is a distribution for students enrolled in this algebra course. Both are approximately normally distributed and have the same mean, but the distribution for the algebra course has a smaller standard deviation. A z-score is calculated for Chris' test score in both distributions (all freshmen and all freshmen taking algebra). Given that Chris' score is well above the mean, which of the following would be true about these two z-scores?
The z-score based on the distribution for the algebra students would be higher.
The z-score based on the distribution for all freshmen would be higher.
The two z-scores would be the same.
It cannot be determined.
Math
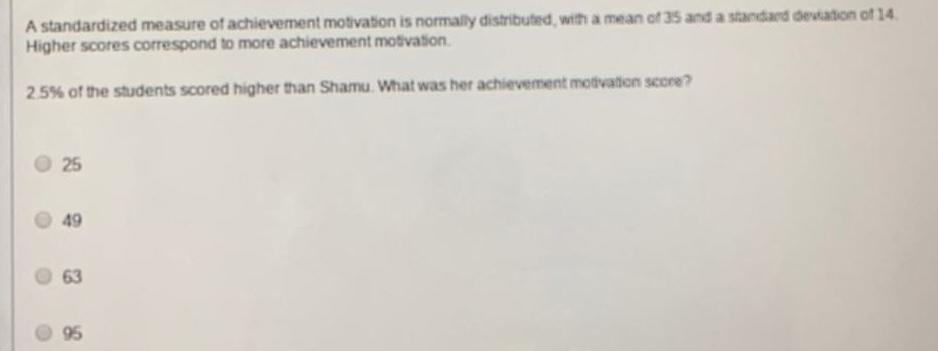
StatisticsA standardized measure of achievement motivation is normally distributed, with a mean of 35 and a standard deviation of 14.
Higher scores correspond to more achievement motivation.
2.5% of the students scored higher than Shamu. What was her achievement motivation score?
25
49
63
95
Math
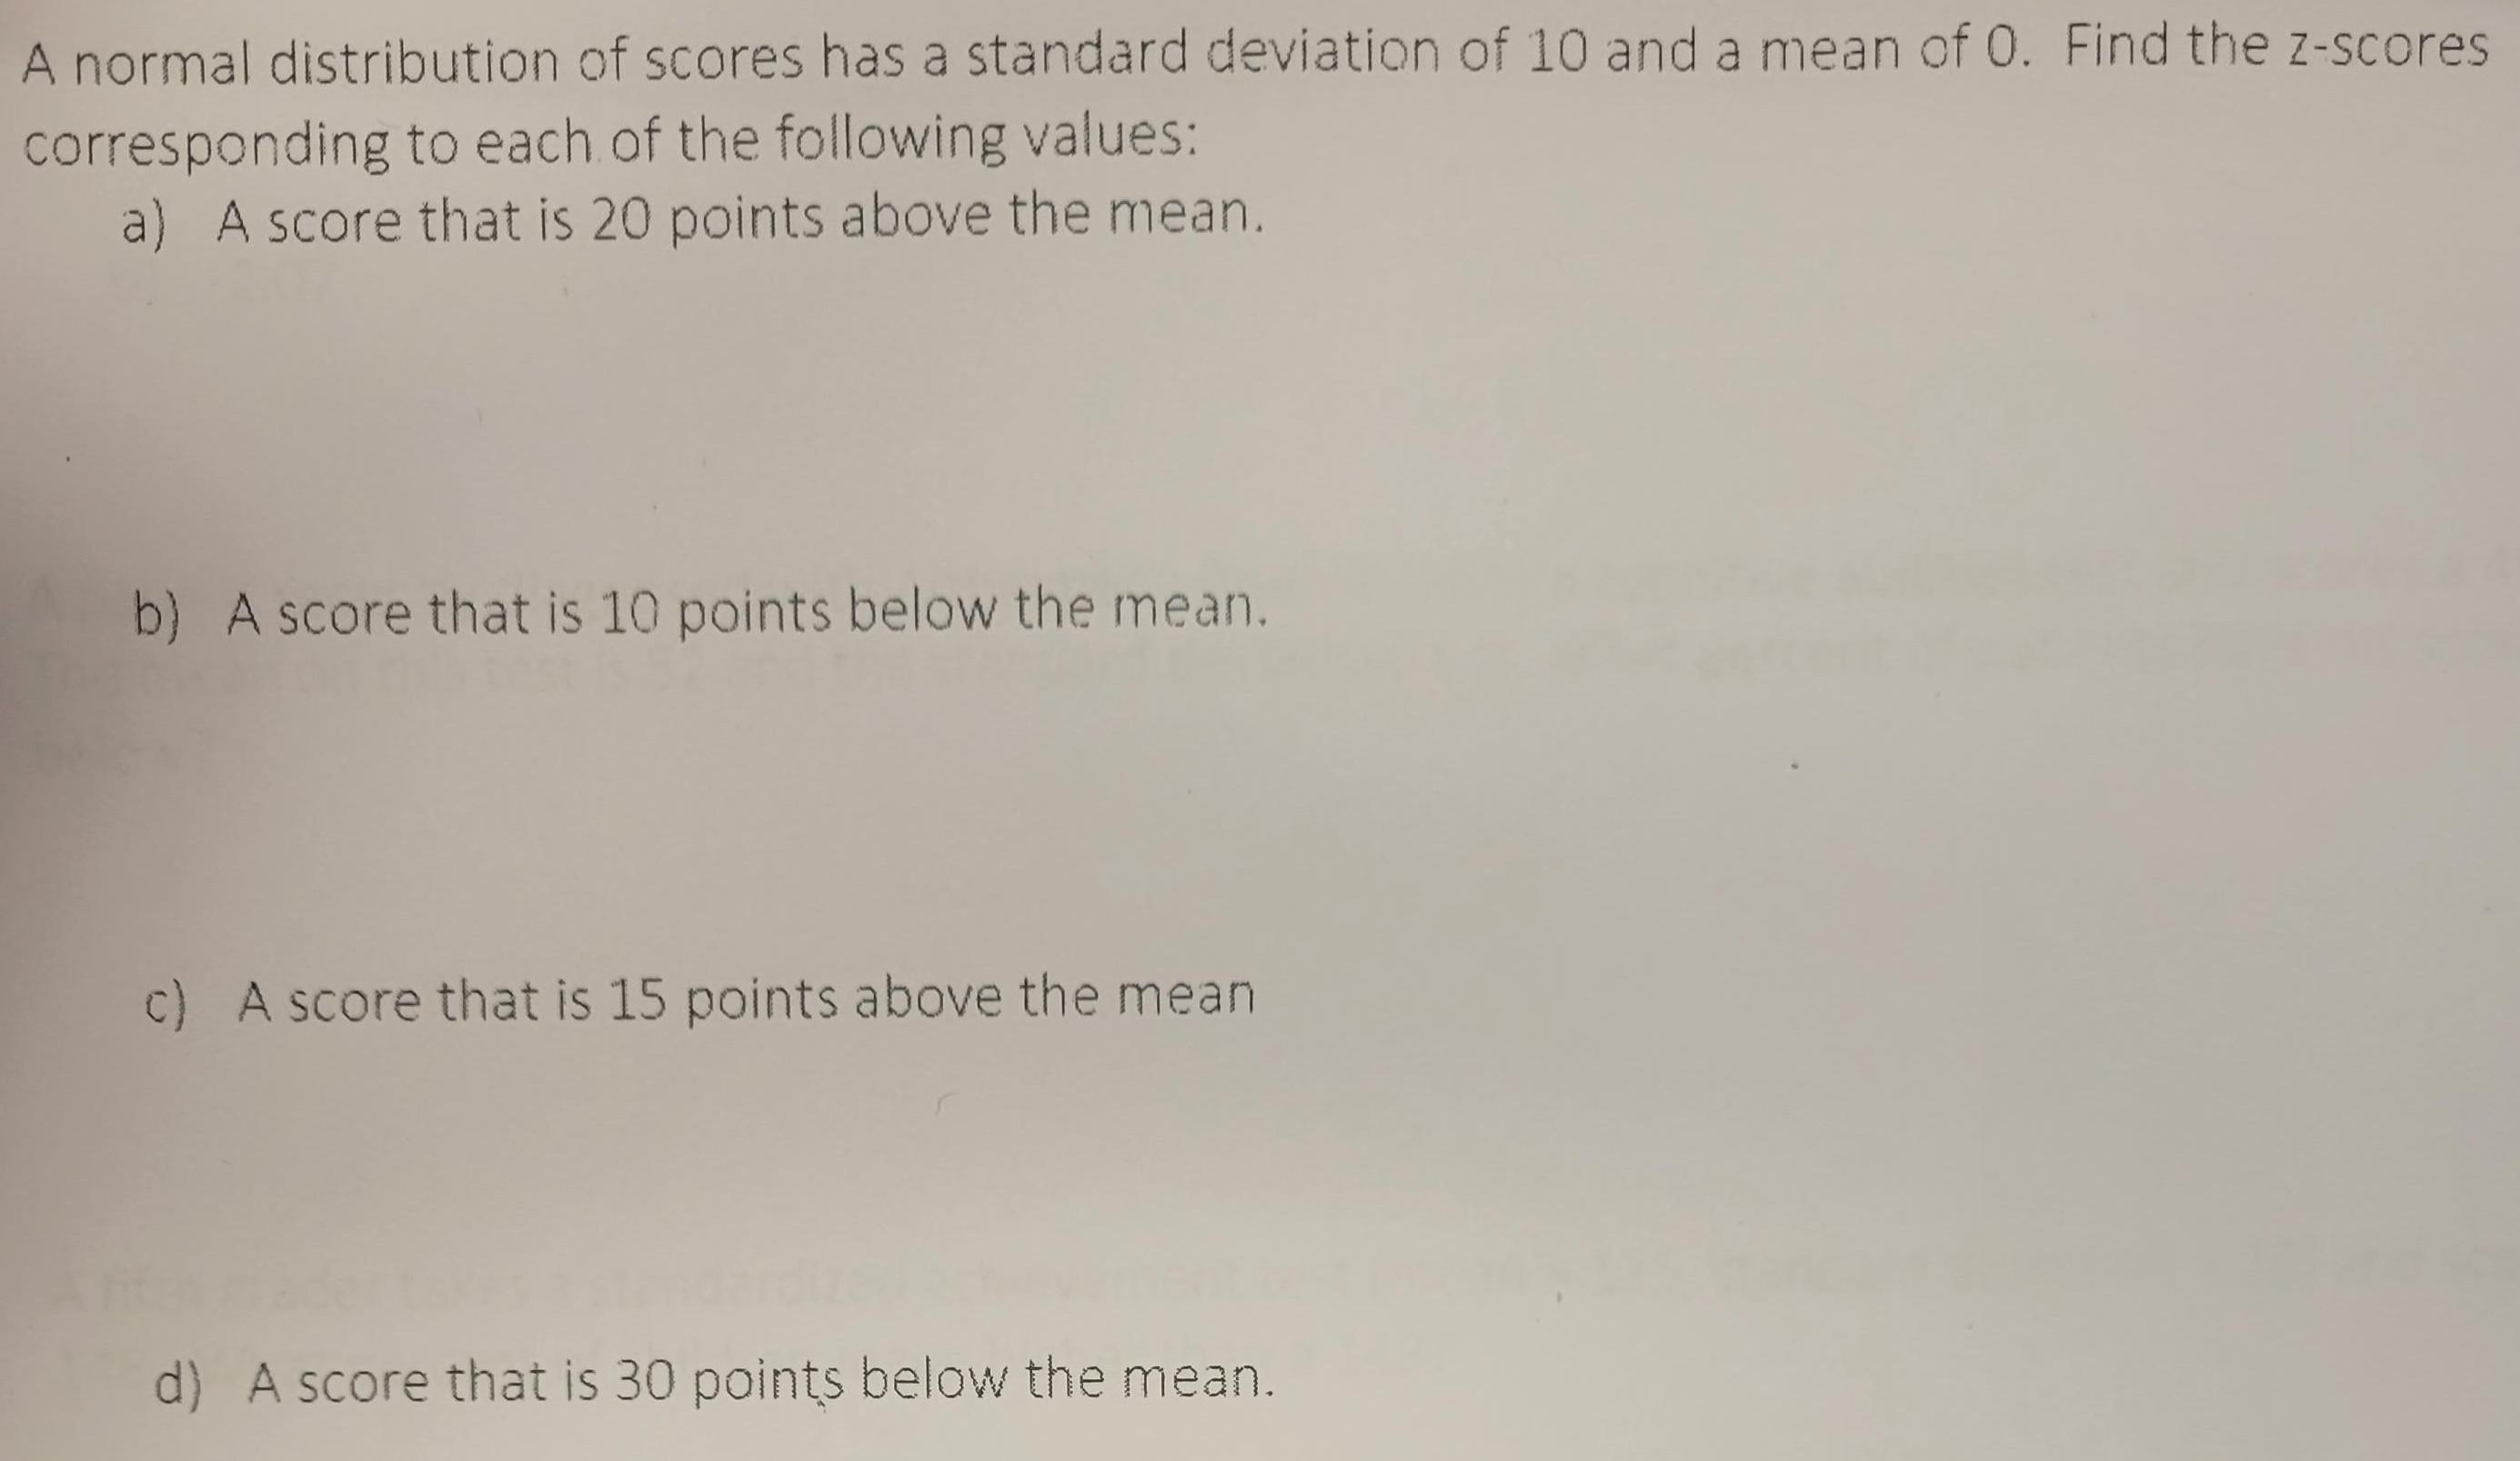
StatisticsA normal distribution of scores has a standard deviation of 10 and a mean of O. Find the z-scores corresponding to each of the following values:
a) A score that is 20 points above the mean.
b) A score that is 10 points below the mean.
c) A score that is 15 points above the mean
d) A score that is 30 points below the mean.

Math
StatisticsA total of 443,818 students at 699 community colleges in 48 states completed the Community College Survey of Student Engagement (CCSSE) between 2009 and 2011. About half (52%) of students reported that they "often" or "very often" work harder than they thought they could to meet an instructor's standards or expectations.
Which of the following is a true statement?
The 52% is a statistic representing a sample of 443,818 community college students.
The 52% is a parameter representing a population of 443,818 community college students.
Math
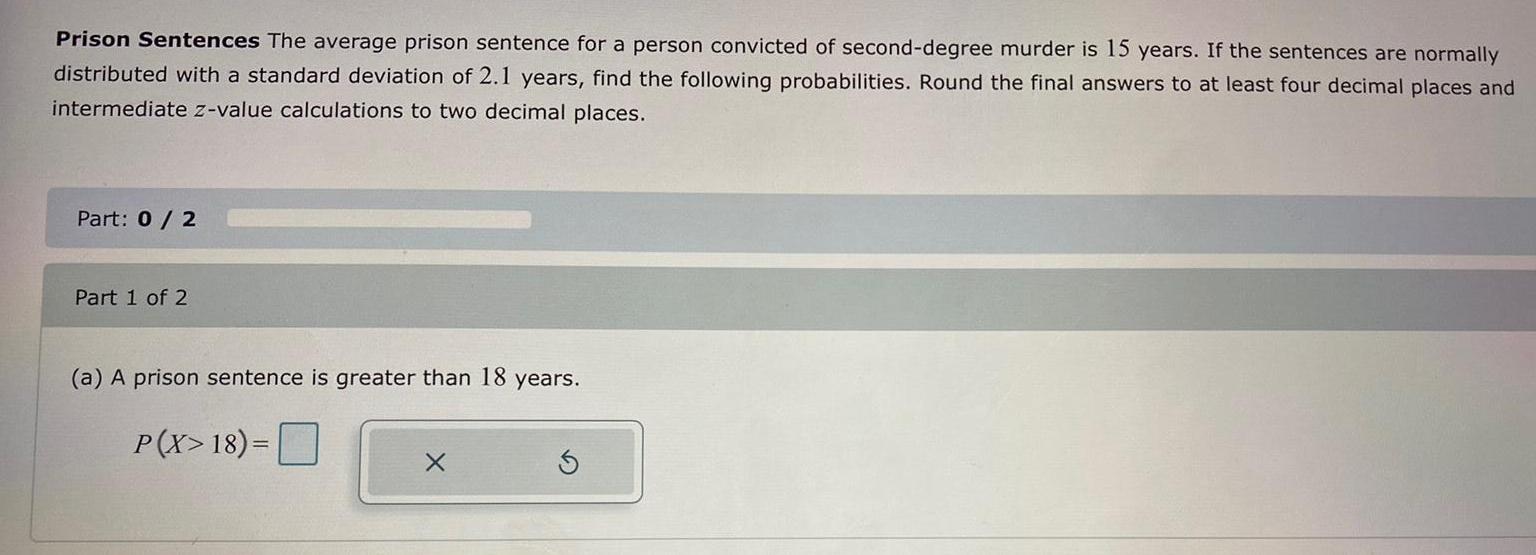
StatisticsPrison Sentences The average prison sentence for a person convicted of second-degree murder is 15 years. If the sentences are normally distributed with a standard deviation of 2.1 years, find the following probabilities. Round the final answers to at least four decimal places and intermediate z-value calculations to two decimal places.
(a) A prison sentence is greater than 18 years.

Math
StatisticsA professor had students keep track of their social interactions for a week. The number of social interactions over the week is shown in the following grouped frequency distribution. Identify the lower limit of the first class.
Math
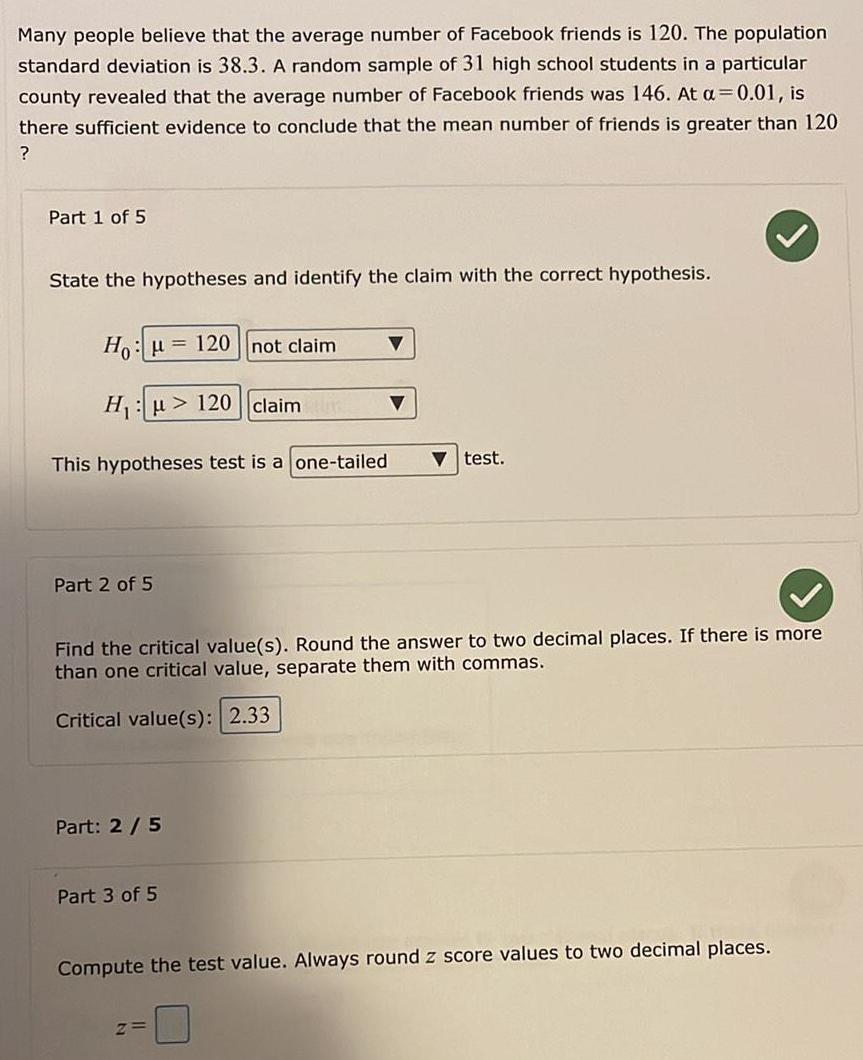
StatisticsMany people believe that the average number of Facebook friends is 120. The population standard deviation is 38.3. A random sample of 31 high school students in a particular county revealed that the average number of Facebook friends was 146. At a = 0.01, is there sufficient evidence to conclude that the mean number of friends is greater than 120?
Part 1 of 5
State the hypotheses and identify the claim with the correct hypothesis.
Ho: μ 120 not claim
H₁: μ> 120 claim
This hypotheses test is a one-tailed
Find the critical value(s). Round the answer to two decimal places. If there is more
than one critical value, separate them with commas.
Critical value(s):
Compute the test value. Always round z score values to two decimal places.
Math
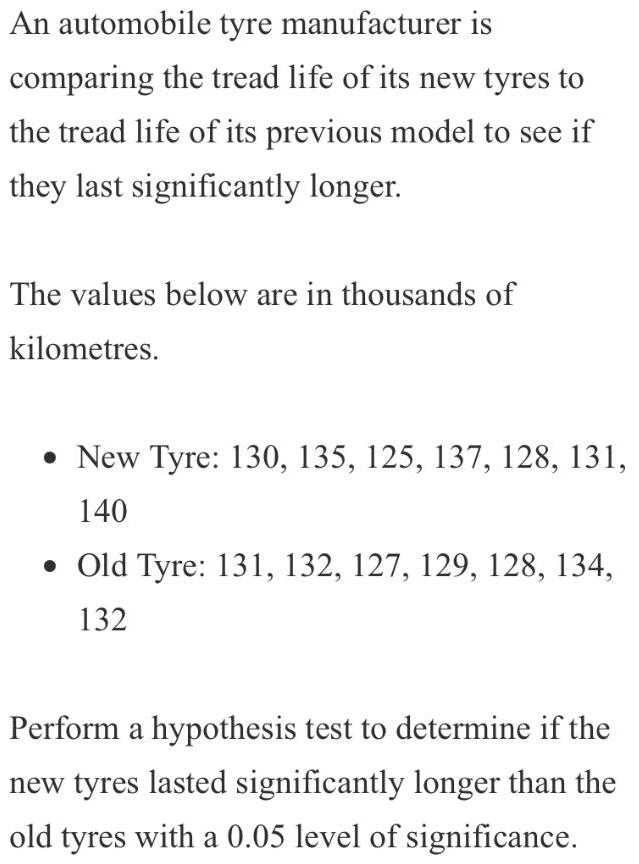
StatisticsAn automobile tyre manufacturer is comparing the tread life of its new tyres to the tread life of its previous model to see if they last significantly longer.
The values below are in thousands of kilometres.
• New Tyre: 130, 135, 125, 137, 128, 131, 140
• Old Tyre: 131, 132, 127, 129, 128, 134, 132
Perform a hypothesis test to determine if the new tyres lasted significantly longer than the old tyres with a 0.05 level of significance.

Math
StatisticsIn a survey of 2262 adults, 742 say they believe in UFOs.
Construct a 99% confidence interval for the population proportion of adults who believe in UFOs.
A 99% confidence interval for the population proportion is (.).
(Round to three decimal places as needed.)

Math
StatisticsData showing the number of releases for each movie studio in a year and the gross receipts are shown below. Based on this data, compute the value of the correlation coefficient for the relationship between the number of releases and the gross receipts.

Math
StatisticsA group of friends compares what they received while trick or treating. They find that the average number of pieces of candy received is 43, with a standard deviation of 2. What is the z-score corresponding to 20 pieces of candy?
Math
StatisticsA study shows that at a particular convenience store, there is a strong positive correlation between the chance of rain in the forecast and the sale of umbrellas. What can be inferred from these results?
As the chance of rain increases, the number of umbrellas purchased will likely decrease.
As the chance of rain increases, the number of umbrellas purchased will likely increase.
As the chance of rain increases, the number of umbrellas purchased will remain the same.
There is not enough information to infer any information from these results.
Math
StatisticsLeyla wants to test the hypothesis that the
grade obtained in Maths is independent of
the grade obtained in Sport. She carries out
the x² test at 10% significance level and
determines that the x² test statistic is 5.91
and the p-value is 0.116. The critical value is
found 6.25. What conclusion should she
draw and why?

Math
StatisticsHospital Noise Levels For a sample of 5 operating rooms taken in a hospital study, the mean noise level was 42.8 decibels and the standard deviation was 12. Find the 90% confidence interval of the true mean of the noise levels in the operating rooms.
Assume the variable is normally distributed. Round your answers to at least two decimal places.
Math
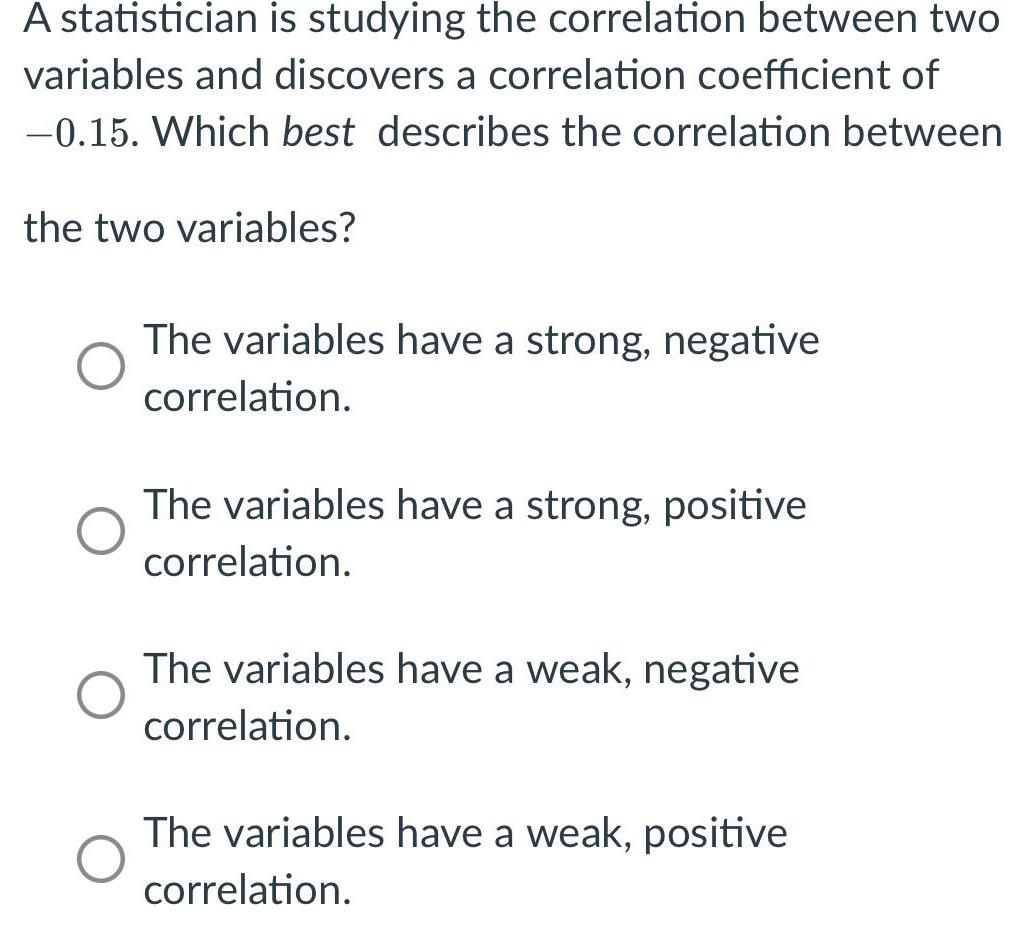
StatisticsA statistician is studying the correlation between two variables and discovers a correlation coefficient of -0.15. Which best describes the correlation between the two variables?
The variables have a strong, negative correlation.
The variables have a strong, positive correlation.
The variables have a weak, negative correlation.
The variables have a weak, positive correlation.
Math
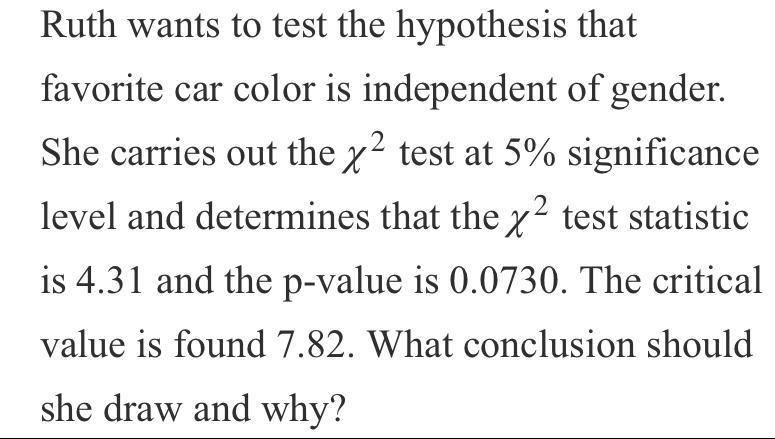
StatisticsRuth wants to test the hypothesis that
favorite car color is independent of gender.
She carries out the x² test at 5% significance
level and determines that the x² test statistic
is 4.31 and the p-value is 0.0730. The critical
value is found 7.82. What conclusion should
she draw and why?

Math
StatisticsA random sample of 30 college students is selected. Each student is asked how much time he or she spent on homework during the previous week. The following times (in hours) are obtained.
19, 17, 18, 25, 24, 18, 17, 20, 20, 21, 22, 25, 18, 20, 24, 16, 17, 15,
15, 18, 24, 25, 19, 20, 21, 20, 22, 15, 16, 19
Construct a frequency distribution for the data.
Math
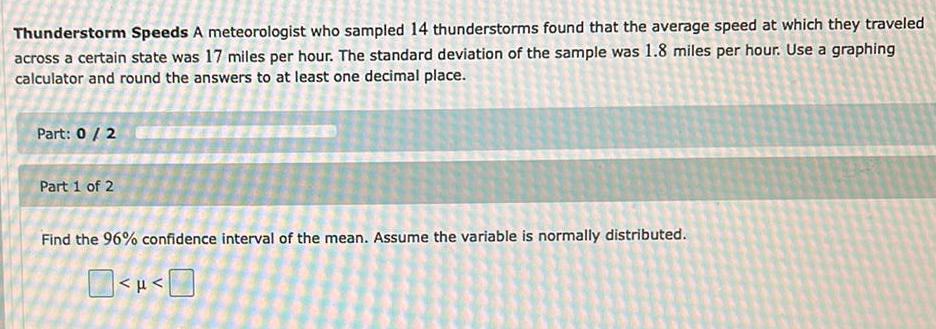
StatisticsThunderstorm Speeds A meteorologist who sampled 14 thunderstorms found that the average speed at which they traveled
across a certain state was 17 miles per hour. The standard deviation of the sample was 1.8 miles per hour. Use a graphing calculator and round the answers to at least one decimal place.
Part: 0 / 2
Part 1 of 2
Find the 96% confidence interval of the mean. Assume the variable is normally distributed.
< p <
Math
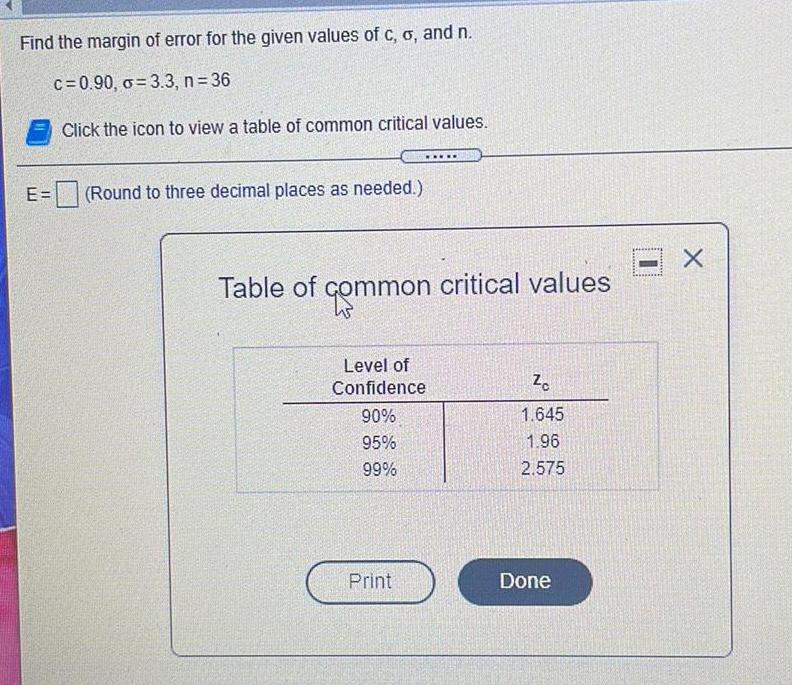
StatisticsFind the margin of error for the given values of c, o, and n.
c=0.90, o 3.3, n=36
E=
(Round to three decimal places as needed.)
Table of common critical values
Level of Confidence Zc
90%/95%/99% 1.645/1.96/2.575
Math
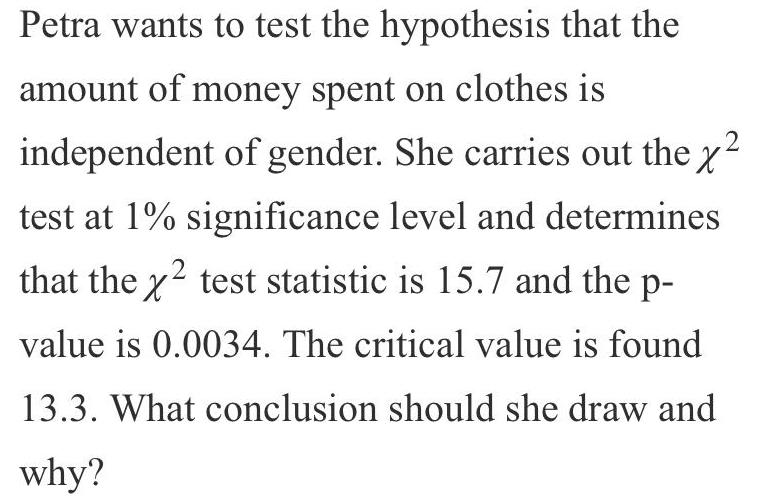
StatisticsPetra wants to test the hypothesis that the amount of money spent on clothes is
independent of gender. She carries out the x² test at 1% significance level and determines
that the x² test statistic is 15.7 and the p-value is 0.0034. The critical value is found 13.3. What conclusion should she draw and why?
Math
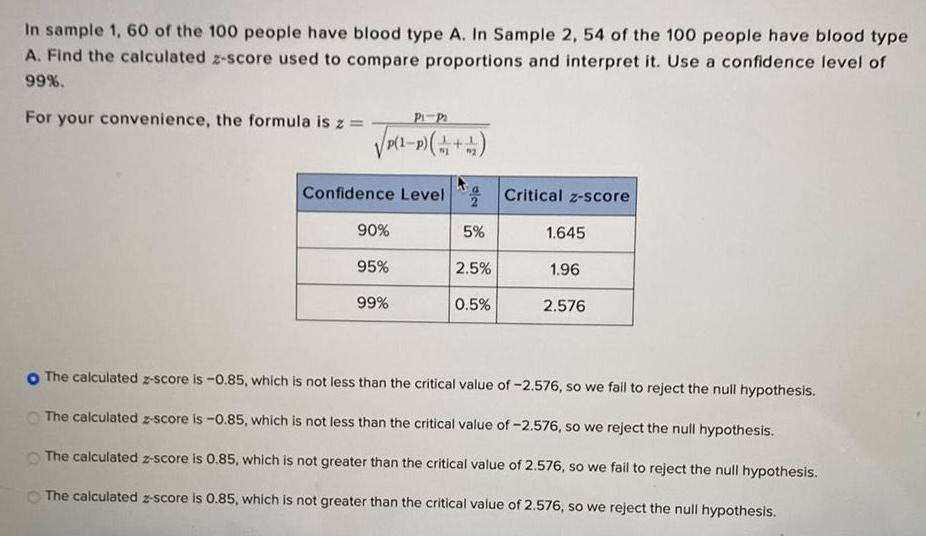
StatisticsIn sample 1, 60 of the 100 people have blood type A. In Sample 2, 54 of the 100 people have blood type A. Find the calculated z-score used to compare proportions and interpret it. Use a confidence level of 99%.
For your convenience, the formula is z = p1-p2 √(p(1-p)(1/n1 + 1/n2)
The calculated z-score is -0.85, which is not less than the critical value of -2.576, so we fail to reject the null hypothesis.
The calculated z-score is -0.85, which is not less than the critical value of -2.576, so we reject the null hypothesis.
The calculated z-score is 0.85, which is not greater than the critical value of 2.576, so we fail to reject the null hypothesis.
The calculated z-score is 0.85, which is not greater than the critical value of 2.576, so we reject the null hypothesis.