Statistics Questions and Answers
Math
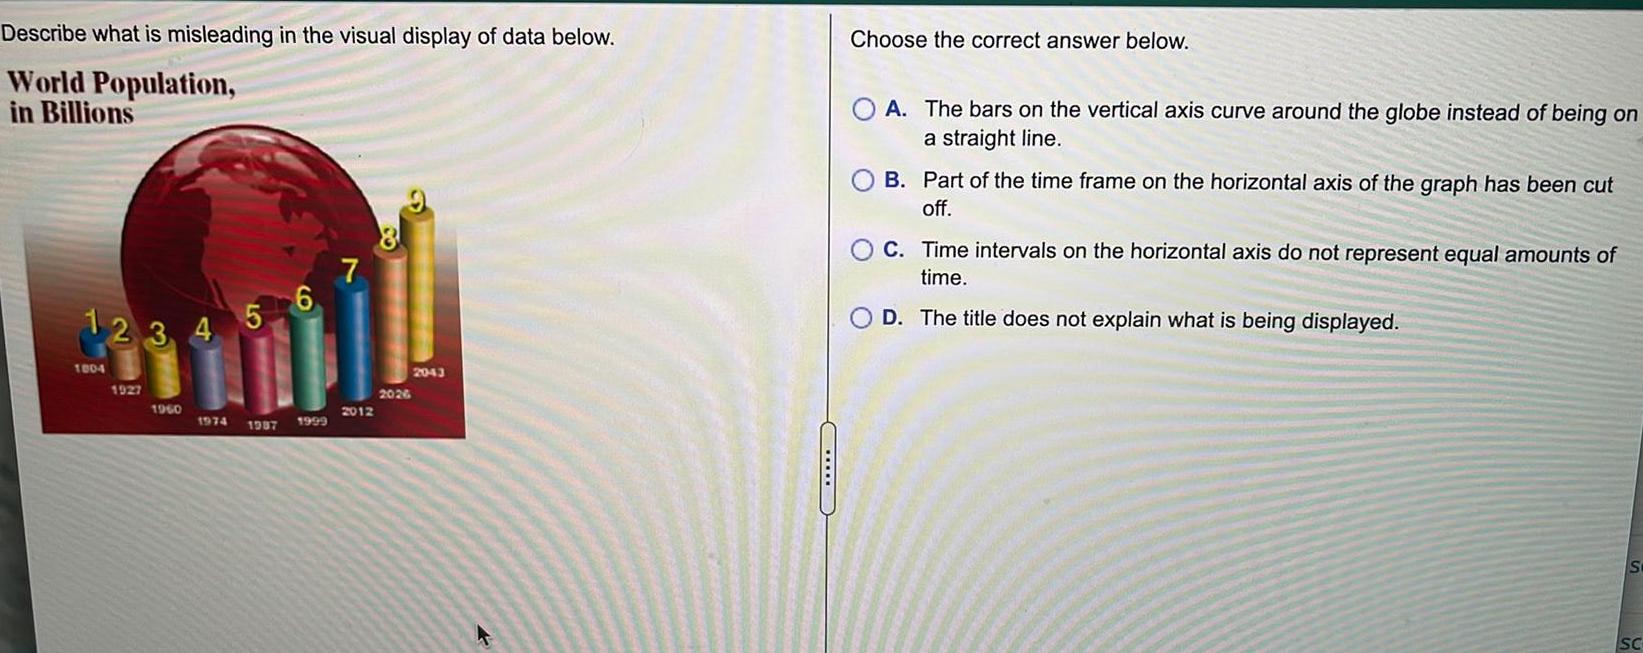
StatisticsDescribe World Population in Billions what is misleading in the visual display of data below 1 2 3 4 5 6 1004 1927 1960 1974 1987 1999 7 2012 2026 2043 Choose the correct answer below A The bars on the vertical axis curve around the globe instead of being on a straight line B Part of the time frame on the horizontal axis of the graph has been cut off C Time intervals on the horizontal axis do not represent equal amounts of time D The title does not explain what is being displayed S SC
Math
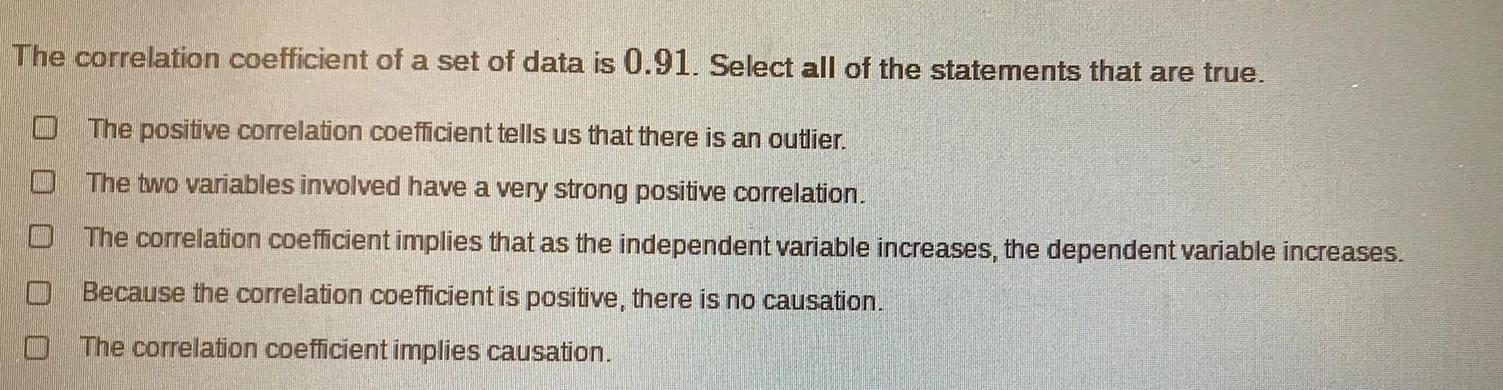
StatisticsThe correlation coefficient of a set of data is 0 91 Select all of the statements that are true The positive correlation coefficient tells us that there is an outlier The two variables involved have a very strong positive correlation The correlation coefficient implies that as the independent variable increases the dependent variable increases Because the correlation coefficient is positive there is no causation The correlation coefficient implies causation
Math
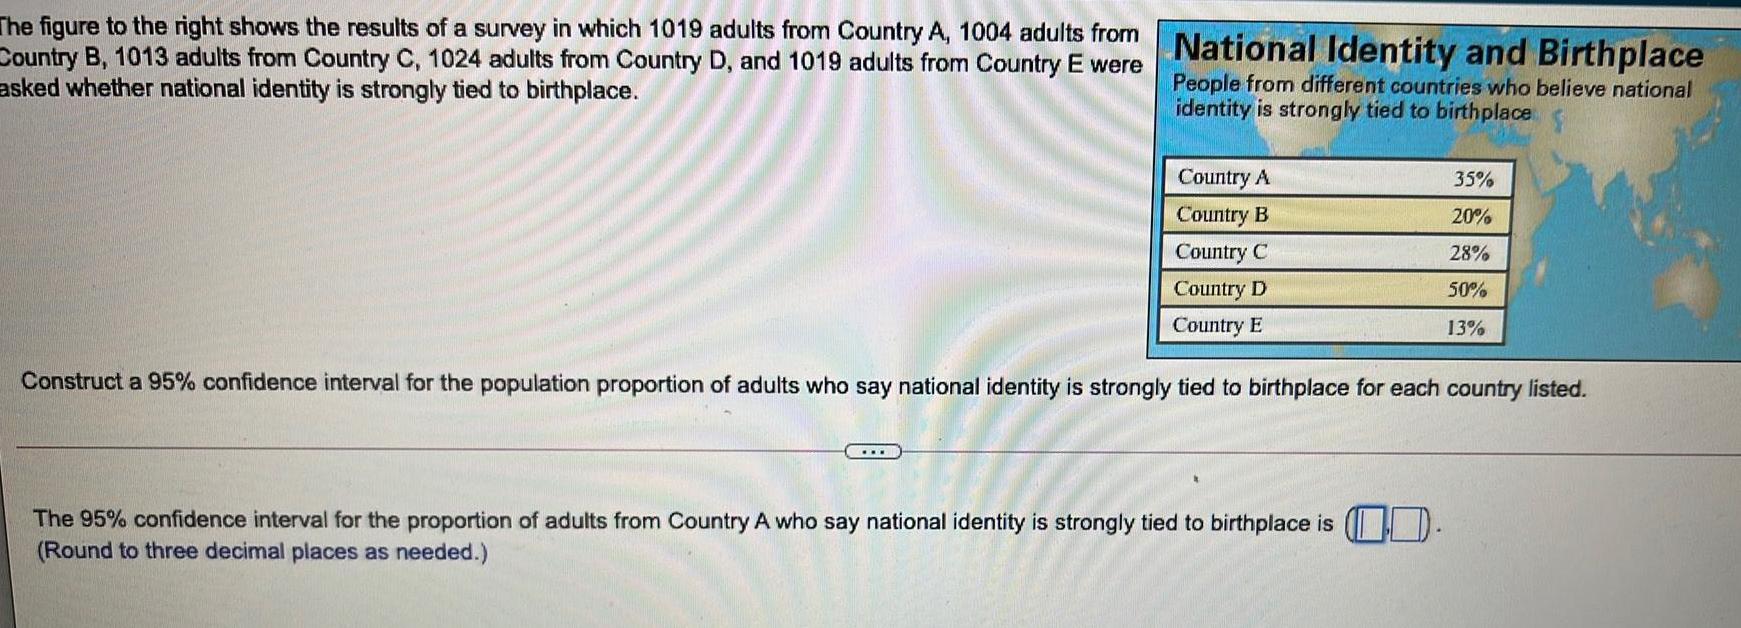
StatisticsThe figure to the right shows the results of a survey in which 1019 adults from Country A 1004 adults from National Identity and Birthplace Country B 1013 adults from Country C 1024 adults from Country D and 1019 adults from Country E were asked whether national identity is strongly tied to birthplace People from different countries who believe national identity is strongly tied to birthplace Country A Country B Country C Country D Country E 35 20 28 50 13 Construct a 95 confidence interval for the population proportion of adults who say national identity is strongly tied to birthplace for each country listed The 95 confidence interval for the proportion of adults from Country A who say national identity is strongly tied to birthplace is Round to three decimal places as needed

Math
StatisticsUse the Empirical Rule The mean speed of a sample of vehicles along a stretch of highway is 69 miles per hour with a standard deviation of 5 miles per hour Estimate the percent of vehicles whose speeds are between 5 per hour and 84 miles per hour Assume the data set has a bell shaped distribution Approximately of vehicles travel between 54 miles per hour and 84 miles per hour
Math
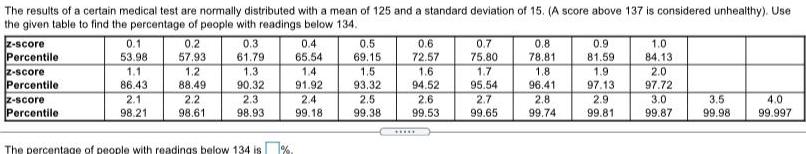
StatisticsThe results of a certain medical test are normally distributed with a mean of 125 and a standard deviation of 15 A score above 137 is considered unhealthy Use the given table to find the percentage of people with readings below 134 z score Percentile z score Percentile z score Percentile 0 1 53 98 1 1 86 43 2 1 98 21 0 2 57 93 1 2 88 49 2 2 98 61 0 3 61 79 1 3 90 32 2 3 98 93 0 4 65 54 1 4 91 92 2 4 99 18 The percentage of people with readings below 134 is 0 5 69 15 1 5 93 32 2 5 99 38 0 6 72 57 1 6 94 52 2 6 99 53 0 7 75 80 1 7 95 54 2 7 99 65 0 8 78 81 1 8 96 41 2 8 99 74 0 9 81 59 1 9 97 13 2 9 99 81 1 0 84 13 2 0 97 72 3 0 99 87 3 5 99 98 4 0 99 997
Math
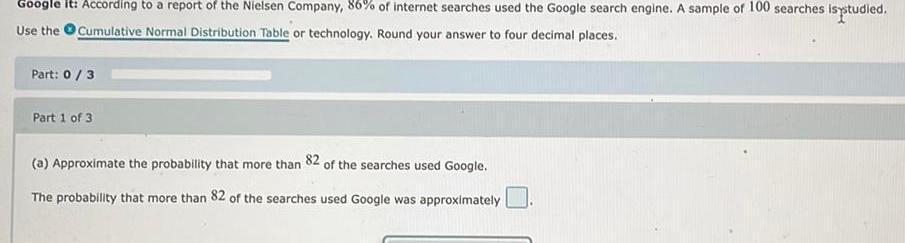
StatisticsGoogle it According to a report of the Nielsen Company 86 of internet searches used the Google search engine A sample of 100 searches is studied Use the Cumulative Normal Distribution Table or technology Round your answer to four decimal places Part 0 3 Part 1 of 3 a Approximate the probability that more than 82 of the searches used Google The probability that more than 82 of the searches used Google was approximately
Math
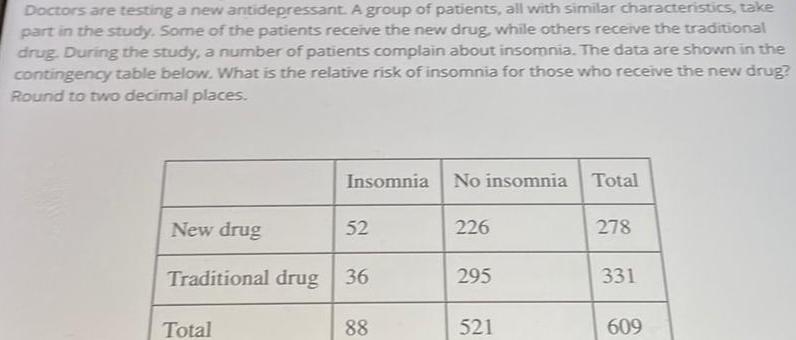
StatisticsDoctors are testing a new antidepressant A group of patients all with similar characteristics take part in the study Some of the patients receive the new drug while others receive the traditional drug During the study a number of patients complain about insomnia The data are shown in the contingency table below What is the relative risk of insomnia for those who receive the new drug Round to two decimal places New drug Insomnia Total 52 Traditional drug 36 88 No insomnia Total 226 295 521 278 331 609
Math
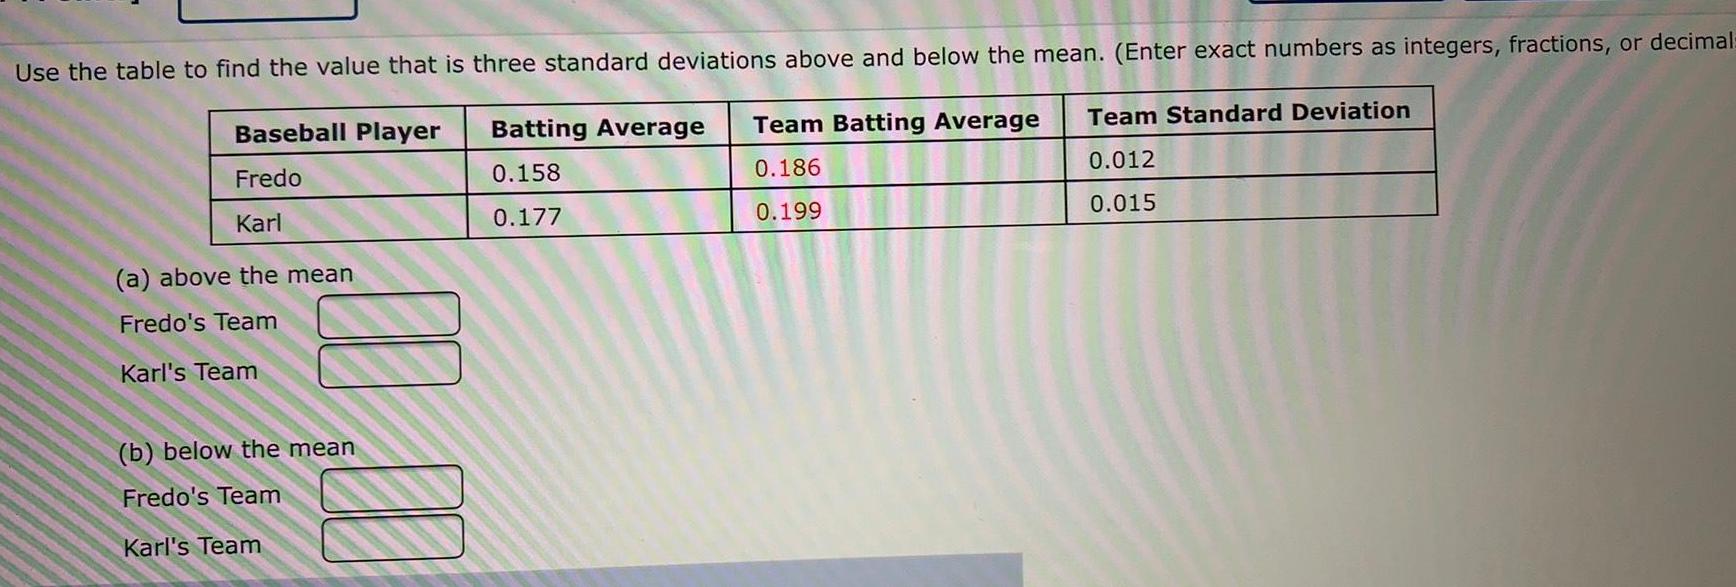
StatisticsUse the table to find the value that is three standard deviations above and below the mean Enter exact numbers as integers fractions or decimal Baseball Player Fredo Batting Average Team Batting Average 0 158 0 186 Karl 0 177 0 199 a above the mean Fredo s Team Karl s Team b below the mean Fredo s Team Karl s Team Team Standard Deviation 0 012 0 015
Math
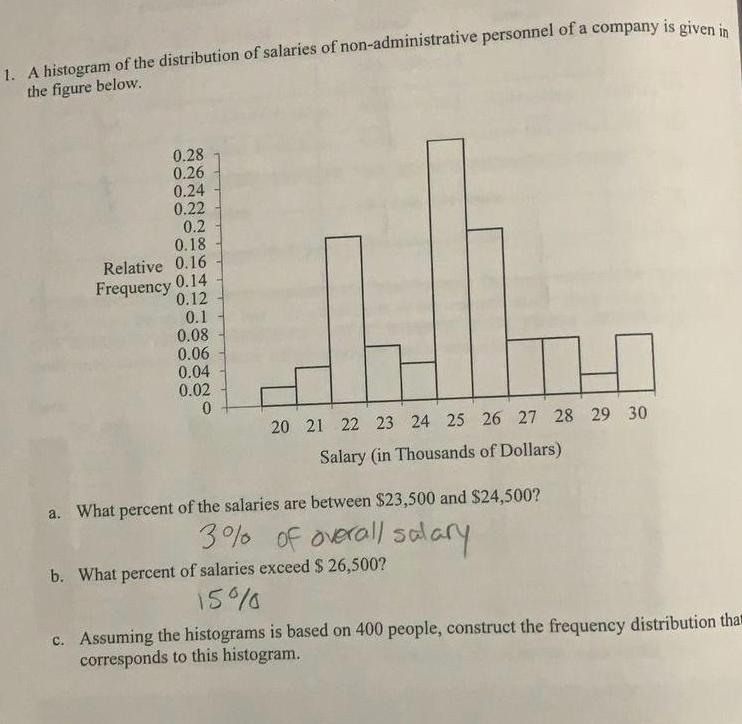
Statistics1 A histogram of the distribution of salaries of non administrative personnel of a company is given in the figure below 0 28 0 26 0 24 0 22 0 2 0 18 Relative 0 16 Frequency 0 14 0 12 0 1 0 08 0 06 0 04 0 02 0 0 20 21 22 23 24 25 26 27 28 29 30 Salary in Thousands of Dollars a What percent of the salaries are between 23 500 and 24 500 3 of overall salary b What percent of salaries exceed 26 500 15 c Assuming the histograms is based on 400 people construct the frequency distribution tha corresponds to this histogram
Math
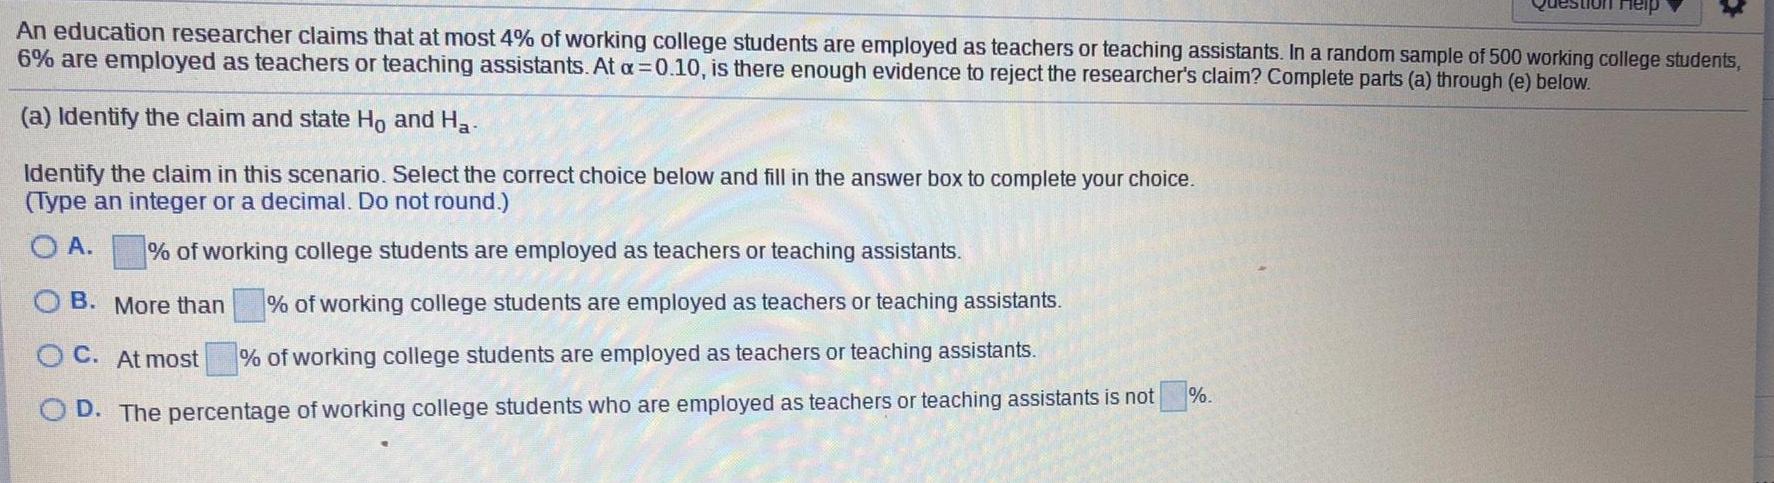
StatisticsAn education researcher claims that at most 4 of working college students are employed as teachers or teaching assistants In a random sample of 500 working college students 6 are employed as teachers or teaching assistants At a 0 10 is there enough evidence to reject the researcher s claim Complete parts a through e below a Identify the claim and state Ho and Ha Identify the claim in this scenario Select the correct choice below and fill in the answer box to complete your choice Type an integer or a decimal Do not round OA of working college students are employed as teachers or teaching assistants of working college students are employed as teachers or teaching assistants OB More than OC At most of working college students are employed as teachers or teaching assistants OD The percentage of working college students who are employed as teachers or teaching assistants is not stion Help
Math
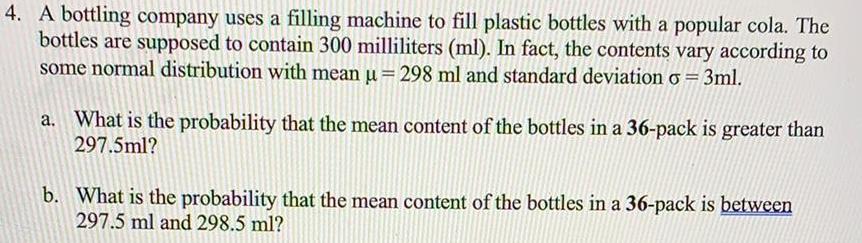
Statistics4 A bottling company uses a filling machine to fill plastic bottles with a popular cola The bottles are supposed to contain 300 milliliters ml In fact the contents vary according to some normal distribution with mean u 298 ml and standard deviation o 3ml a What is the probability that the mean content of the bottles in a 36 pack is greater than 297 5ml b What is the probability that the mean content of the bottles in a 36 pack is between 297 5 ml and 298 5 ml
Math
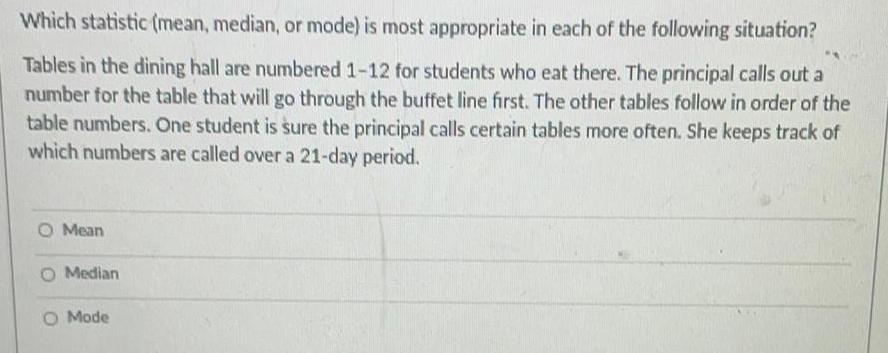
StatisticsWhich statistic mean median or mode is most appropriate in each of the following situation Tables in the dining hall are numbered 1 12 for students who eat there The principal calls out a number for the table that will go through the buffet line first The other tables follow in order of the table numbers One student is sure the principal calls certain tables more often She keeps track of which numbers are called over a 21 day period O Mean Median O Mode
Math
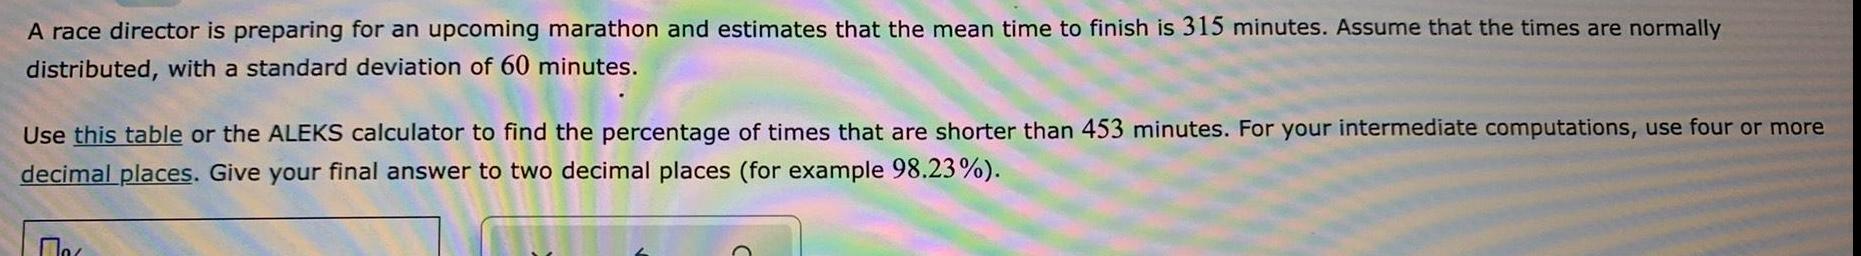
StatisticsA race director is preparing for an upcoming marathon and estimates that the mean time to finish is 315 minutes Assume that the times are normally distributed with a standard deviation of 60 minutes Use this table or the ALEKS calculator to find the percentage of times that are shorter than 453 minutes For your intermediate computations use four or more decimal places Give your final answer to two decimal places for example 98 23
Math
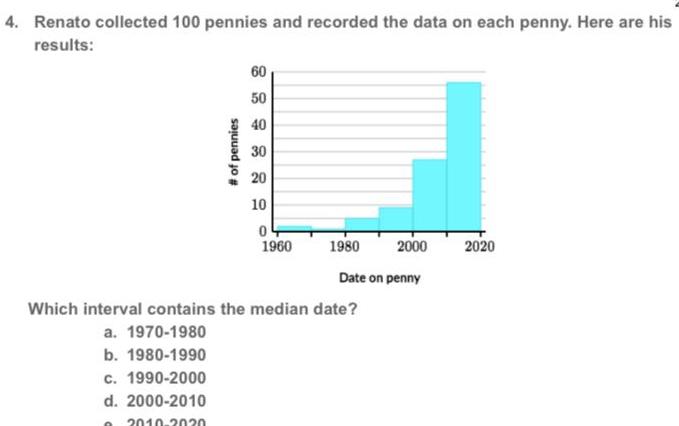
Statistics4 Renato collected 100 pennies and recorded the data on each penny Here are his results of pennies 60 50 40 30 20 10 0 1960 1980 2000 Date on penny Which interval contains the median date a 1970 1980 b 1980 1990 c 1990 2000 d 2000 2010 O 2010 2020 2020
Math
StatisticsFinal marks in Maria s Data Management course are based on 70 for term work 15 for the exam and 15 for the final course project What term mark did Maria receive if her final mark was 87 and she received 84 on the exam and 95 on her final project a 87 b 83 c 85 d 86
Math
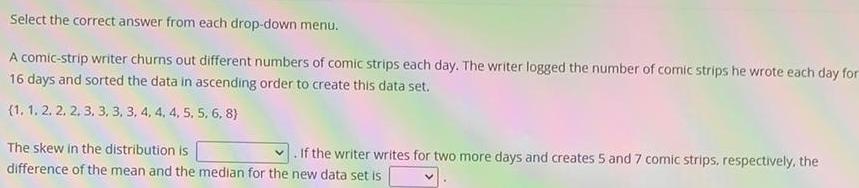
StatisticsSelect the correct answer from each drop down menu A comic strip writer churns out different numbers of comic strips each day The writer logged the number of comic strips he wrote each day for 16 days and sorted the data in ascending order to create this data set 1 1 2 2 2 3 3 3 3 4 4 4 5 5 6 8 The skew in the distribution is If the writer writes for two more days and creates 5 and 7 comic strips respectively the difference of the mean and the median for the new data set is
Math
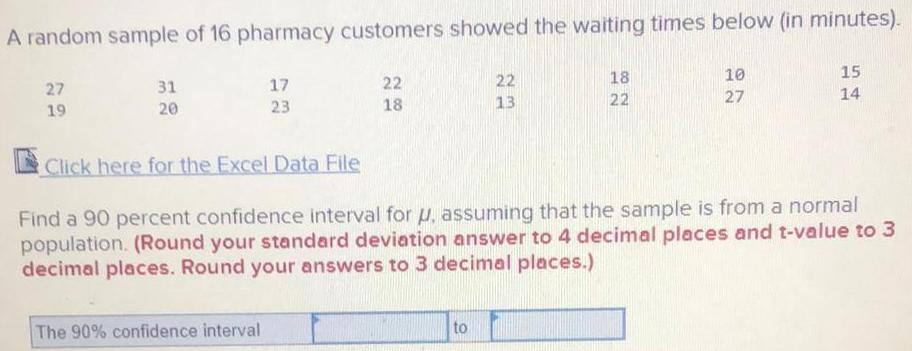
StatisticsA random sample of 16 pharmacy customers showed the waiting times below in minutes 27 19 31 20 17 23 Click here for the Excel Data File The 90 confidence interval 22 18 22 13 to 18 22 10 27 15 Find a 90 percent confidence interval for u assuming that the sample is from a normal population Round your standard deviation answer to 4 decimal places and t value to 3 decimal places Round your answers to 3 decimal places 14
Math
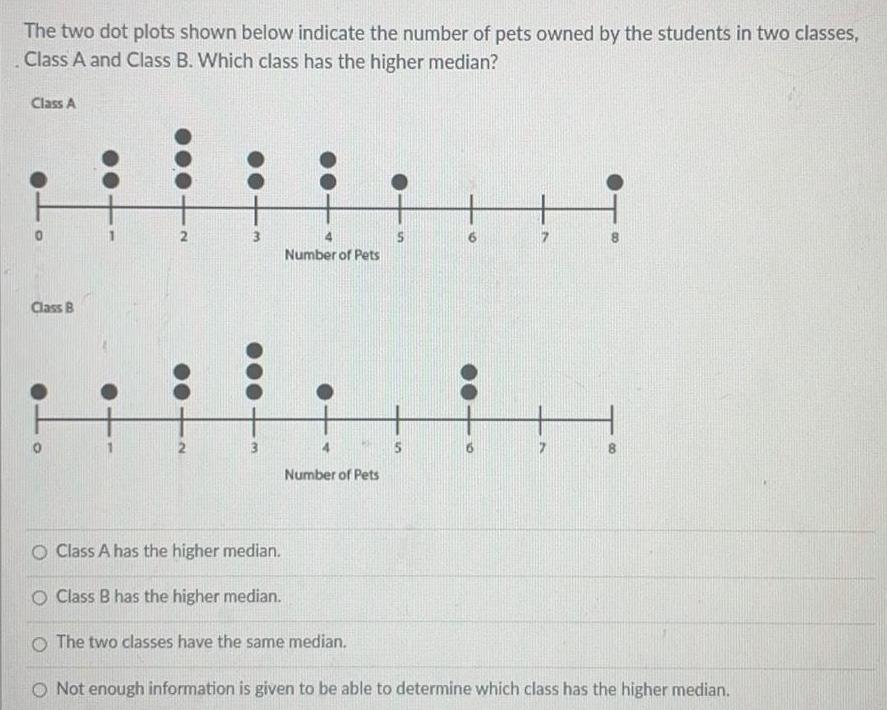
StatisticsThe two dot plots shown below indicate the number of pets owned by the students in two classes Class A and Class B Which class has the higher median Class A Class B I 2 2 3 4 Number of Pets 0 Number of Pets Class A has the higher median O Class B has the higher median The two classes have the same median 5 7 Not enough information is given to be able to determine which class has the higher median
Math
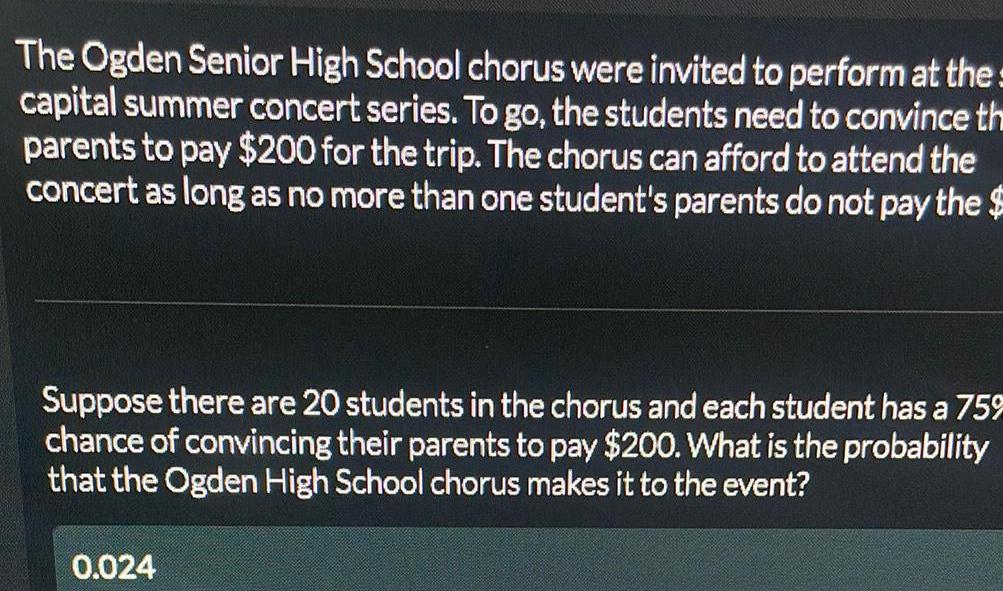
StatisticsThe Ogden Senior High School chorus were invited to perform at the capital summer concert series To go the students need to convince th parents to pay 200 for the trip The chorus can afford to attend the concert as long as no more than one student s parents do not pay the Suppose there are 20 students in the chorus and each student has a 75 chance of convincing their parents to pay 200 What is the probability that the Ogden High School chorus makes it to the event 0 024
Math
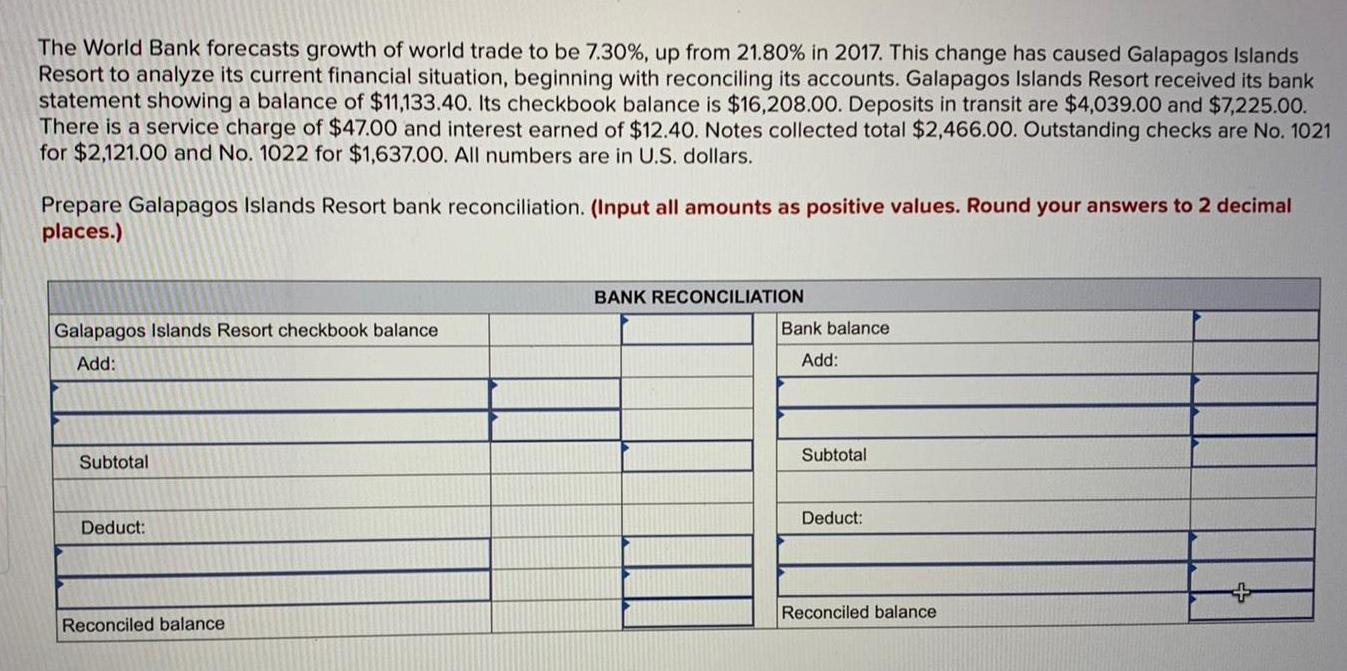
StatisticsThe World Bank forecasts growth of world trade to be 7 30 up from 21 80 in 2017 This change has caused Galapagos Islands Resort to analyze its current financial situation beginning with reconciling its accounts Galapagos Islands Resort received its bank statement showing a balance of 11 133 40 Its checkbook balance is 16 208 00 Deposits in transit are 4 039 00 and 7 225 00 There is a service charge of 47 00 and interest earned of 12 40 Notes collected total 2 466 00 Outstanding checks are No 1021 for 2 121 00 and No 1022 for 1 637 00 All numbers are in U S dollars Prepare Galapagos Islands Resort bank reconciliation Input all amounts as positive values Round your answers to 2 decimal places Galapagos Islands Resort checkbook balance Add Subtotal Deduct Reconciled balance BANK RECONCILIATION Bank balance Add Subtotal Deduct Reconciled balance
Math
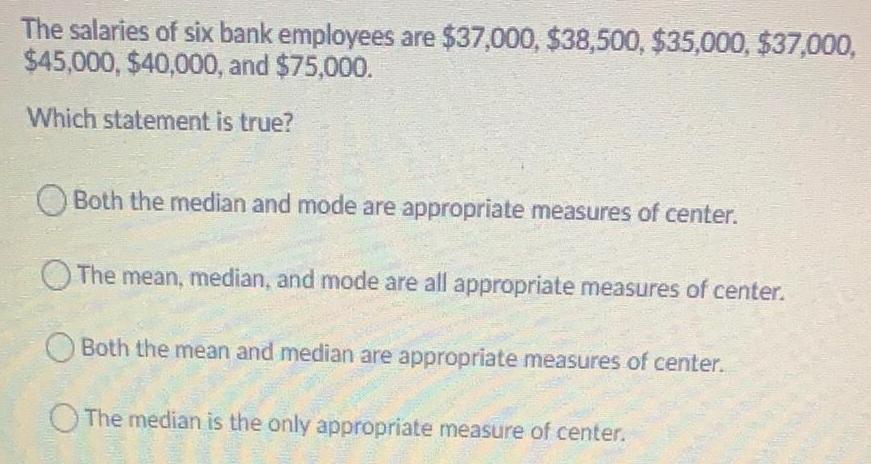
StatisticsThe salaries of six bank employees are 37 000 38 500 35 000 37 000 45 000 40 000 and 75 000 Which statement is true Both the median and mode are appropriate measures of center The mean median and mode are all appropriate measures of center Both the mean and median are appropriate measures of center The median is the only appropriate measure of center
Math
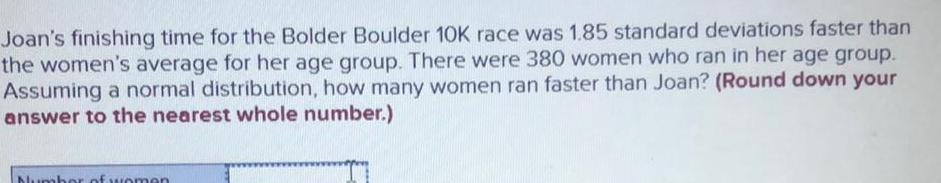
StatisticsJoan s finishing time for the Bolder Boulder 10K race was 1 85 standard deviations faster than the women s average for her age group There were 380 women who ran in her age group Assuming a normal distribution how many women ran faster than Joan Round down your answer to the nearest whole number Number of women
Math
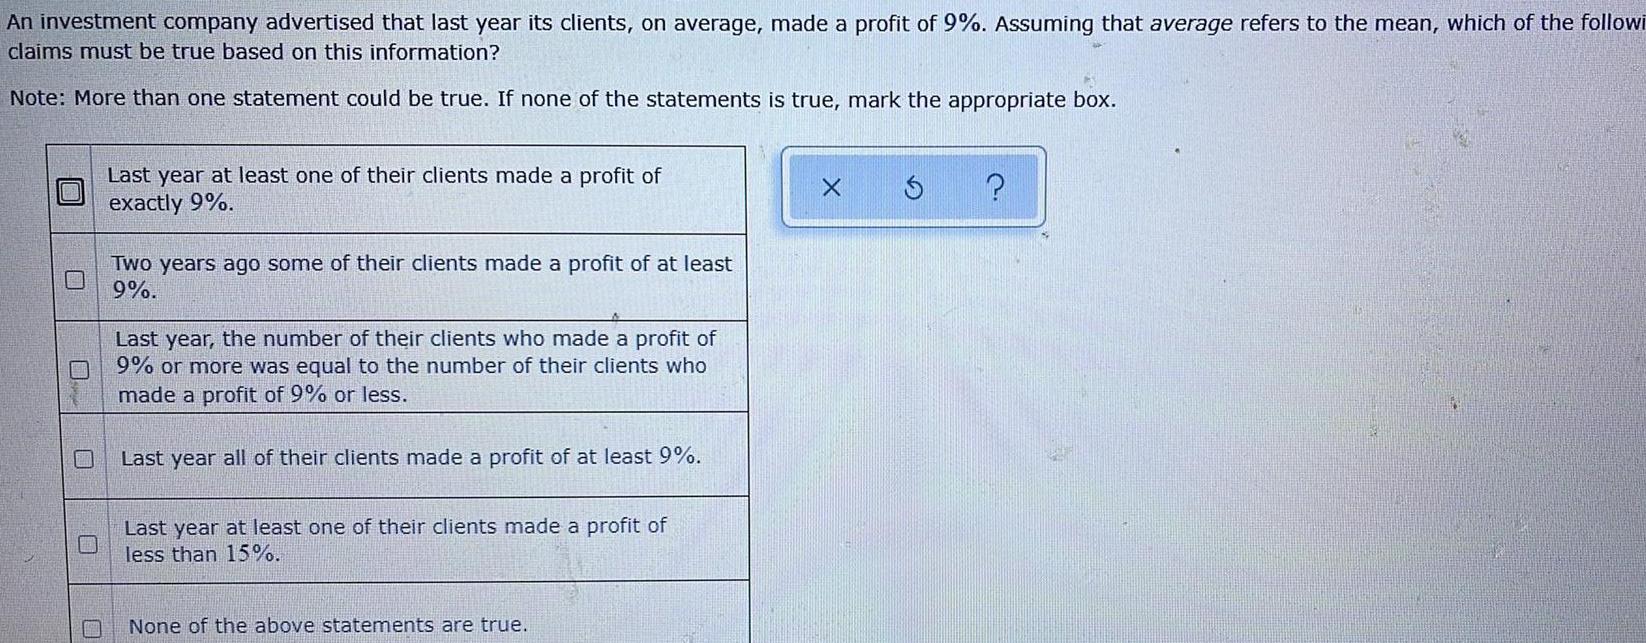
StatisticsAn investment company advertised that last year its clients on average made a profit of 9 Assuming that average refers to the mean which of the followi claims must be true based on this information Note More than one statement could be true If none of the statements is true mark the appropriate box Last year at least one of their clients made a profit of exactly 9 Two years ago some of their clients made a profit of at least 9 Last year the number of their clients who made a profit of 9 or more was equal to the number of their clients who made a profit of 9 or less Last year all of their clients made a profit of at least 9 Last year at least one of their clients made a profit of less than 15 None of the above statements are true X
Math
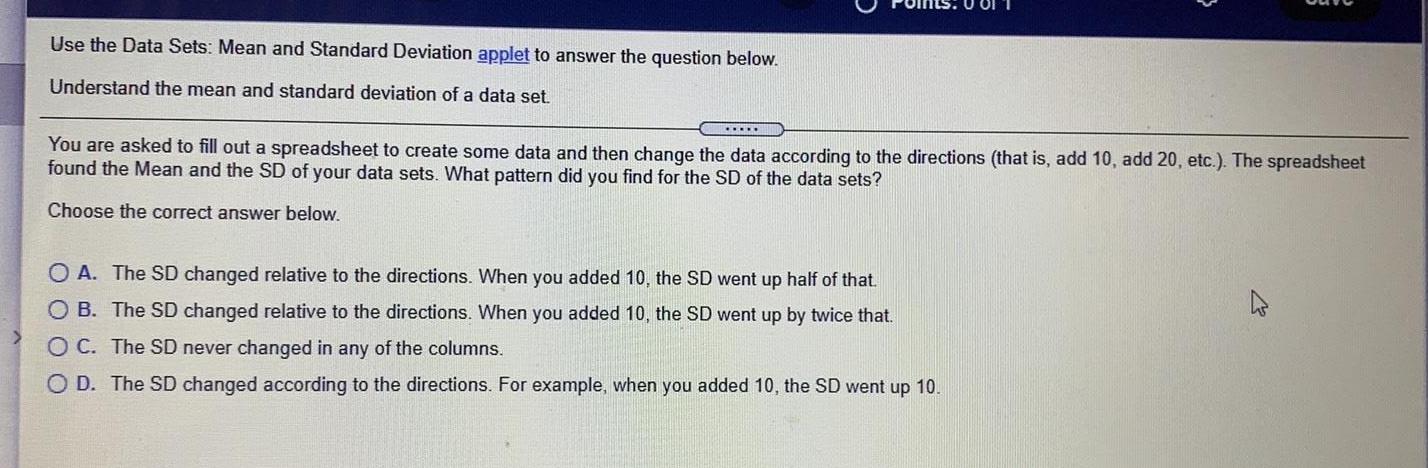
StatisticsUse the Data Sets Mean and Standard Deviation applet to answer the question below Understand the mean and standard deviation of a data set You are asked to fill out a spreadsheet to create some data and then change the data according to the directions that is add 10 add 20 etc The spreadsheet found the Mean and the SD of your data sets What pattern did you find for the SD of the data sets Choose the correct answer below OA The SD changed relative to the directions When you added 10 the SD went up half of that OB The SD changed relative to the directions When you added 10 the SD went up by twice that OC The SD never changed in any of the columns O D The SD changed according to the directions For example when you added 10 the SD went up 10

Math
Statistics1 point Thirty students raised money by selling frozen pizzas In total 400 pizzas were sold The teacher wants to raffle off a prize proportional to the number of pizzas each student sold Describe a process that the teacher can use
Math
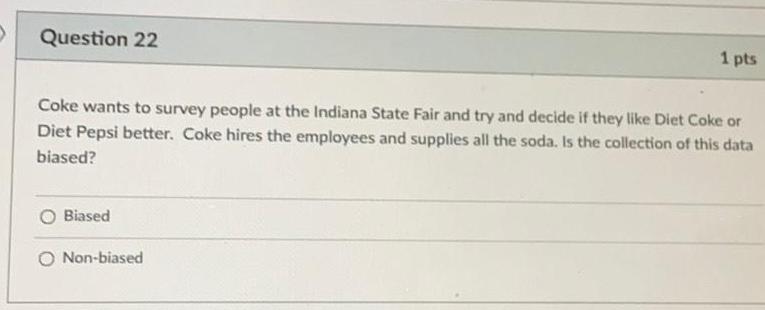
StatisticsQuestion 22 Coke wants to survey people at the Indiana State Fair and try and decide if they like Diet Coke or Diet Pepsi better Coke hires the employees and supplies all the soda Is the collection of this data biased Biased 1 pts Non biased
Math
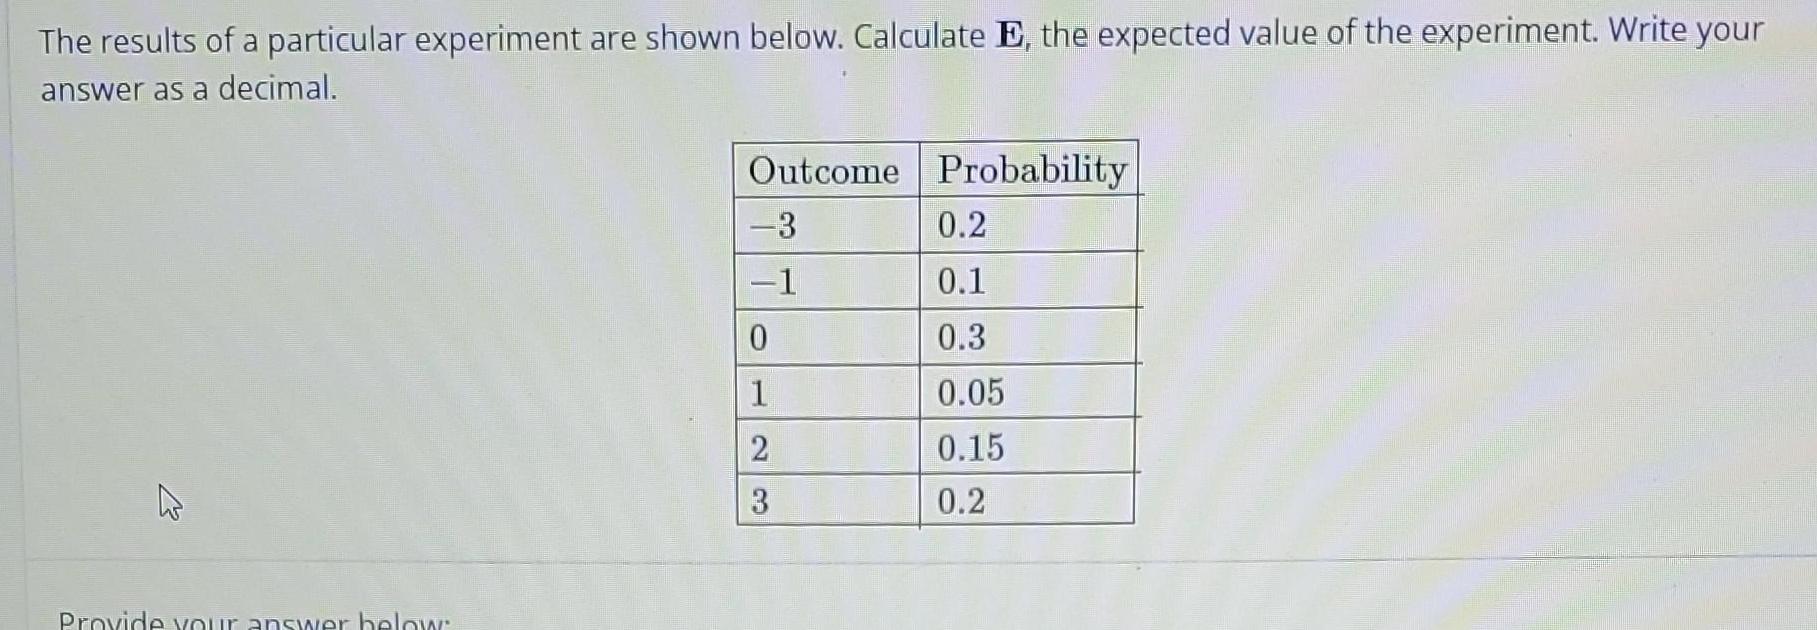
StatisticsThe results of a particular experiment are shown below Calculate E the expected value of the experiment Write your answer as a decimal K Provide your answer below Outcome 3 1 0 1 2 3 Probability 0 2 0 1 0 3 0 05 0 15 0 2
Math
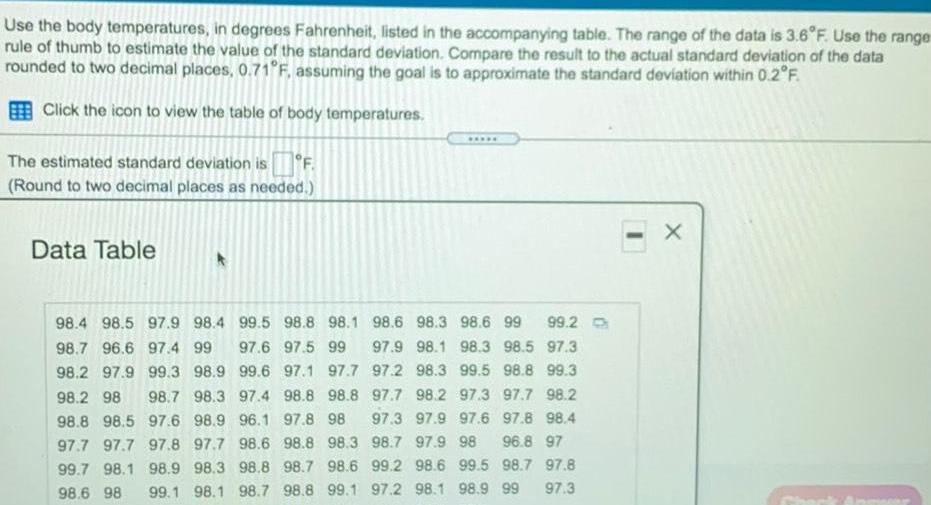
StatisticsUse the body temperatures in degrees Fahrenheit listed in the accompanying table The range of the data is 3 6 F Use the range rule of thumb to estimate the value of the standard deviation Compare the result to the actual standard deviation of the data rounded to two decimal places 0 71 F assuming the goal is to approximate the standard deviation within 0 2 F Click the icon to view the table of body temperatures The estimated standard deviation is F Round to two decimal places as needed Data Table 98 4 98 5 97 9 98 4 99 5 98 8 98 1 98 6 98 3 98 6 99 99 2 98 7 96 6 97 4 99 97 6 97 5 99 97 9 98 1 98 3 98 5 97 3 98 2 97 9 99 3 98 9 99 6 97 1 97 7 97 2 98 3 99 5 98 8 99 3 98 2 98 98 7 98 3 97 4 98 8 98 8 97 7 98 2 97 3 97 7 98 2 98 8 98 5 97 6 98 9 96 1 97 8 98 97 3 97 9 97 6 97 8 98 4 97 7 97 7 97 8 97 7 98 6 98 8 98 3 98 7 97 9 98 96 8 97 99 7 98 1 98 9 98 3 98 8 98 7 98 6 99 2 98 6 99 5 98 7 97 8 98 6 98 97 3 99 1 98 1 98 7 98 8 99 1 97 2 98 1 98 9 99 X
Math
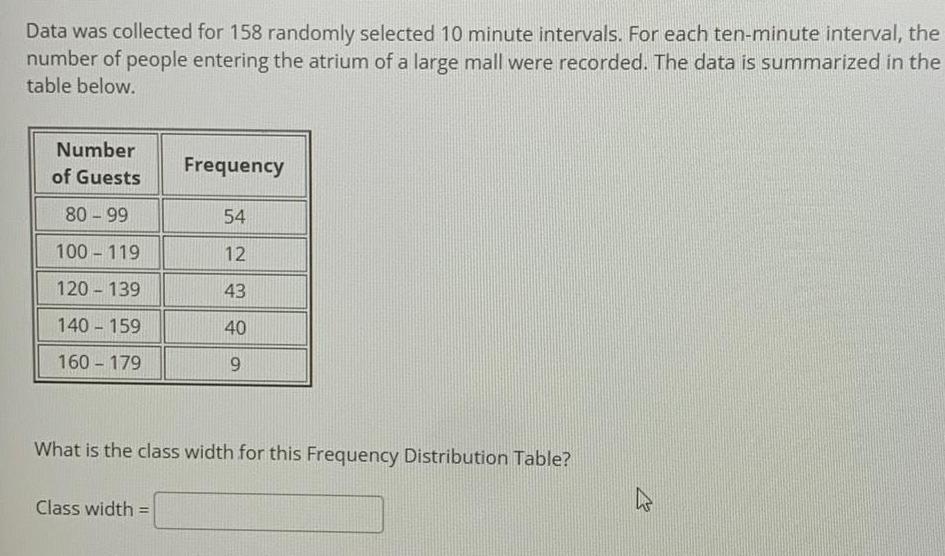
StatisticsData was collected for 158 randomly selected 10 minute intervals For each ten minute interval the number of people entering the atrium of a large mall were recorded The data is summarized in the table below Number of Guests 80 99 100 119 120 139 140 159 160 179 Frequency Class width 54 12 43 40 9 What is the class width for this Frequency Distribution Table
Math
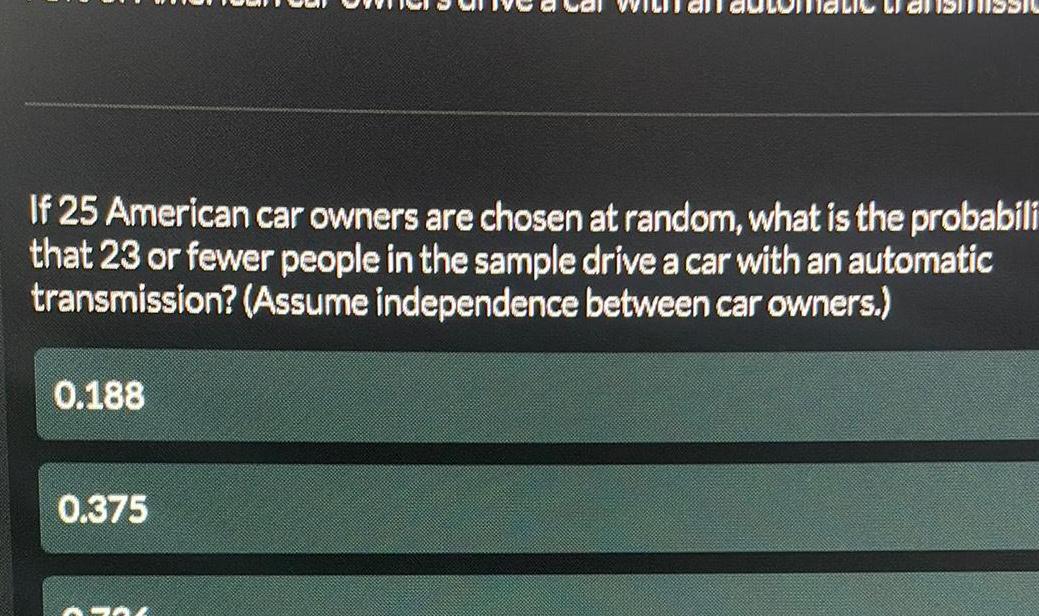
StatisticsIf 25 American car owners are chosen at random what is the probabili that 23 or fewer people in the sample drive a car with an automatic transmission Assume independence between car owners 0 188 0 375

Math
StatisticsCadmium a heavy metal is toxic to animals Mushrooms however are able to absorb and accumulate cadmium at high concentrations Some governments have a safety limit for cadmium in dry vegetables at 1 3 parts per mill ypothesis test is to be performed to decide whether the mean cadmium level in a certain mushroom i s not equal to the government s recommended limit Complete parts a through c below Determine the null hypothesis toi ppm Type an integer or a decimal Do not round
Math
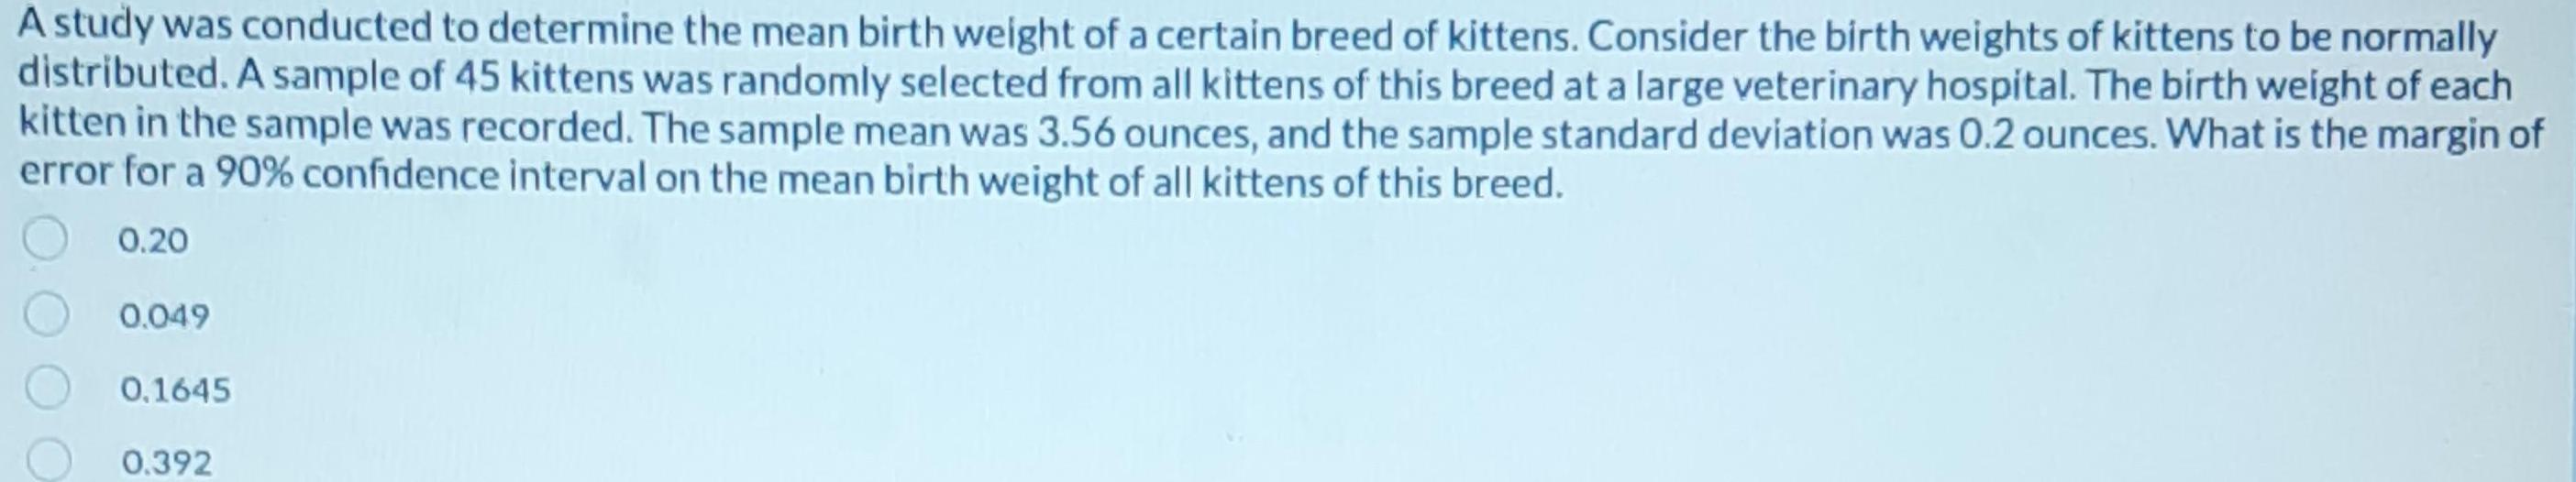
StatisticsA study was conducted to determine the mean birth weight of a certain breed of kittens Consider the birth weights of kittens to be normally distributed A sample of 45 kittens was randomly selected from all kittens of this breed at a large veterinary hospital The birth weight of each kitten in the sample was recorded The sample mean was 3 56 ounces and the sample standard deviation was 0 2 ounces What is the margin of error for a 90 confidence interval on the mean birth weight of all kittens of this breed 0 20 0 049 0 1645 0 392
Math
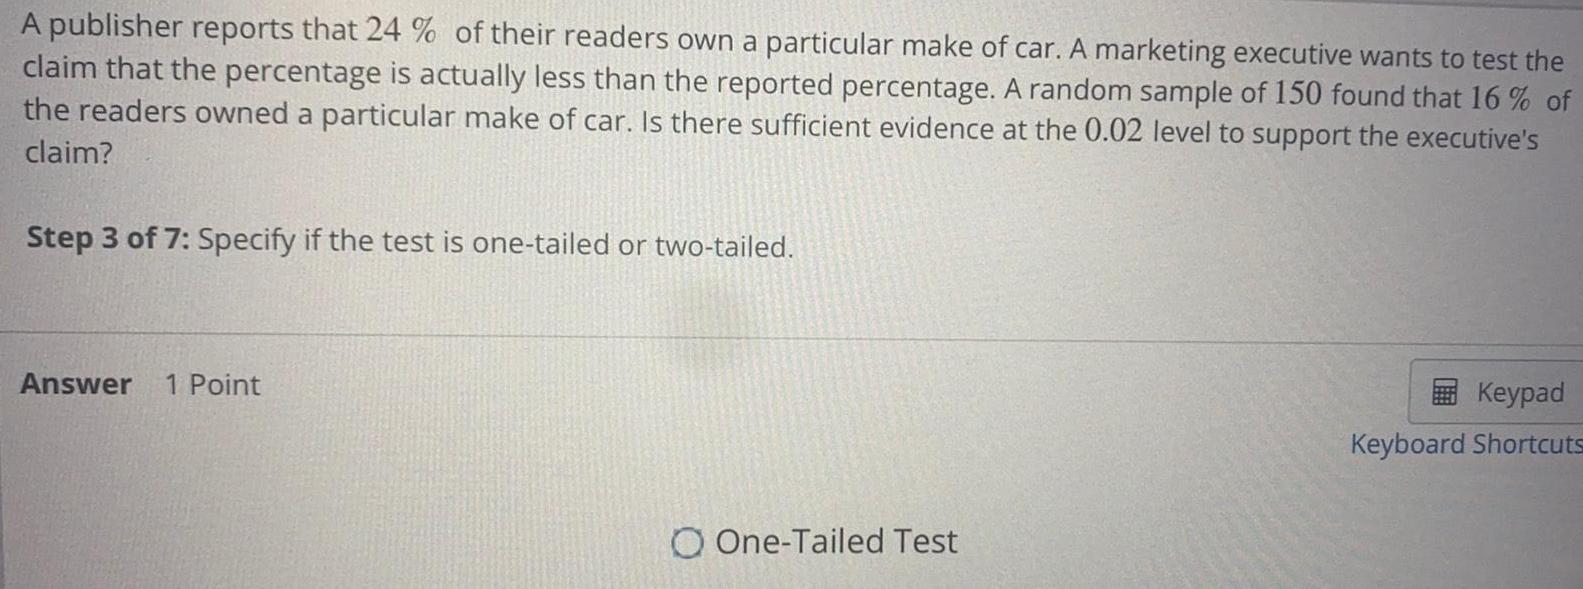
StatisticsA publisher reports that 24 of their readers own a particular make of car A marketing executive wants to test the claim that the percentage is actually less than the reported percentage A random sample of 150 found that 16 of the readers owned a particular make of car Is there sufficient evidence at the 0 02 level to support the executive s claim Step 3 of 7 Specify if the test is one tailed or two tailed Answer 1 Point O One Tailed Test Keypad Keyboard Shortcuts
Math
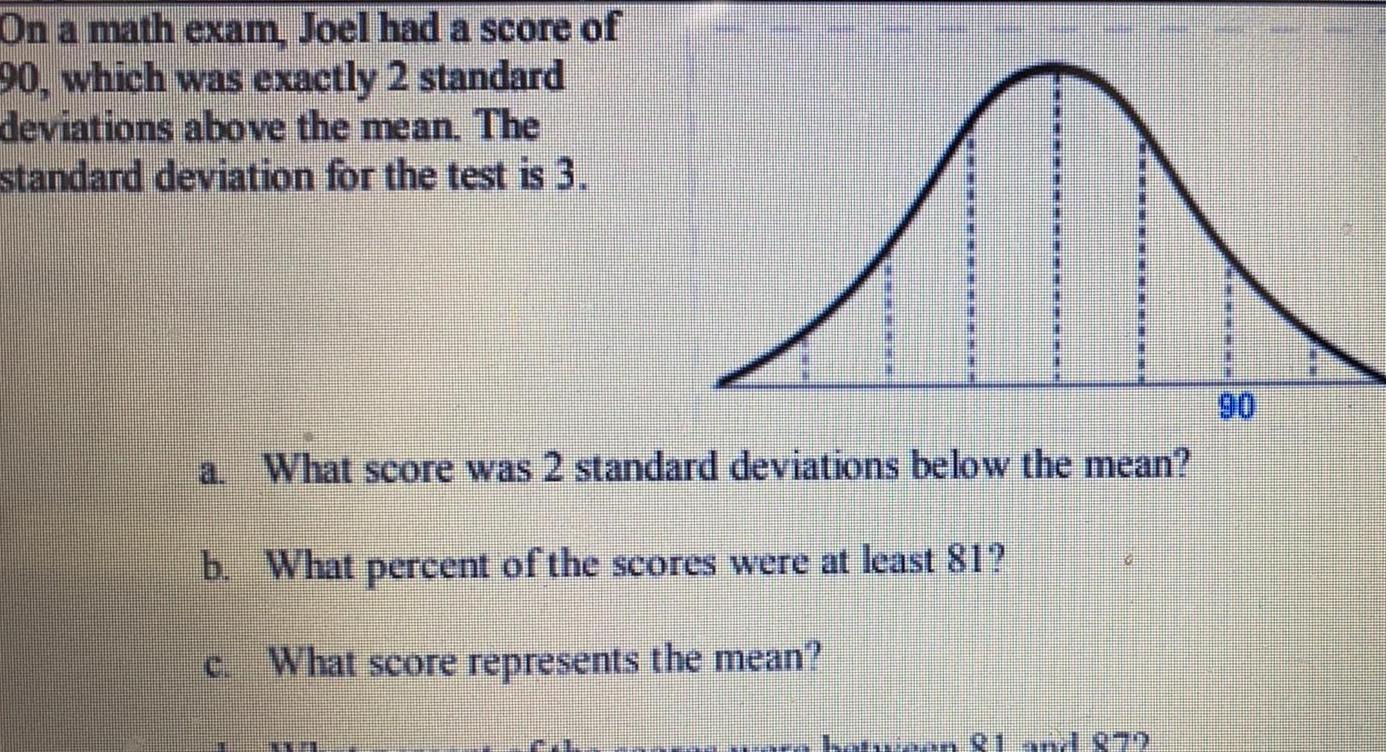
StatisticsOn a math exam Joel had a score of 90 which was exactly 2 standard deviations above the mean The standard deviation for the test is 3 What score was 2 standard deviations below the mean b What percent of the scores were at least 81 What score represents the mean a between R1 andd 079
Math
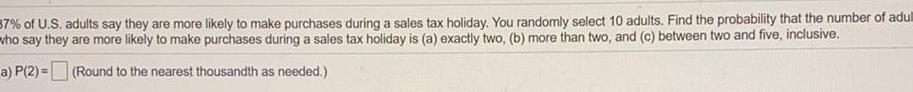
Statistics37 of U S adults say they are more likely to make purchases during a sales tax holiday You randomly select 10 adults Find the probability that the number of adul who say they are more likely to make purchases during a sales tax holiday is a exactly two b more than two and c between two and five inclusive a P 2 Round to the nearest thousandth as needed
Math
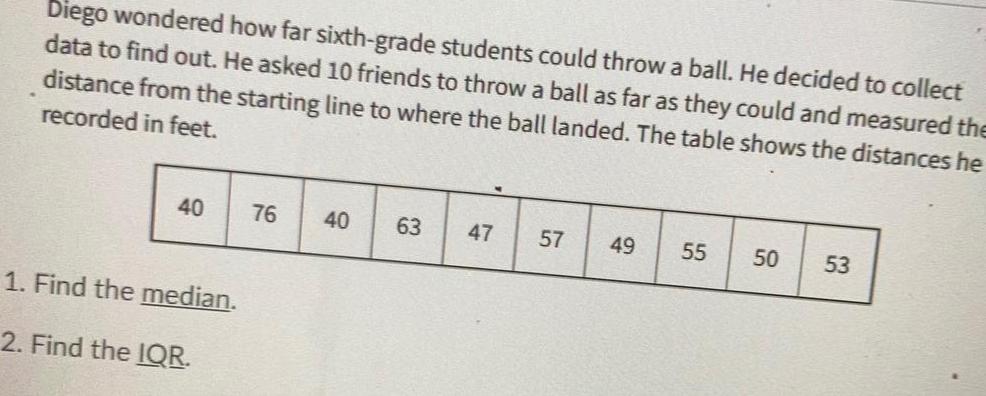
StatisticsDiego wondered how far sixth grade students could throw a ball He decided to collect data to find out He asked 10 friends to throw a ball as far as they could and measured the distance from the starting line to where the ball landed The table shows the distances he recorded in feet 40 1 Find the median 2 Find the IQR 76 40 63 47 57 49 55 50 53
Math
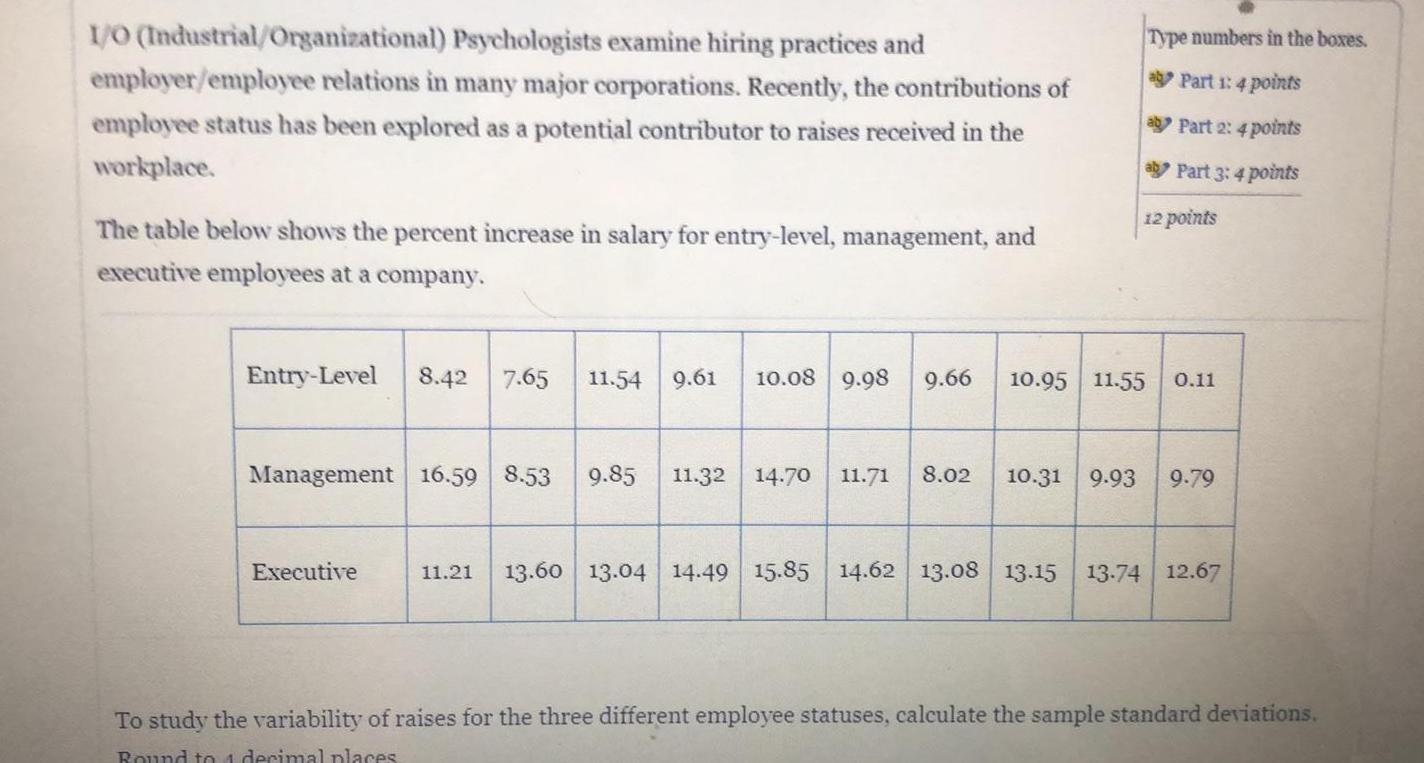
StatisticsI O Industrial Organizational Psychologists examine hiring practices and employer employee relations in many major corporations Recently the contributions of employee status has been explored as a potential contributor to raises received in the workplace The table below shows the percent increase in salary for entry level management and executive employees at a company Entry Level 8 42 7 65 11 54 9 61 10 08 9 98 9 66 Management 16 59 8 53 9 85 11 32 14 70 11 71 8 02 Executive Type numbers in the boxes a Part 1 4 points a Part 2 4 points a Part 3 4 points 12 points 10 95 11 55 0 11 10 31 9 93 9 79 11 21 13 60 13 04 14 49 15 85 14 62 13 08 13 15 13 74 12 67 To study the variability of raises for the three different employee statuses calculate the sample standard deviations Round to 4 decimal places
Math
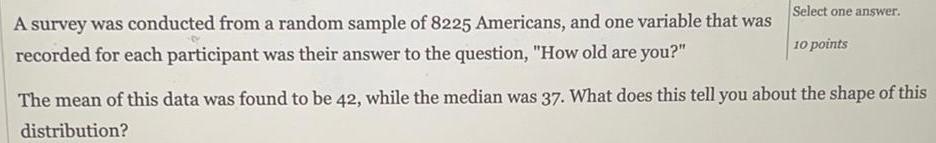
StatisticsA survey was conducted from a random sample of 8225 Americans and one variable that was recorded for each participant was their answer to the question How old are you Select one answer 10 points The mean of this data was found to be 42 while the median was 37 What does this tell you about the shape of this distribution
Math
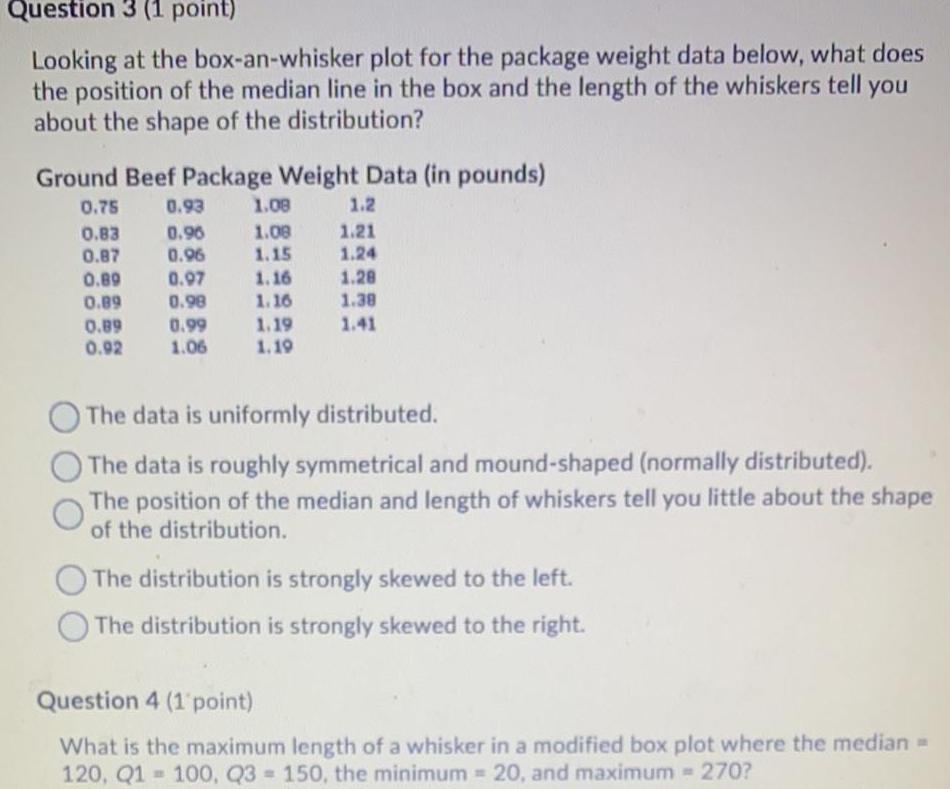
StatisticsQuestion 3 1 point Looking at the box an whisker plot for the package weight data below what does the position of the median line in the box and the length of the whiskers tell you about the shape of the distribution Ground Beef Package Weight Data in pounds 0 75 0 93 0 83 0 96 0 87 0 96 0 89 0 97 0 89 0 98 0 99 1 06 0 89 0 92 1 08 1 08 1 15 1 2 1 21 1 24 1 28 1 38 1 19 1 41 1 19 1 16 1 16 O The data is uniformly distributed The data is roughly symmetrical and mound shaped normally distributed The position of the median and length of whiskers tell you little about the shape of the distribution The distribution is strongly skewed to the left The distribution is strongly skewed to the right Question 4 1 point What is the maximum length of a whisker in a modified box plot where the median 120 Q1 100 Q3 150 the minimum 20 and maximum 270
Math
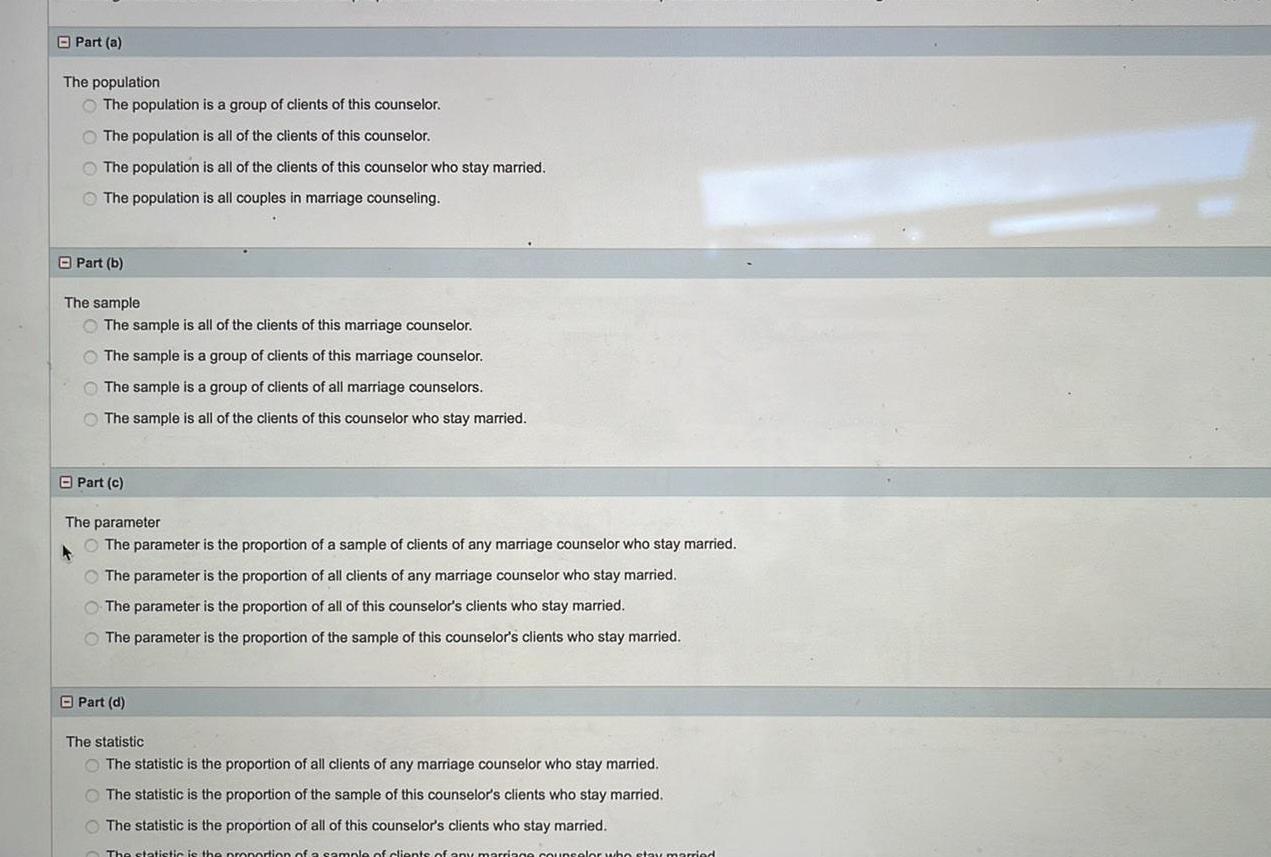
StatisticsPart a The population The population is a group of clients of this counselor The population is all of the clients of this counselor The population is all of the clients of this counselor who stay married The population is all couples in marriage counseling Part b The sample The sample is all of the clients of this marriage counselor The sample is a group of clients of this marriage counselor The sample is a group of clients of all marriage counselors The sample is all of the clients of this counselor who stay married Part c The parameter The parameter is the proportion of a sample of clients of any marriage counselor who stay married A The parameter is the proportion of all clients of any marriage counselor who stay married O The parameter is the proportion of all of this counselor s clients who stay married The parameter is the proportion of the sample of this counselor s clients who stay married Part d The statistic The statistic is the proportion of all clients of any marriage counselor who stay married The statistic is the proportion of the sample of this counselor s clients who stay married The statistic is the proportion of all of this counselor s clients who stay married The statistic is the proportion of a sample of clients of any marriage counselor who stay married
Math
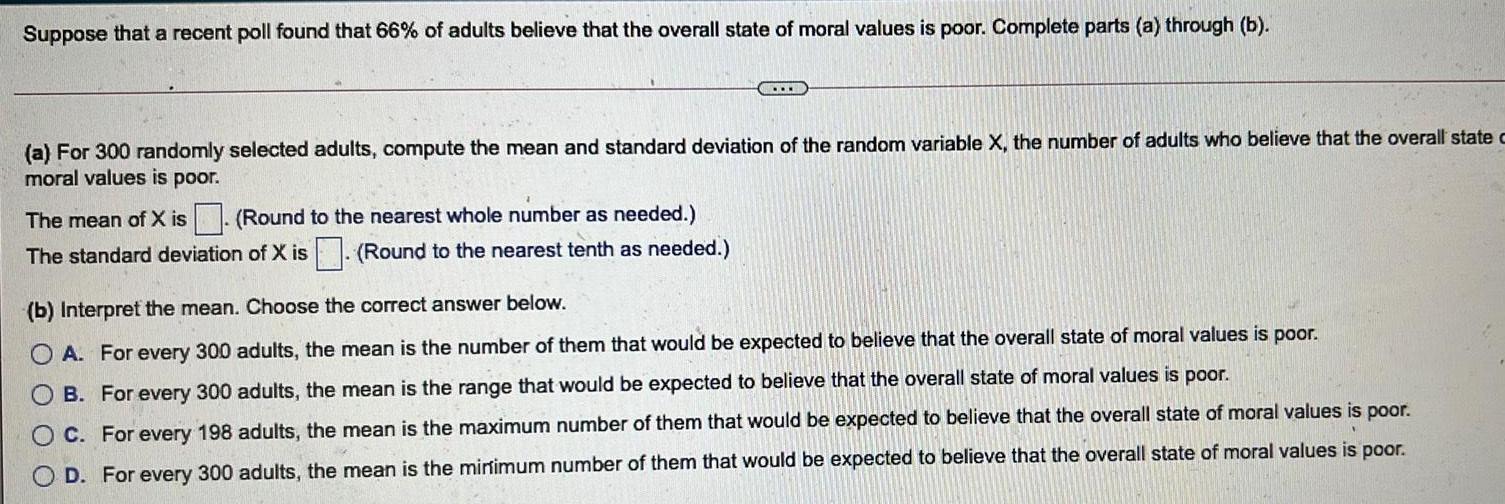
StatisticsSuppose that a recent poll found that 66 of adults believe that the overall state of moral values is poor Complete parts a through b a For 300 randomly selected adults compute the mean and standard deviation of the random variable X the number of adults who believe that the overall state c moral values is poor The mean of X is Round to the nearest whole number as needed The standard deviation of X is Round to the nearest tenth as needed b Interpret the mean Choose the correct answer below A For every 300 adults the mean is the number of them that would be expected to believe that the overall state of moral values is poor OB For every 300 adults the mean is the range that would be expected to believe that the overall state of moral values is poor OC For every 198 adults the mean is the maximum number of them that would be expected to believe that the overall state of moral values is poor OD For every 300 adults the mean is the minimum number of them that would be expected to believe that the overall state of moral values is poor
Math
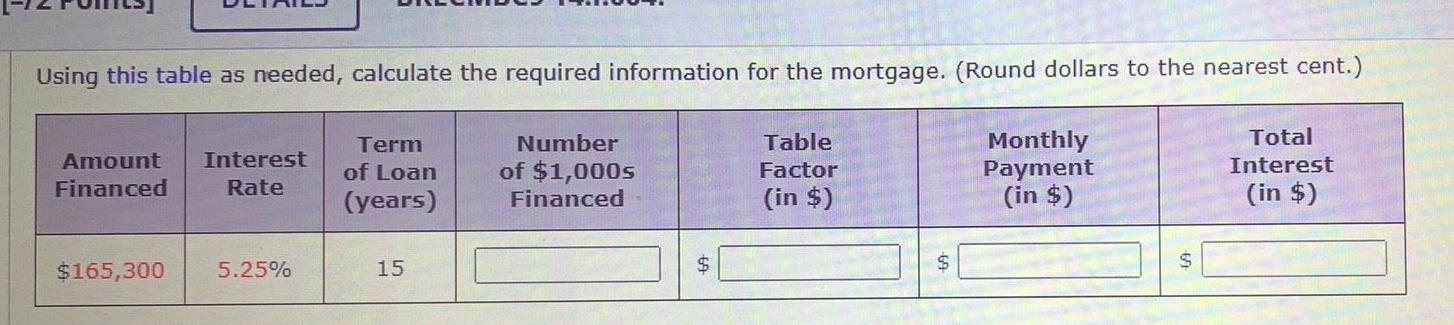
StatisticsUsing this table as needed calculate the required information for the mortgage Round dollars to the nearest cent Number of 1 000s Financed Amount Interest Financed Rate 165 300 5 25 Term of Loan years 15 Table Factor in 69 Monthly Payment in Total Interest in
Math
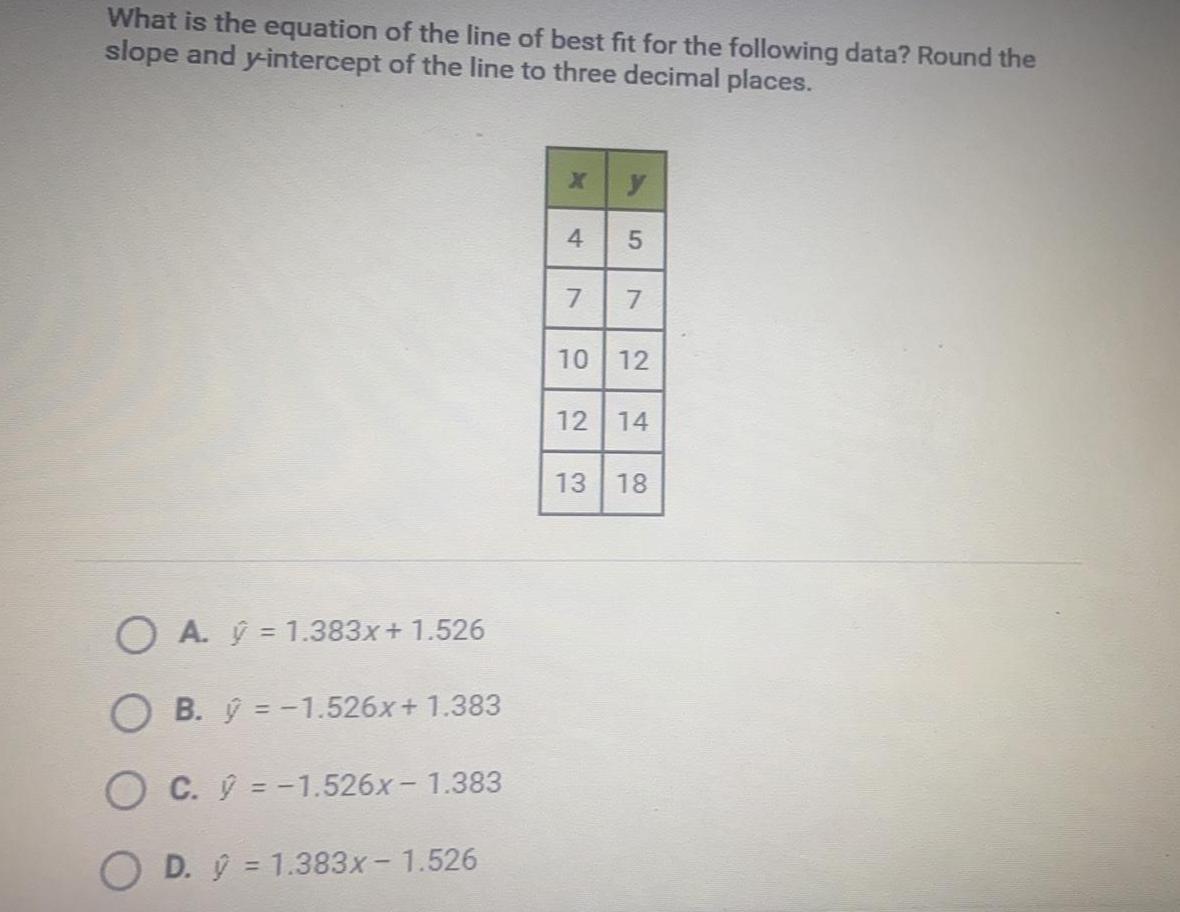
StatisticsWhat is the equation of the line of best fit for the following data Round the slope and y intercept of the line to three decimal places OA 1 383x 1 526 OB y 1 526x 1 383 OC 1 526x 1 383 OD 1 383x 1 526 X 4 7 5 7 10 12 12 14 13 18 CO
Math
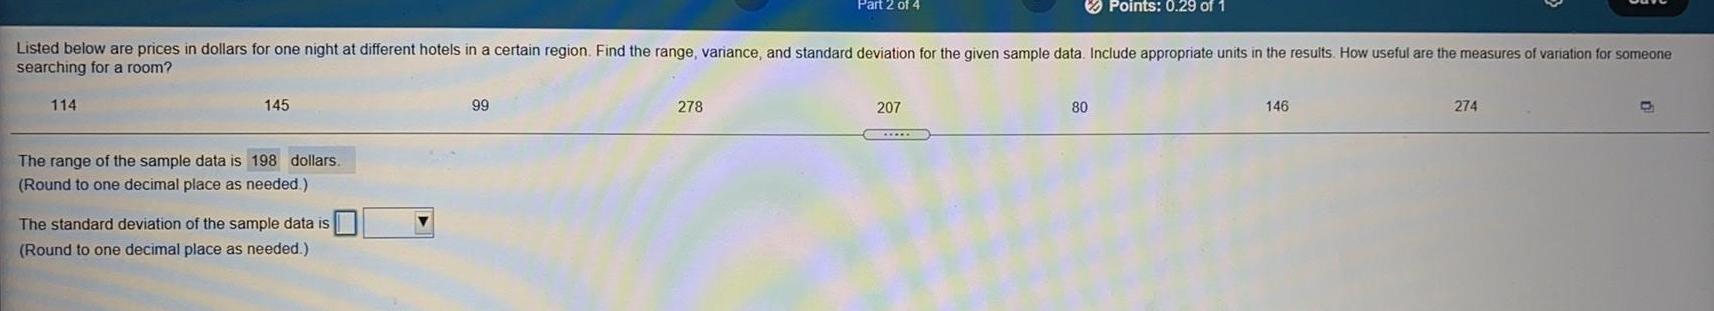
Statistics114 Listed below are prices in dollars for one night at different hotels in a certain region Find the range variance and standard deviation for the given sample data Include appropriate units in the results How useful are the measures of variation for someone searching for a room 145 The range of the sample data is 198 dollars Round to one decimal place as needed The standard deviation of the sample data is Round to one decimal place as needed 99 Part 2 of 4 278 207 Points 0 29 of 1 80 146 274
Math
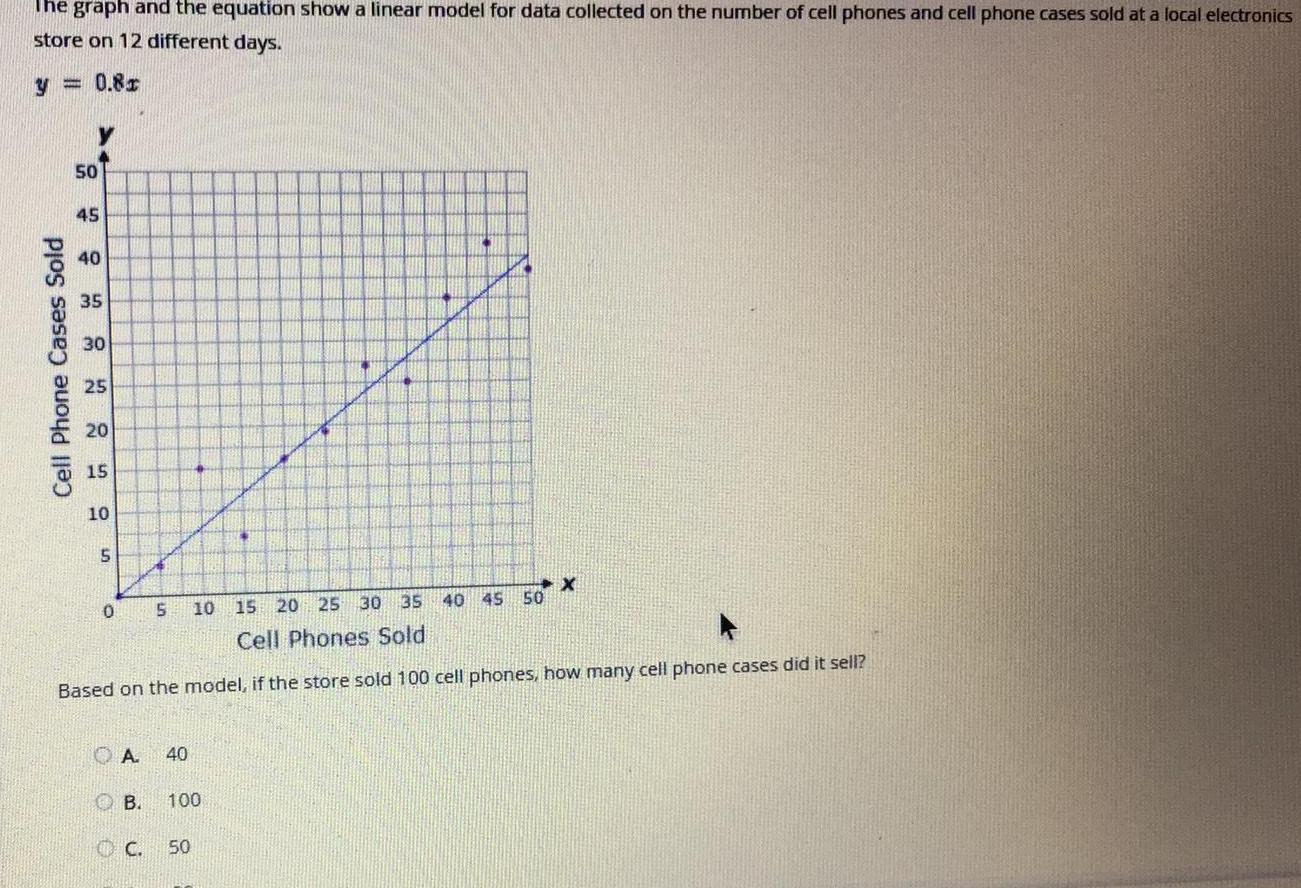
StatisticsThe graph and the equation show a linear model for data collected on the number of cell phones and cell phone cases sold at a local electronics store on 12 different days y 0 81 Cell Phone Cases Sold 50 45 40 35 30 25 20 15 10 5 0 5 OA 40 OB OC 10 15 20 25 30 35 Cell Phones Sold Based on the model if the store sold 100 cell phones how many cell phone cases did it sell 100 4 50 40 45 50 X
Math
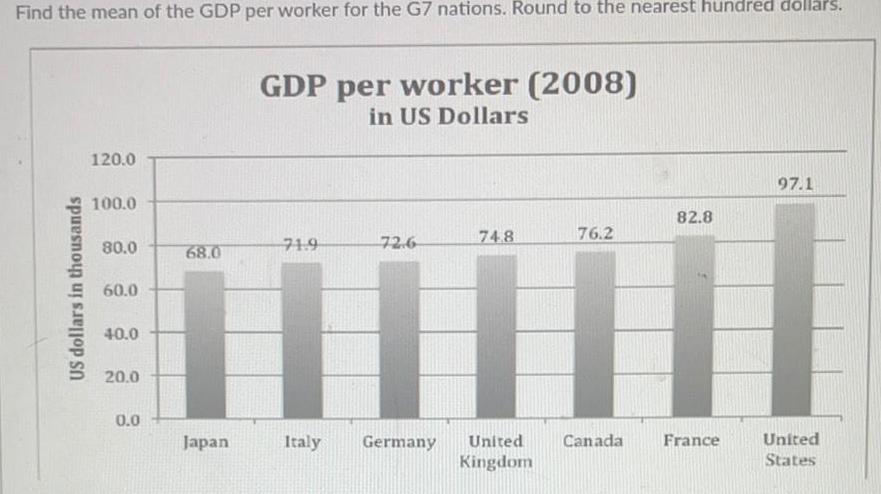
StatisticsFind the mean of the GDP per worker for the G7 nations Round to the nearest hundred dollars US dollars in thousands 120 0 100 0 80 0 60 0 40 0 20 0 0 0 68 0 Japan GDP per worker 2008 in US Dollars 71 9 Italy 72 6 74 8 Germany United Kingdom 76 2 Canada 82 8 France 97 1 United States
Math
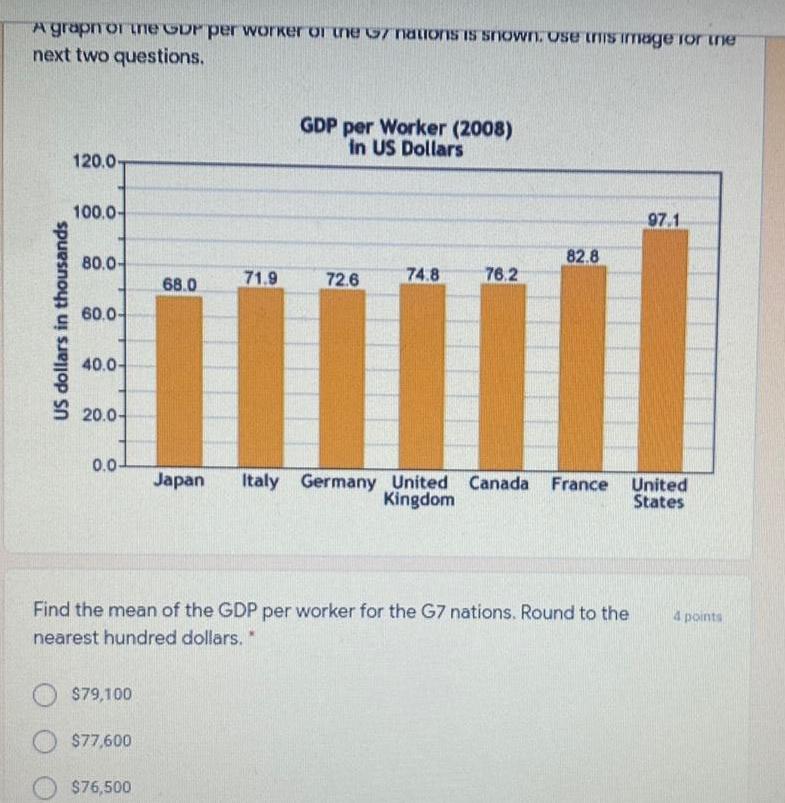
StatisticsA grapn or the GDP per worker or the G7 nations is shown Ose this image for the next two questions US dollars in thousands 120 0 100 0 80 0 60 0 40 0 20 0 79 100 77 600 68 0 76 500 71 9 GDP per Worker 2008 in US Dollars 72 6 74 8 76 2 Find the mean of the GDP per worker for the G7 nations Round to the nearest hundred dollars 82 8 Japan Italy Germany United Canada France Kingdom 97 1 United States points
Math
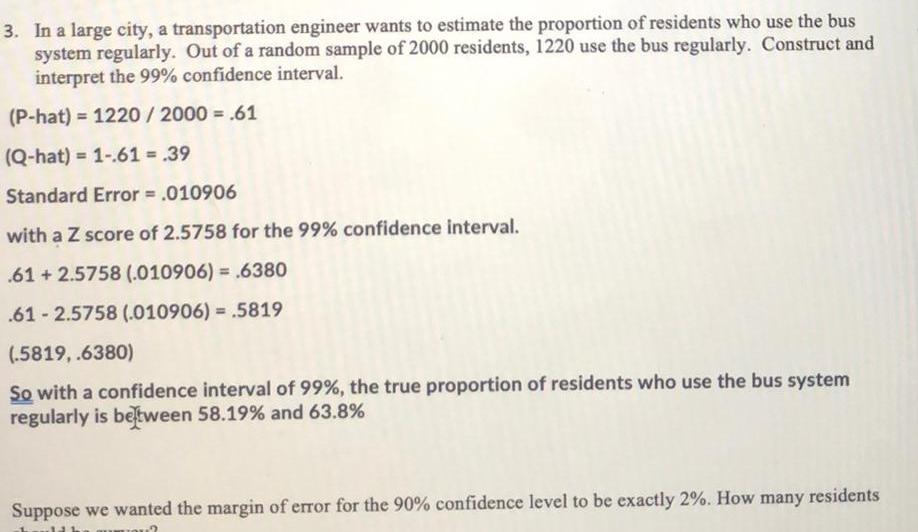
Statistics3 In a large city a transportation engineer wants to estimate the proportion of residents who use the bus system regularly Out of a random sample of 2000 residents 1220 use the bus regularly Construct and interpret the 99 confidence interval P hat 1220 2000 61 Q hat 1 61 39 Standard Error 010906 with a Z score of 2 5758 for the 99 confidence interval 61 2 5758 010906 6380 61 2 5758 010906 5819 5819 6380 So with a confidence interval of 99 the true proportion of residents who use the bus system regularly is between 58 19 and 63 8 Suppose we wanted the margin of error for the 90 confidence level to be exactly 2 How many residents 2
Math
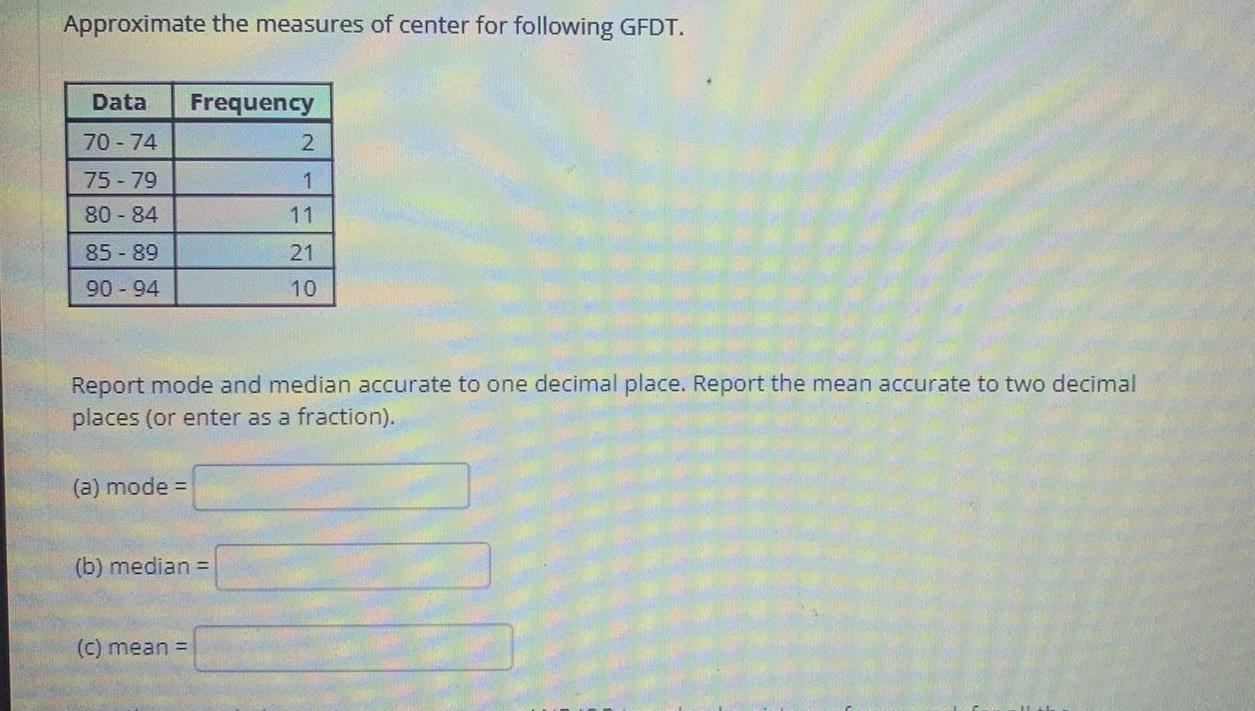
StatisticsApproximate the measures of center for following GFDT Data Frequency 70 74 75 79 80 84 85 89 90 94 a mode Report mode and median accurate to one decimal place Report the mean accurate to two decimal places or enter as a fraction b median 2 1 11 c mean 21 10
Math
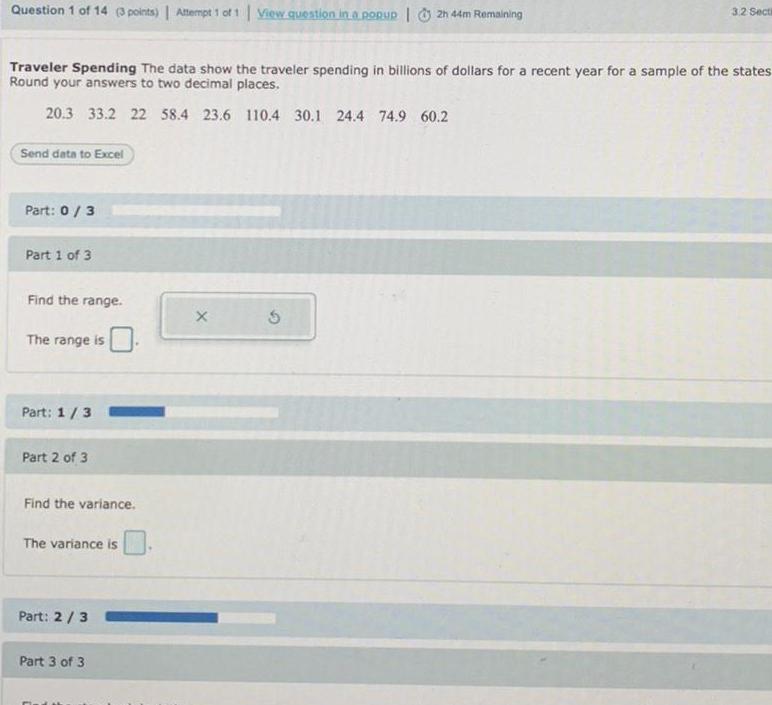
StatisticsQuestion 1 of 14 3 points Attempt 1 of 1 View question in a popup 2h 44m Remaining Traveler Spending The data show the traveler spending in billions of dollars for a recent year for a sample of the states Round your answers to two decimal places 20 3 33 2 22 58 4 23 6 110 4 30 1 24 4 74 9 60 2 Send data to Excel Part 0 3 Part 1 of 3 Find the range The range is Part 1 3 Part 2 of 3 Find the variance The variance is Part 2 3 Part 3 of 3 X 3 2 Secti 5