Math Questions
The best high school and college tutors are just a click away, 24×7! Pick a subject, ask a question, and get a detailed, handwritten solution personalized for you in minutes. We cover Math, Physics, Chemistry & Biology.

Math
Basic MathFind the ratio, reduced to lowest terms, of the volume of a sphere with a radius of 4 inches to the volume of a sphere with a radius of 8 inches.
The ratio is. (Type an integer or a simplified fraction.)

Math
Basic MathAn architect is considering bidding for the design of a new museum. The cost of drawing plans and submitting a model is $13,000. The probability of being awarded
the bid is 0.4. If the architect is awarded the bid, she will make $32,500 minus the $13,000 cost for plans and a model. Complete parts a. through b. below.
a. What is the expected value in this situation?
(Round to the nearest dollar.)
Math
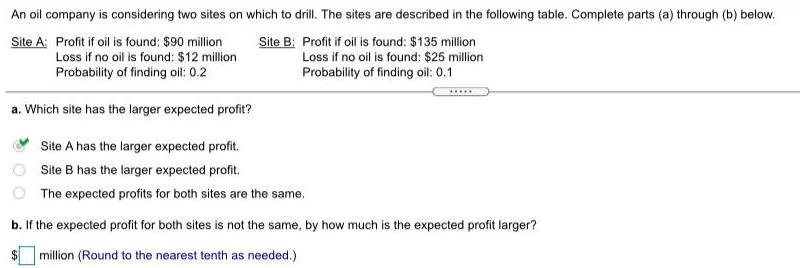
ProbabilityAn oil company is considering two sites on which to drill. The sites are described in the following table. Complete parts (a) through (b) below.
Site A: Profit if oil is found: $90 million
Site B:Loss if no oil is found: $12 million
Probability of finding oil: 0.2
Profit if oil is found: $135 million
Loss if no oil is found: $25 million
Probability of finding oil: 0.1
a. Which site has the larger expected profit?
Site A has the larger expected profit.
Site B has the larger expected profit.
The expected profits for both sites are the same.
b. If the expected profit for both sites is not the same, by how much is the expected profit larger?
million (Round to the nearest tenth as needed.)

Math
Basic MathGive the slope of y+2=3(x-7) and a point on the line.
A. The slope is 7 and (3, 2) is on the line.
B. The slope is 3 and (7, -2) is on the line.
C. The slope is 2 and (7,3) is on the line.
D. The slope is 3 and (-7, 2) is on the line.

Math
Basic MathCustomers can pick their own blueberries at Blueberry Hill. They pay $5 to
enter the patch and $4 per pound for the blueberries they pick. Write an
equation to model the total cost, y, for x pounds of blueberries.
A. y = 5x +4
B. y = 4x + 5
C. y = x(5+4)
D. y = 4(x + 5)

Math
Basic MathA game is played using one die. If the die is rolled and shows 2, the player wins $10. If the die shows any number other than 2, the player wins nothing. Complete
parts (a) through (b) below.
a. If there is a charge of $2 to play the game, what is the game's expected value?
$(Round to the nearest cent.)
b. What does this expected value mean? Choose the correct statement below.
A. This value represents the expected loss over the long run for each game played.
B. The player can expect to break even over the long run.
C. This value represents the expected win over the long run for each game played.

Math
Basic MathConstruct the dotplot for the given data.
A manufacturer records the number of errors each work station makes during the
week. The data are as follows.
6323520254201
5
10
→
10
10
10

Math
ProbabilityAnswer the question, considering an event to be "unlikely" if its probability is less
than or equal to 0.05.
Is it unlikely to get 11 when a pair of dice is rolled?
Yes
No

Math
StatisticsWatching TV: In 2012, the General Social Survey asked a sample of 1314 people how much time they spent watching TV each
day. The mean number of hours was 2.85 with a standard deviation of 2.62. A sociologist claims that people watch a mean of 3
hours of TV per day. Do the data provide sufficient evidence to conclude that the mean hours of TV watched per day is less than
the claim? Use the a= 0.05 level of significance and the P-value method with the TI-84 Plus calculator.
Part 1 of 4
(a) State the appropriate null and alternate hypotheses.
Ho:
This hypothesis test is a (Choose one) test.
O<O
DO
X
O<O
L
0-0
3

Math
Basic MathTV sets: According to the Nielsen Company, the mean number of TV sets in a U.S. household in 2013 was 2.24. Assume the
standard deviation is 1.1. A sample of 90 households is drawn.
Part 1 of 5
(a) What is the probability that the sample mean number of TV sets is greater than 2? Round your answer to at least four
decimal places.
The probability that the sample mean number of TV sets is greater than 2 is 9809
Part: 1/5
Part 2 of 5
(b) What is the probability that the sample mean number of TV sets is between 2.5 and 3? Round your answer to at least
four decimal places.
The probability that the sample mean number of TV sets is between 2.5 and 3 is
Math
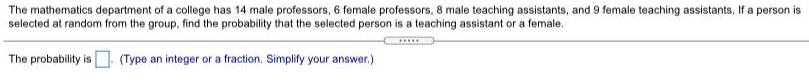
ProbabilityThe mathematics department of a college has 14 male professors, 6 female professors, 8 male teaching assistants, and 9 female teaching assistants. If a person is
selected at random from the group, find the probability that the selected person is a teaching assistant or a female.
(Type an integer or a fraction. Simplify your answer.)
The probability is

Math
ProbabilityThe mathematics department of a college has 9 male professors, 9 female professors, 8 male teaching assistants, and 15 female teaching assistants. If a person is
selected at random from the group, find the probability that the selected person is a professor or a male.
(Type an integer or a fraction. Simplify your answer.)
The probability is

Math
Basic MathThere are 9 performers who will present their comedy acts this weekend at a comedy club. One of the performers insists on being the last stand-up comic of the
evening. If this performer's request is granted, how many different ways are there to schedule the appearances?
ways
(Type a whole number.)

Math
Permutations and CombinationsYou need to arrange seven of your favorite books along a small shelf. How many different ways can you arrange the books, assuming that the order of the books
makes a difference to you?
ways
(Type a whole number.)

Math
StatisticsAssume that you want to test the claim that the paired sample data come from a
population for which the mean difference is ud = 0. Compute the value of the t test
statistic. Round intermediate calculations to four decimal places as needed and final
answers to three decimal places as needed.
29 31 23 27 26 26 34 30
27 27 29 27 27 31 34 29
t = -0.185
t = 0.690
t = -0.523
t = -1.480

Math
Basic MathDetermine whether the quantitative variable is discrete or continuous.
the number of bottles of juice sold in a cafeteria during lunch
continuous
discrete

Math
Basic MathCalibrating a scale: Making sure that the scales used by businesses in the United States are accurate is the responsibility of the
National Institute for Standards and Technology (NIST) in Washington, D.C. Suppose that NIST technicians are testing a scale by
using a weight known to weigh exactly 1000 grams. The standard deviation for scale reading is known to be a=2.0. They weigh
this weight on the scale 55 times and read the result each time. The 55 scale readings have a sample mean of x = 1000.6 grams.
The scale is out of calibration if the mean scale reading differs from 1000 grams. The technicians want to perform a hypothesis
test to determine whether the scale is out of calibration. Use the a=0.10 level of significance and the P-value method with the
TI-84 calculator.
Part: 0/4
Part 1 of 4
State the appropriate null and alternate hypotheses.
Ho
H₁
This hypothesis test is a (Choose one) test.

Math
StatisticsDetermine the mean, median, mode and midrange of the set of data.
59, 52, 39, 50, 60, 47, 63
The mean is
(Round to the nearest tenth as needed.)
The median is
Select the correct choice below and fill in any answer boxes within your choice.
OA. The mode is
OB. There is no mode.
The midrange is
(Use a comma to separate answers as needed.)

Math
StatisticsHeavy children: Are children heavier now than they were in the past? The National Health and Nutrition Examination Survey
(NHANES) taken between 1999 and 2002 reported that the mean weight of six-year-old girls in the United States was 49.3
pounds. Another NHANES survey, published in 2008, reported that a sample of 205 six-year-old girls weighed between 2003 and
2006 had an average weight of 50.2 pounds. Assume the population standard deviation is a = 15.3 pounds. Can you conclude
that the mean weight of six-year-old girls in 2006 is different from what it was in 2002? Use the a = 0.05 level of significance and
the P-value method with the TI-84 calculator.
Part 1 of 4
State the appropriate null and alternate hypotheses.
Ho:u= 49.3
H₁: = 49.3
The hypothesis test is a two-tailed ▼test.
Part: 1/4 -
Part 2 of 4
Compute the P-value. Round your answer to at least four decimal places.
P-value=

Math
Basic MathUse the given data to construct a frequency distribution.
Lori asked 24 students how many hours they had spent doing homework during the
previous week. The results are shown below.
10 10 10 8 10 10 14 13 10 8 12 10
10 12 10 10 12 10 10 13 10 12 13 8
Construct a frequency distribution. Use 4 classes, a class width of 2 hours, and a
lower limit of 8 for
Math
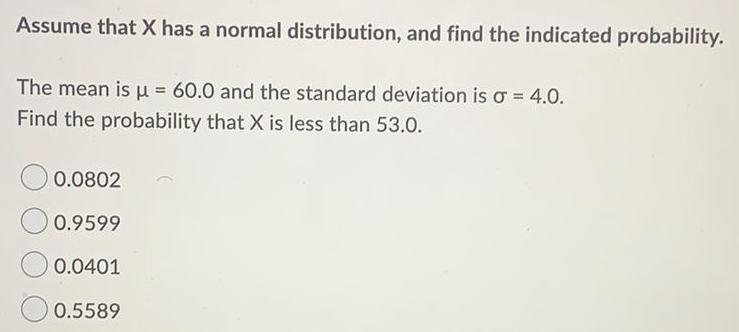
StatisticsAssume that X has a normal distribution, and find the indicated probability.
The mean is μ = 60.0 and the standard deviation is o = 4.0.
Find the probability that X is less than 53.0.
0.0802
0.9599
0.0401
0.5589

Math
Basic MathDetermine whether the given procedure results in a binomial distribution. If not,
state the reason why.
Choosing 8 marbles from a box of 40 marbles (20 purple, 12 red, and 8 green) one at
a time with replacement, keeping track of the number of red marbles chosen.
Not binomial: there are too many trials.
Procedure results in a binomial distribution.
Not binomial: there are more than two outcomes for each trial.
Not binomial: the trials are not independent.

Math
Basic MathThe given tessellation formed by two or more regular polygons is shown.
a. Name the type of regular polygons that surround each vertex.
b. Determine the number of angles that come together at each vertex, as well as
the measures of these angles.
c. Use the angle measures from part (b) to explain why the tessellation is
possible.
88
a. Choose the correct answer below.
OA. triangle, pentagons
B. triangles, octagons
OC. triangle, dodecagons

Math
Basic MathFind the standard deviation, o, for the binomial distribution which has the stated
values of n and p. Round your answer to the nearest hundredth.
n = 38; p = 0.4
o = 7.14
σ =
6.29
σ =
3.02
σ = 0.61

Math
Basic MathA circular backyard pool has a diameter of 24 feet and is 3 feet deep. One cubic foot of water has a capacity of approximately 7.48 gallons. If water costs $4 per
thousand gallons, how much, to the nearest dollar, will it cost to fill the pool?
It will cost approximately $ to fill the pool.
(Round to the nearest dollar as needed.)

Math
Basic MathAssume that a sample of bivariate data yields the correlation coefficient, r, indicated. Use
the table on the right for the specified sample size and level of significance to determine
whether a linear correlation exists.
r=0.81 when n=10 at a = 0.01
Does a linear correlation exist?
A linear correlation does not exist.
OA linear correlation exists.
C4567668
n
9
10
Correlation Coefficient, r
α=0.05
0.950
0.878
0.811
0.754
0.707
0.666
0.632
α = 0.01
0.990
0.959
0.917
0.875
0.834
0.798
0.765

Math
Basic MathA man earned wages of $33,600, received $1700 in interest from a savings account, and
contributed $2700 to a tax-deferred retirement plan. He was entitled to a personal exemption
of $3000 and had deductions totaling $5480. Find his gross income, adjusted gross income,
and taxable income.
His gross income was $
(Simplify your answer.)

Math
Basic MathA certain pyramid has a square base measuring 819 feet on a side and a height of 486 feet.
a. What is the volume of the pyramid, in cubic yards?
b. The stones used to build the pyramid were blocks with an average volume of 1.5 cubic yards. How many of these blocks were needed to construct the great
pyramid?

Math
Basic MathSolve the problem. Round the point estimate to the nearest thousandth.
Find the point estimate of the proportion of people who wear hearing aids if, in a
random sample of 898 people, 46 people had hearing aids.
0.050
0.949
0.049
0.051

Math
Basic MathA woman is in the 15% tax bracket and itemizes her deductions. How much will her tax bill be reduced if she qualifies for a
$300 tax credit?
Her tax bill will be reduced by $
(Simplify your answer.)
Math
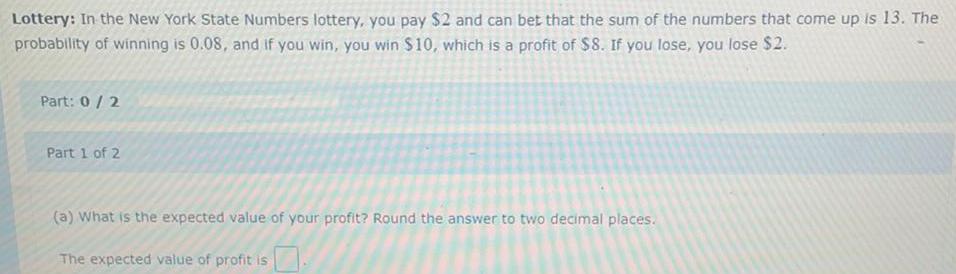
ProbabilityLottery: In the New York State Numbers lottery, you pay $2 and can bet that the sum of the numbers that come up is 13. The
probability of winning is 0.08, and if you win, you win $10, which is a profit of $8. If you lose, you lose $2.
Part: 0/2
Part 1 of 2
(a) What is the expected value of your profit? Round the answer to two decimal places.
The expected value of profit is

Math
AreaThe four sequential sides of a quadrilateral have lengths a = 5.3, b = 7.2, c = 9.7, and d = 10.9 (all measured in yards). The angle between the two smallest sides is a = 116°.
What is the area of this figure?
area =
yd²

Math
Basic MathWhen a national sample of heights of kindergarten children was taken, a student was told that she was in the 25th percentile. Explain what that means.
Choose the correct interpretation below.
A. She is shorter than 25 percent of all kindergarten children.
B. She is taller than 75 percent of all kindergarten children.
C. She is taller than 25 percent of all kindergarten children.
D. She is taller than 25 kindergarten children.

Math
Basic MathOne circular table has a diameter of 8 ft, and another circular table has a diameter of 12 ft. How much greater is the area of the larger table? Round to the nearest whole number.
about 31 ft2
about 6 ft2
about 63 ft2
about 13 ft2

Math
StatisticsIs there a doctor in the house? A market research firm reported the mean annual earnings of all family practitioners in the
United States was $178,258. A random sample of 43 family practitioners in Los Angeles had mean earnings of x = $193,010 with
a standard deviation of $42,777. Do the data provide sufficient evidence to conclude that the mean salary for family practitioners
in Los Angeles is greater than the national average? Use the a= 0.05 level of significance and the P-value method with the TI-84
Plus calculator.
Part 1 of 4
State the appropriate null and alternate hypotheses.
Ho
H₁ :
This hypothesis test is a (Choose one)
test.

Math
Basic MathA bin contains 64 light bulbs of which 10 are defective. If 5 light bulbs are randomly
selected from the bin with replacement, find the probability that all the bulbs
selected are good ones. Round to the nearest thousandth if necessary.
0.428
0.844
0.484
0


Math
Basic MathDetermine how much the following individual will save in taxes with the specified tax credits or
deductions.
Rosa is in the 15% tax bracket and claims the standard deduction. How much will her tax bill
be reduced if she makes a $500 contribution to charity?
www.
Her tax bill will be reduced by $. (Simplify your answer.)

Math
Basic MathFind the mean for the given sample data. Unless indicated otherwise, round your
answer to one more decimal place than is present in the original data values.
The amount of time (in hours) that Sam studied for an exam on each of the last five
days is given below. Find the mean study time.
1.5 8.3 6.9 1.8 5.3
4.76 hr
23.80 hr
4.96 hr
5.45 hr

Math
StatisticsEfficient manufacturing: Efficiency experts study the processes used to manufacture items in order to make them as efficient as
possible. One of the steps used to manufacture a metal clamp involves the drilling of three holes. In a sample of 95 clamps, the
mean time to complete this step was 55.3 seconds. Assume that the population standard deviation is = 12 seconds. Round the
critical value to no less than three decimal places.
Part 1 of 2
(a) Construct an 80% confidence interval for the mean time needed to complete this step. Round the answer to at least one
decimal place.
An 80% confidence interval for the mean is < <

Math
Basic MathIn a survey of 2752 adults, 1429 say they have started paying bills online in the last year.
Construct a 99% confidence interval for the population proportion. Interpret the results.
A 99% confidence interval for the population proportion is 0.
(Round to three decimal places as needed.)
Interpret your results. Choose the correct answer below.
A. With 99% confidence, it can be said that the population proportion of adults who say they have started paying bills online in the last year is between the endpoints of the given confidence interval.
B. With 99% confidence, it can be said that the sample proportion of adults who say they have started paying bills online in the last year is between the endpoints of the given confidence interval.
C. The endpoints of the given confidence interval show that adults pay bills online 99% of the time.

Math
Basic MathA student earned grades of B, B, A, C, and D. Those courses had these corresponding
numbers of credit hours: 4, 5, 1, 5, 4. The grading system assigns quality points to
letter grades as follows: A-B-3 C-2 D-1 and F-a Compute the grade point
average (GPA) and round the result to two decimal places.
1.37
2.37
9.00
3.46


Math
StatisticsFind the P-value for the indicated hypothesis test.
A random sample of 139 forty-year-old men contains 26% smokers. Find the P-value
for a test to reject the claim that the percentage of forty-year-old men that smoke is
22%.
0.2542
0.2802
0.1271
0.1401

Math
StatisticsFind the P-value for the indicated hypothesis test. Round all proportions and
standard scores to two decimal places.
In a sample of 47 adults selected randomly from one town, it is found that 9 of them
have been exposed to a particular strain of the flu. Find the P-value for a test of the
claim that the proportion of all adults in the town that have been exposed to this
strain of the flu is 8%.
0.9946
0.0045
0.0054
0.0027

Math
Basic MathA woman eamed wages of $31,200, received $2800 in interest from a savings account, and contributed $3200 to a
tax-deferred retirement plan. She was entitled to a personal exemption of $2600 and had deductions totaling $5220. Find
her gross income, adjusted gross income, and taxable income.

Math
Basic MathWrite the indicated product in decimal form and round your answer to the nearest thousandth, if necessary.
Math
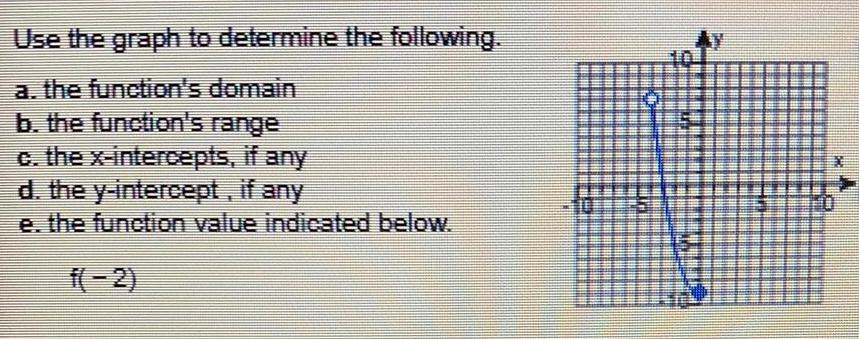
FunctionsUse the graph to determine the following.
a. the function's domain
b. the function's range
c. the x-intercepts, if any
d. the y-intercept, if any
e. the function value indicated below.

Math
Basic MathEach dimension of a rectangular family room is 3.5 times larger than a rectangular bedroom. If it costs $312 to carpet the bedroom, how much would it cost to carpet the family room with same carpet?
$3,822
$1,092
$4,914
$2,184

Math
Basic MathUse synthetic division to divide f(x) = x² +8x²-3x-90 by x + 5. Use the result to find all zeros of f.
(x² +8x²-3x-90) + (x+5)= x² + 3x - 18
(Do not factor. If there is a remainder, type your answer in the form quotient +
The zeros off are (Use a comma to separate answers as needed.)