Statistics Questions and Answers
Math
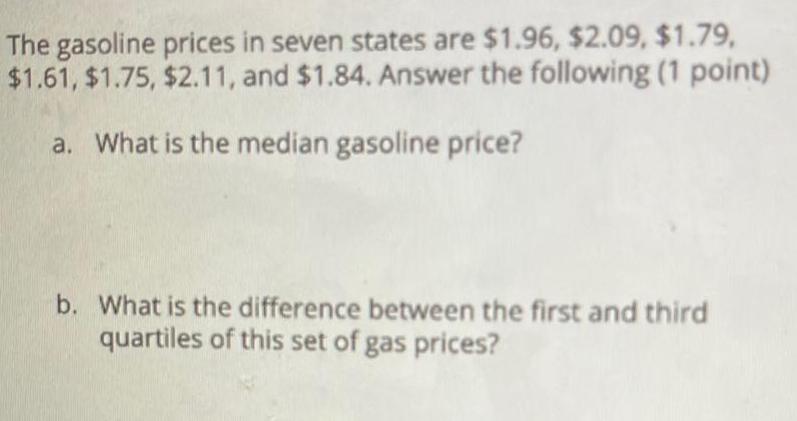
StatisticsThe gasoline prices in seven states are $1.96, $2.09, $1.79, $1.61, $1.75, $2.11, and $1.84. Answer the following (1 point)
a. What is the median gasoline price?
b. What is the difference between the first and third quartiles of this set of gas prices?
Math
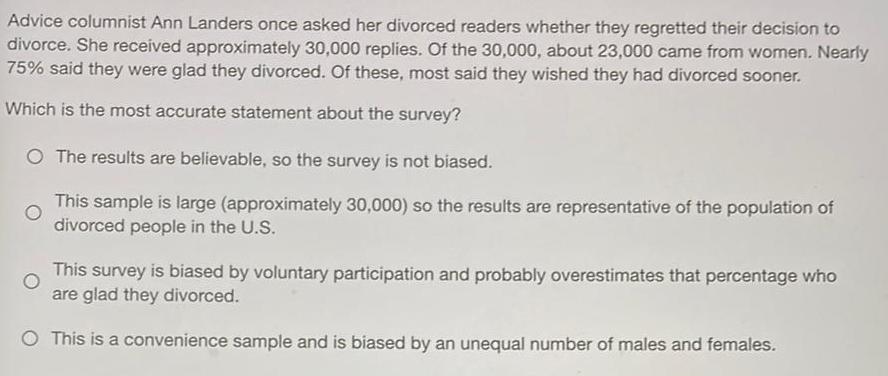
StatisticsAdvice columnist Ann Landers once asked her divorced readers whether they regretted their decision to
divorce. She received approximately 30,000 replies. Of the 30,000, about 23,000 came from women. Nearly
75% said they were glad they divorced. Of these, most said they wished they had divorced sooner.
Which is the most accurate statement about the survey?
The results are believable, so the survey is not biased.
This sample is large (approximately 30,000) so the results are representative of the population of
divorced people in the U.S.
This survey is biased by voluntary participation and probably overestimates that percentage who
are glad they divorced.
This is a convenience sample and is biased by an unequal number of males and females.
Math
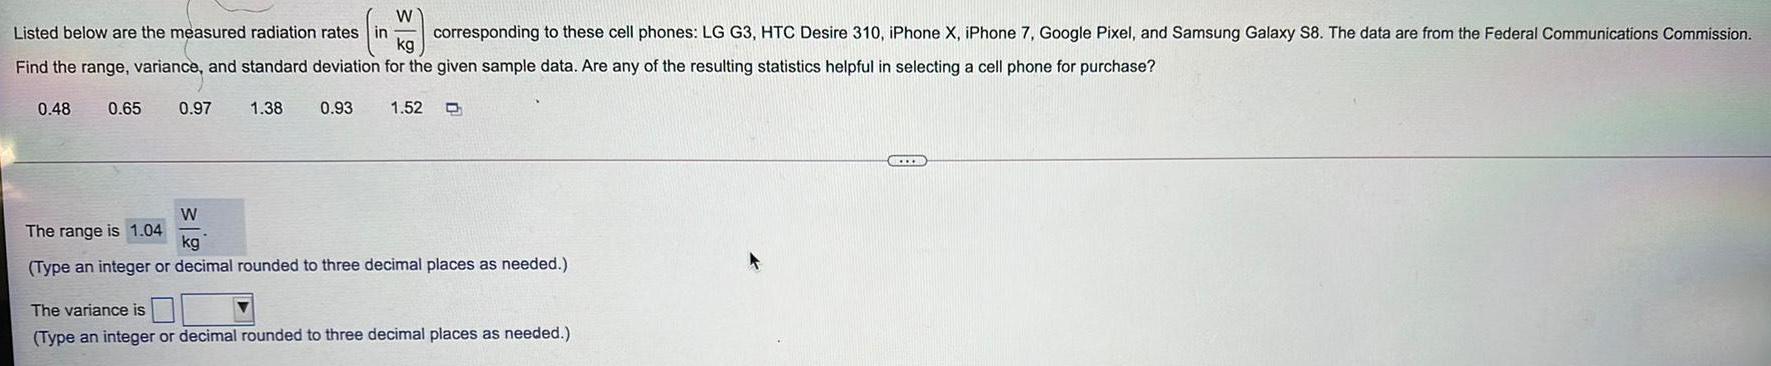
StatisticsListed below are the measured radiation rates (in W/kg) corresponding to these cell phones: LG G3, HTC Desire 310, iPhone X, iPhone 7, Google Pixel, and Samsung Galaxy S8. The data are from the Federal Communications Commission.
Find the range, variance, and standard deviation for the given sample data. Are any of the resulting statistics helpful in selecting a cell phone for purchase?
0.48 0.65 0.97 1.38 0.93 1.52
The range is W/kg
(Type an integer or decimal rounded to three decimal places as needed.)
The variance is
(Type an integer or decimal rounded to three decimal places as needed.)
B
Math
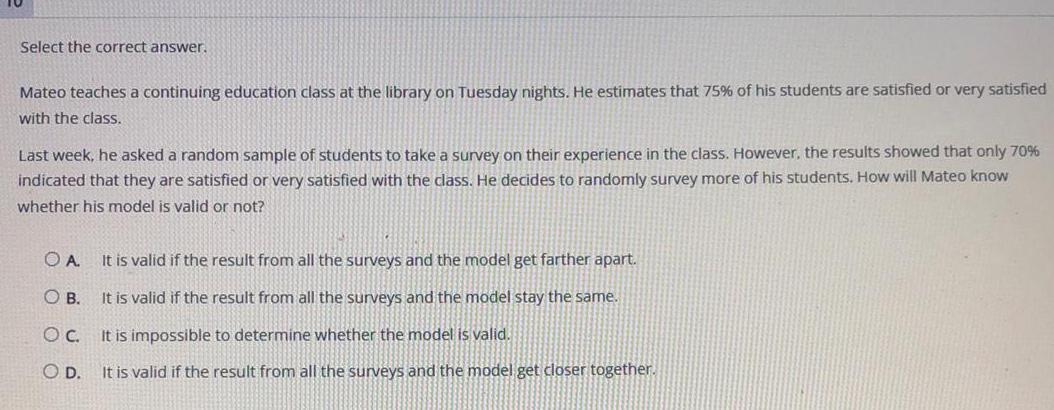
StatisticsSelect the correct answer.
Mateo teaches a continuing education class at the library on Tuesday nights. He estimates that 75% of his students are satisfied or very satisfied
with the class.
Last week, he asked a random sample of students to take a survey on their experience in the class. However, the results showed that only 70%
indicated that they are satisfied or very satisfied with the class. He decides to randomly survey more of his students. How will Mateo know
whether his model is valid or not?
A. It is valid if the result from all the surveys and the model get farther apart.
B. It is valid if the result from all the surveys and the model stay the same.
C. It is impossible to determine whether the model is valid.
D. It is valid if the result from all the surveys and the model get closer together.
Math
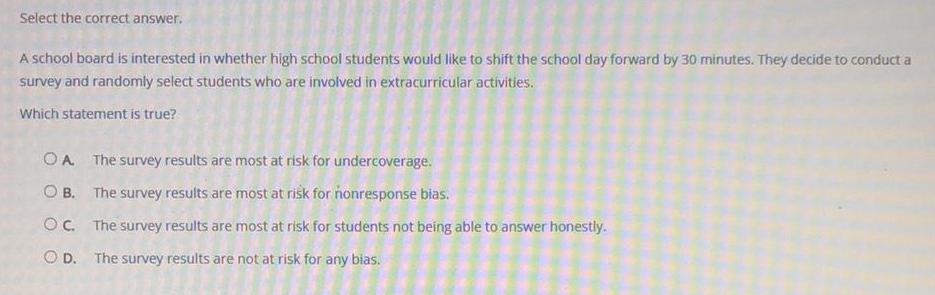
StatisticsSelect the correct answer.
A school board is interested in whether high school students would like to shift the school day forward by 30 minutes. They decide to conduct a
survey and randomly select students who are involved in extracurricular activities.
Which statement is true?
A The survey results are most at risk for undercoverage.
B. The survey results are most at risk for nonresponse bias.
C. The survey results are most at risk for students not being able to answer honestly.
D. The survey results are not at risk for any bias.
Math
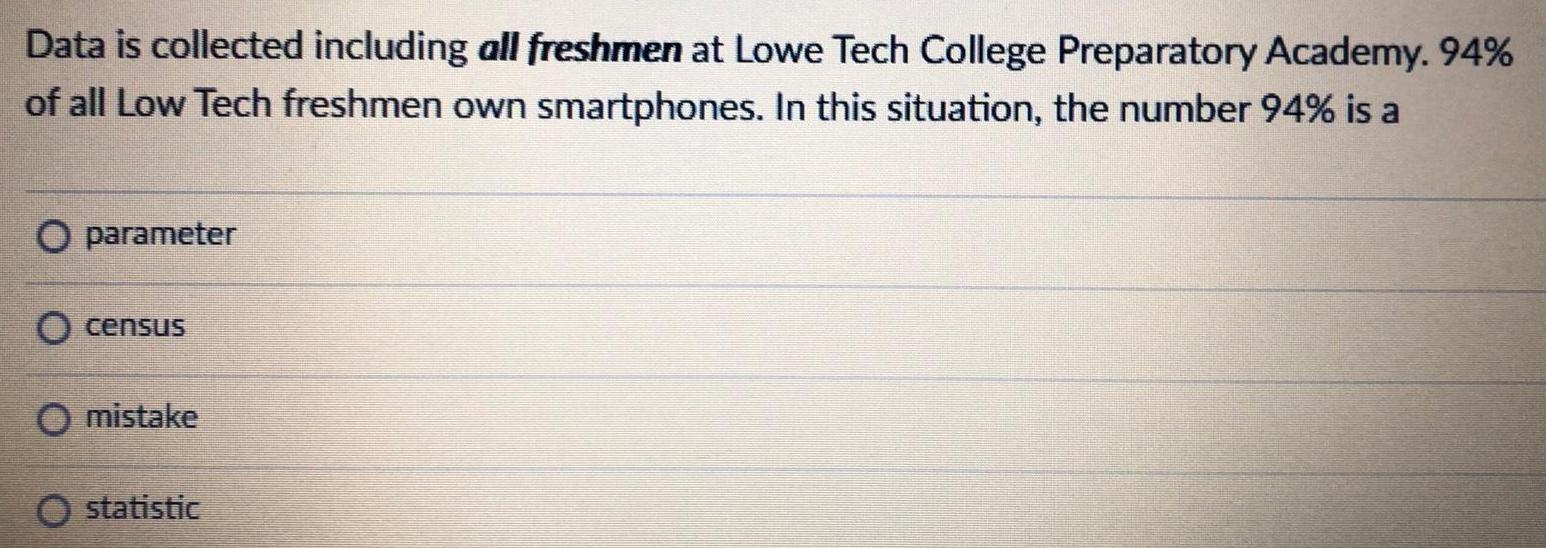
StatisticsData is collected including all freshmen at Lowe Tech College Preparatory Academy. 94%
of all Low Tech freshmen own smartphones. In this situation, the number 94% is a
parameter
census
mistake
statistic
Math
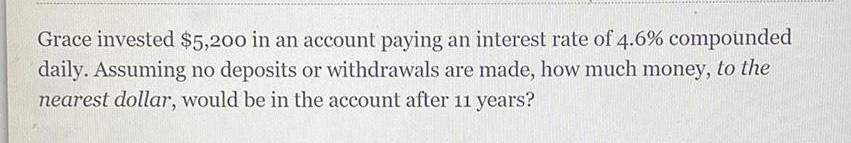
StatisticsGrace invested $5,200 in an account paying an interest rate of 4.6% compounded daily. Assuming no deposits or withdrawals are made, how much money, to the nearest dollar, would be in the account after 11 years?
Math
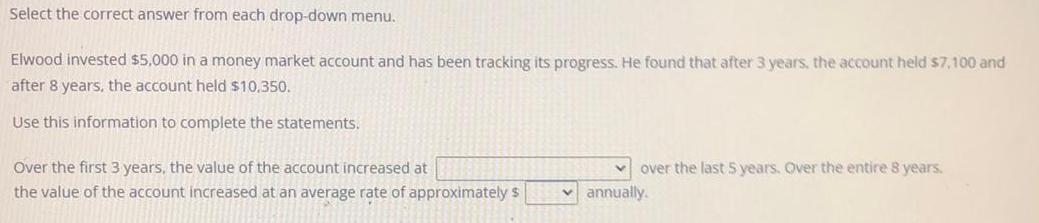
StatisticsSelect the correct answer from each drop-down menu.
Elwood invested $5,000 in a money market account and has been tracking its progress. He found that after 3 years, the account held $7,100 and
after 8 years, the account held $10.350.
Use this information to complete the statements.
Over the first 3 years, the value of the account increased at
the value of the account increased at an average rate of approximately $
over the last 5 years. Over the entire 8 years.
✓ annually.
Math
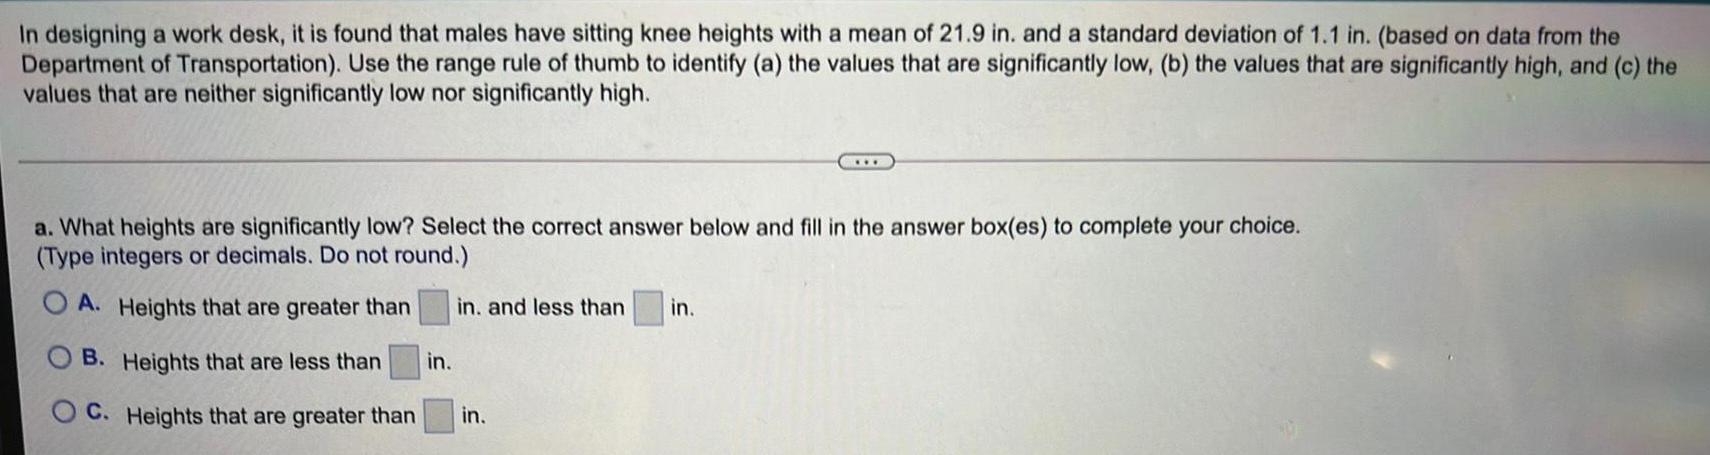
StatisticsIn designing a work desk, it is found that males have sitting knee heights with a mean of 21.9 in. and a standard deviation of 1.1 in. (based on data from the
Department of Transportation). Use the range rule of thumb to identify (a) the values that are significantly low, (b) the values that are significantly high, and (c) the
values that are neither significantly low nor significantly high.
a. What heights are significantly low? Select the correct answer below and fill in the answer box(es) to complete your choice.
(Type integers or decimals. Do not round.)
OA. Heights that are greater than
B. Heights that are less than in.
C. Heights that are greater than
in. and less than
in.
***
in.
Math
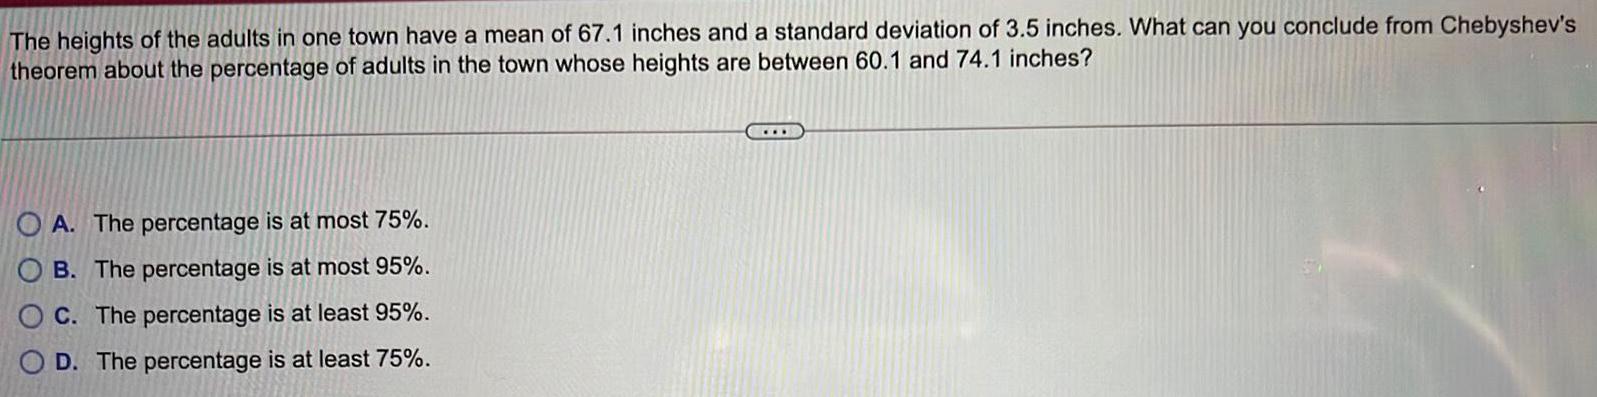
StatisticsThe heights of the adults in one town have a mean of 67.1 inches and a standard deviation of 3.5 inches. What can you conclude from Chebyshev's theorem about the percentage of adults in the town whose heights are between 60.1 and 74.1 inches?
A. The percentage is at most 75%.
B. The percentage is at most 95%.
C. The percentage is at least 95%.
D. The percentage is at least 75%.
Math
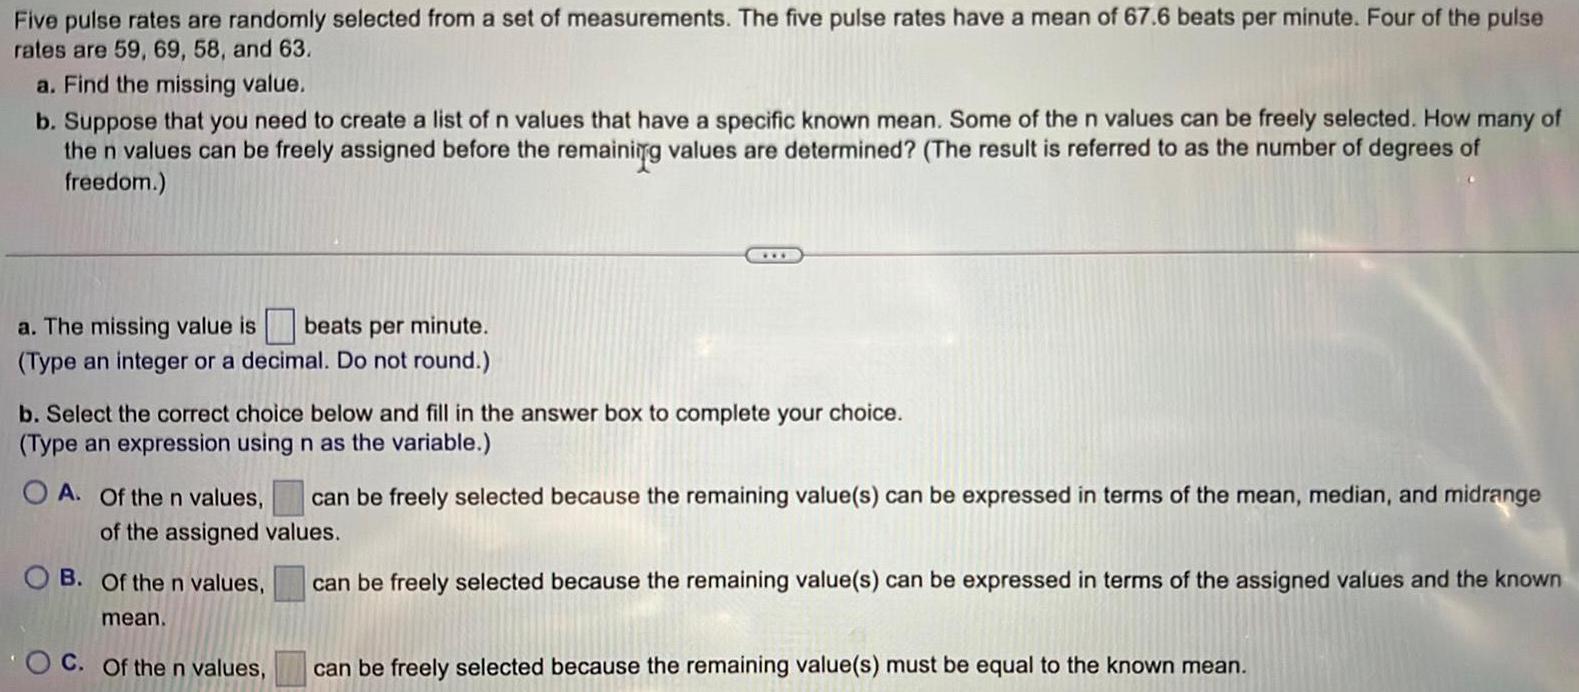
StatisticsFive pulse rates are randomly selected from a set of measurements. The five pulse rates have a mean of 67.6 beats per minute. Four of the pulse rates are 59, 69, 58, and 63.
a. Find the missing value.
b. Suppose that you need to create a list of n values that have a specific known mean. Some of the n values can be freely selected. How many of the n values can be freely assigned before the remaining values are determined? (The result is referred to as the number of degrees of freedom.)
a. The missing value is beats per minute.
(Type an integer or a decimal. Do not round.)
b. Select the correct choice below and fill in the answer box to complete your choice.
(Type an expression using n as the variable.)
A. Of the n values, can be freely selected because the remaining value(s) can be expressed in terms of the mean, median, and midrange of the assigned values.
B. Of the n values, can be freely selected because the remaining value(s) can be expressed in terms of the assigned values and the known mean.
C. Of the n values, can be freely selected because the remaining value(s) must be equal to the known mean.
Math
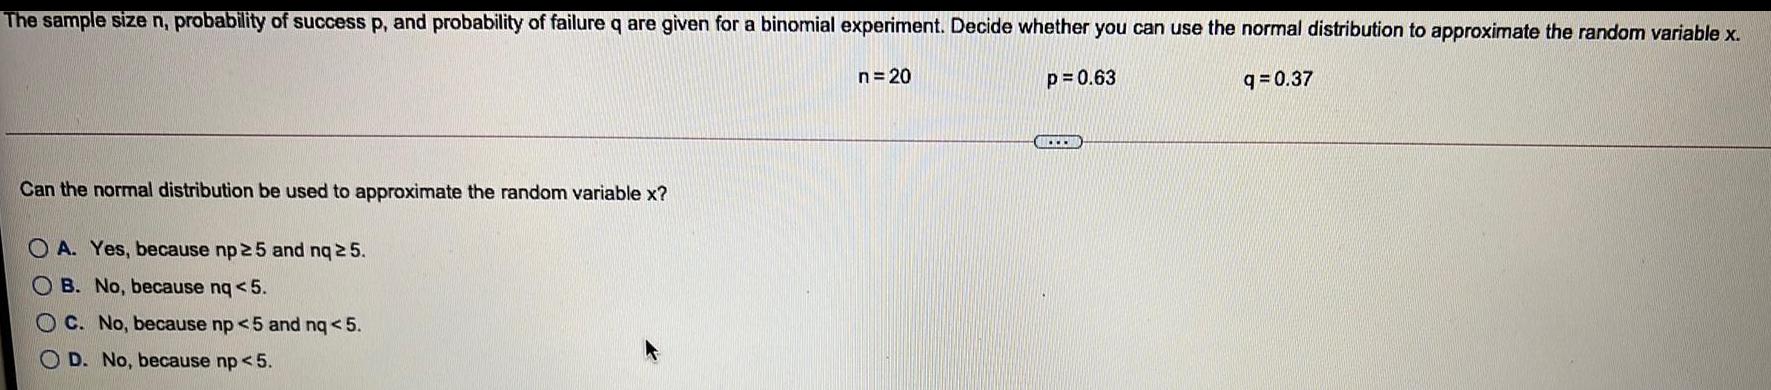
StatisticsThe sample size n, probability of success p, and probability of failure q are given for a binomial experiment. Decide whether you can use the normal distribution to approximate the random variable x.
n = 20 p=0.63 q=0.37
Can the normal distribution be used to approximate the random variable x?
A. Yes, because np 25 and nq 25.
B. No, because nq <5.
C. No, because np <5 and nq < 5.
D. No, because np < 5.
Math
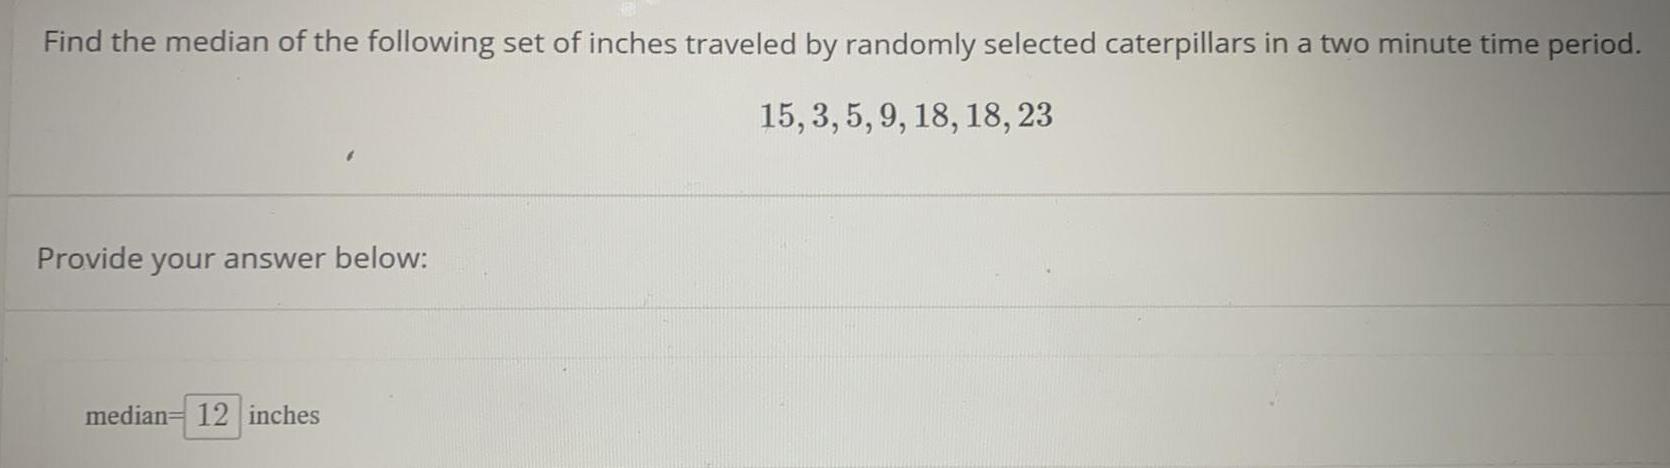
StatisticsFind the median of the following set of inches traveled by randomly selected caterpillars in a two minute time period.
15, 3, 5, 9, 18, 18, 23
Provide your answer below:
Math
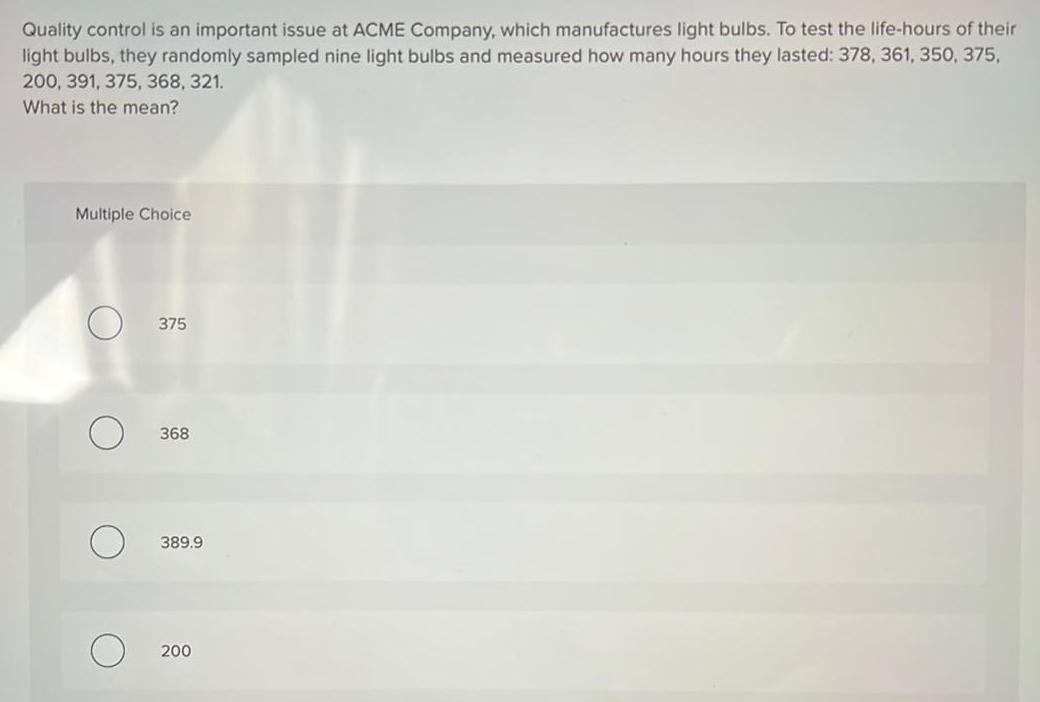
StatisticsQuality control is an important issue at ACME Company, which manufactures light bulbs. To test the life-hours of their light bulbs, they randomly sampled nine light bulbs and measured how many hours they lasted: 378, 361, 350, 375, 200, 391, 375, 368, 321.
What is the mean?
Multiple Choice
375
368
389.9
200
Math
StatisticsIn your sock drawer, you have 9 pairs of black socks, 4 brown, 2 red, 1 white, and 2 blue. Answer the following questions with a complete sentence.
a. If you draw at random, what is the probability of drawing a blue pair of socks?
Math
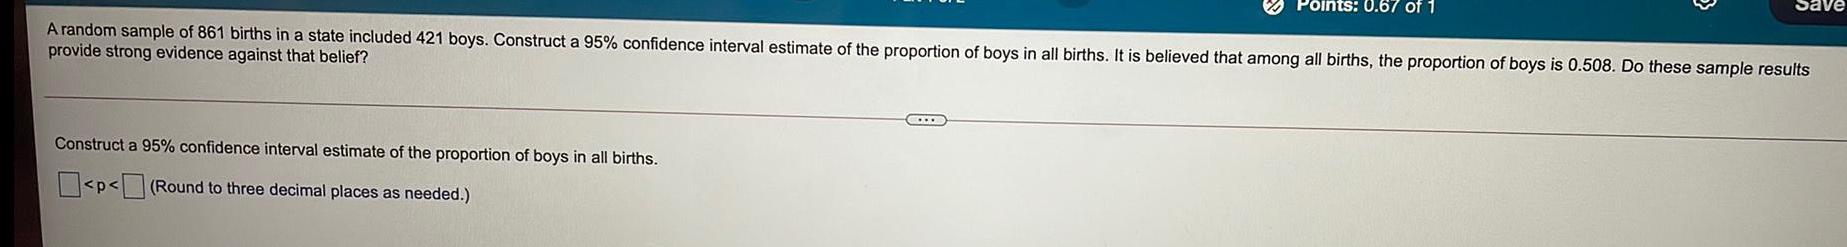
StatisticsA random sample of 861 births in a state included 421 boys. Construct a 95% confidence interval estimate of the proportion of boys in all births. It is believed that among all births, the proportion of boys is 0.508. Do these sample results provide strong evidence against that belief?
Construct a 95% confidence interval estimate of the proportion of boys in all births.
Math
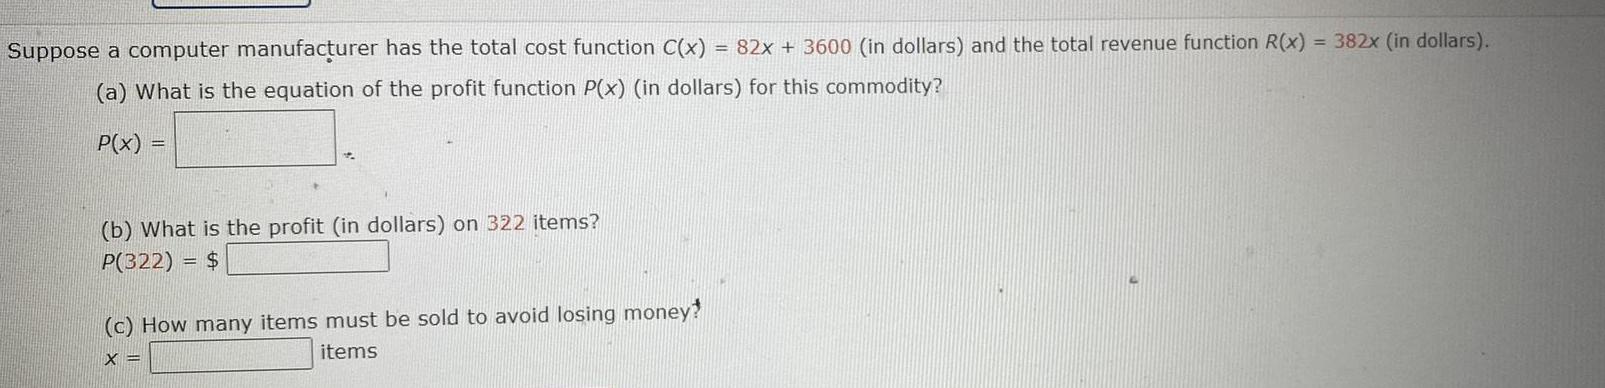
StatisticsSuppose a computer manufacturer has the total cost function C(x) = 82x + 3600 (in dollars) and the total revenue function R(x) = 382x (in dollars).
(a) What is the equation of the profit function P(x) (in dollars) for this commodity?
P(x)
=
(b) What is the profit (in dollars) on 322 items?
P(322) = $
(c) How many items must be sold to avoid losing money?
X =
items
Math
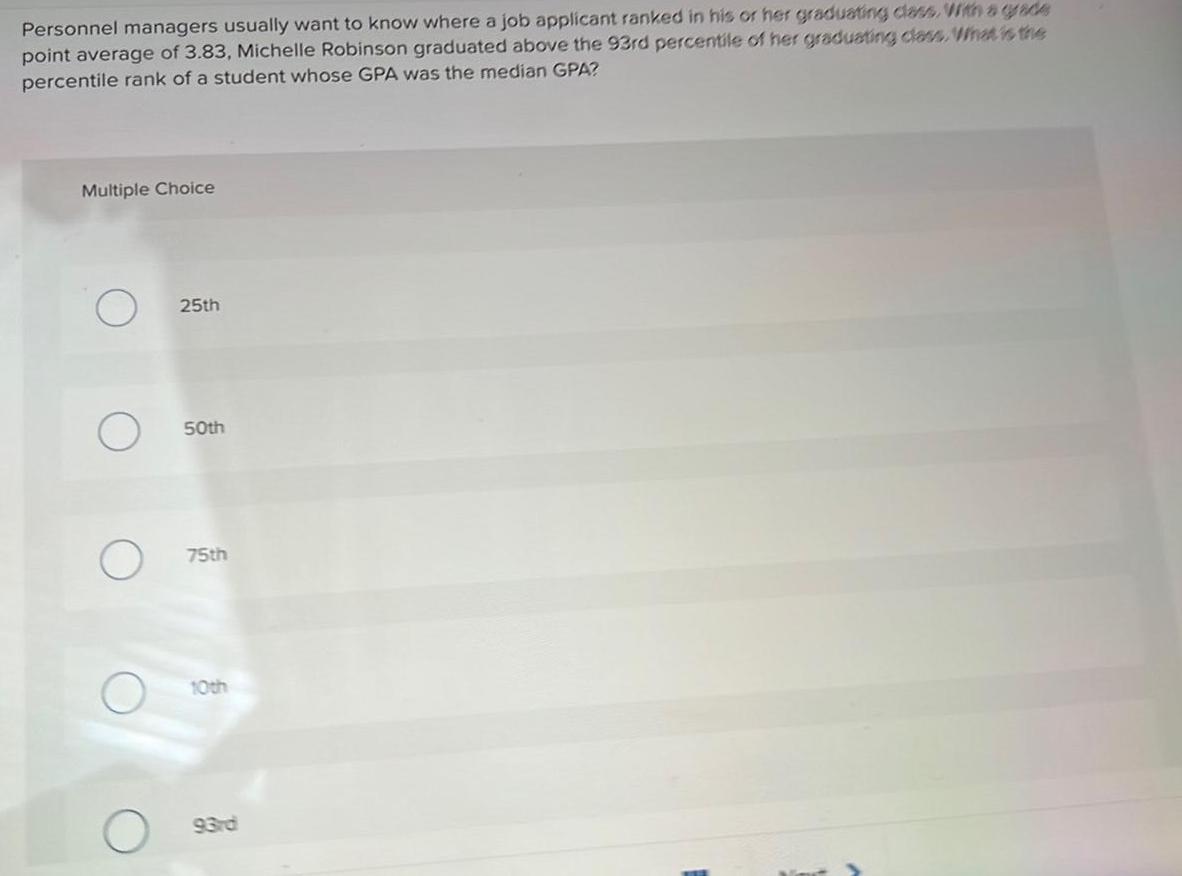
StatisticsPersonnel managers usually want to know where a job applicant ranked in his or her graduating class. With a grade
point average of 3.83, Michelle Robinson graduated above the 93rd percentile of her graduating class. What is the
percentile rank of a student whose GPA was the median GPA?
Multiple Choice
O
25th
50th
75th
10th
93rd
![According to a survey of the top 10 employers in a major city in the Midwest, a
worker spends an average of 413 minutes a day on the job. Suppose the
standard deviation is 26.8 minutes and the time spent is approximately a normal
distribution.
What are the times within which approximately 99.73 percent of all workers will
fall?
Multiple Choice
[305.8, 520.2]
[386.2, 439.8]
[372.8, 453.2]
[359.4, 466.6]
[332.6, 493.4]](https://media.kunduz.com/media/sug-question/raw/66218656-1657132135.9664783.jpeg?w=256)
Math
StatisticsAccording to a survey of the top 10 employers in a major city in the Midwest, a
worker spends an average of 413 minutes a day on the job. Suppose the
standard deviation is 26.8 minutes and the time spent is approximately a normal
distribution.
What are the times within which approximately 99.73 percent of all workers will
fall?
Multiple Choice
[305.8, 520.2]
[386.2, 439.8]
[372.8, 453.2]
[359.4, 466.6]
[332.6, 493.4]
Math
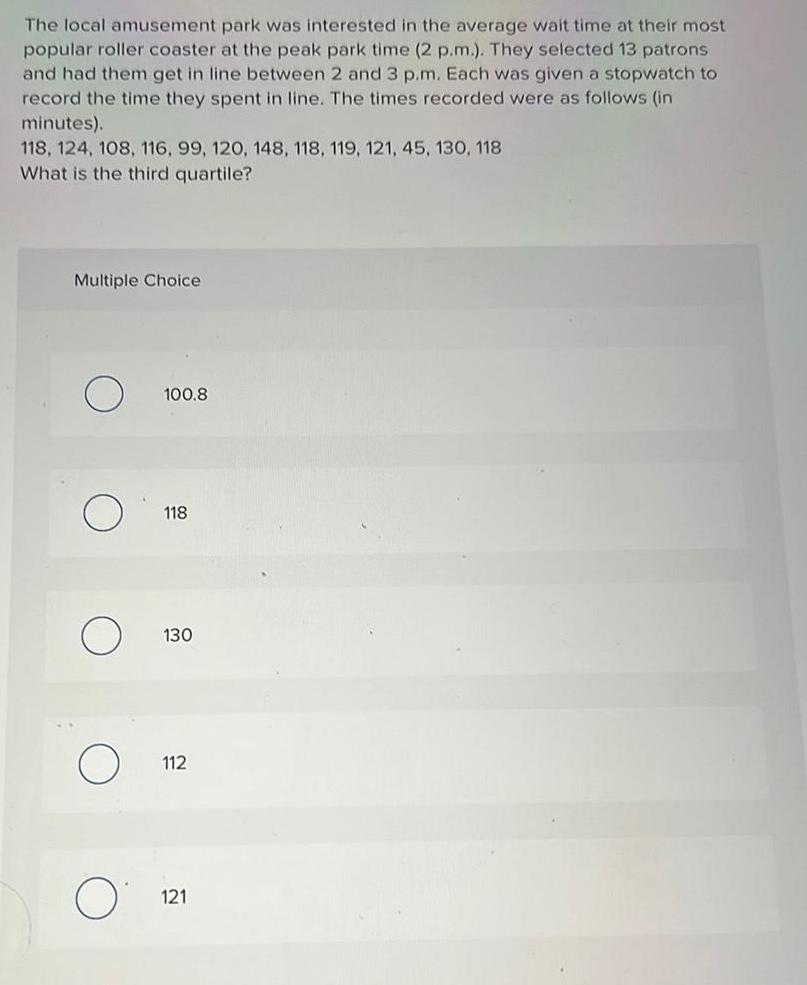
StatisticsThe local amusement park was interested in the average wait time at their most
popular roller coaster at the peak park time (2 p.m.). They selected 13 patrons
and had them get in line between 2 and 3 p.m. Each was given a stopwatch to
record the time they spent in line. The times recorded were as follows (in
minutes).
118, 124, 108, 116, 99, 120, 148, 118, 119, 121, 45, 130, 118
What is the third quartile?
Multiple Choice
O
100.8
118
130
112
121
Math
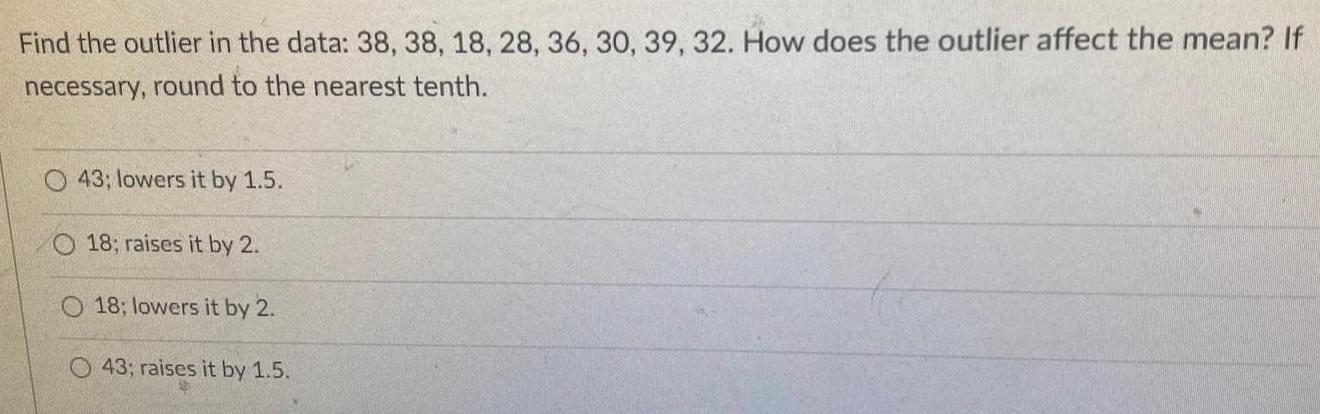
StatisticsFind the outlier in the data: 38, 38, 18, 28, 36, 30, 39, 32. How does the outlier affect the mean? If
necessary, round to the nearest tenth.
43; lowers it by 1.5.
18; raises it by 2.
18; lowers it by 2.
43; raises it by 1.5.
Math
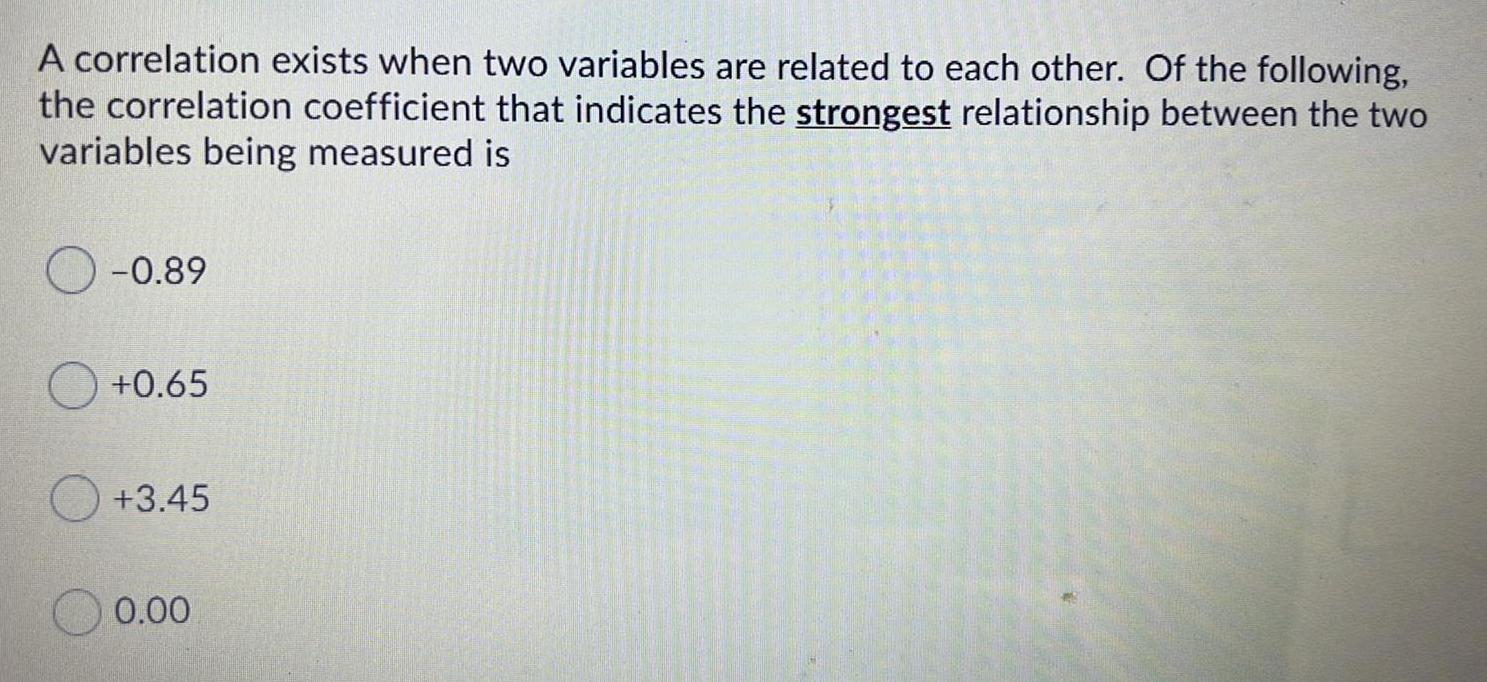
StatisticsA correlation exists when two variables are related to each other. Of the following,
the correlation coefficient that indicates the strongest relationship between the two
variables being measured is
-0.89
+0.65
+3.45
0.00
Math
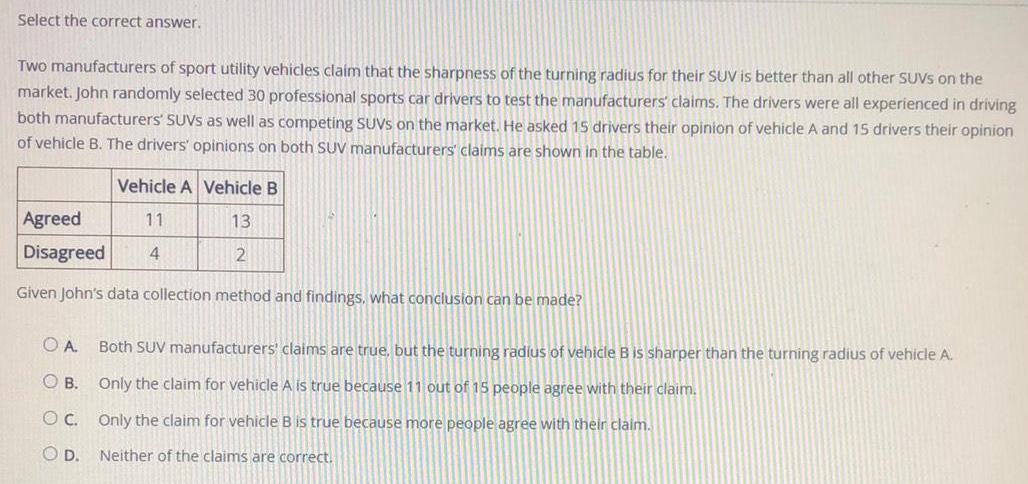
StatisticsTwo manufacturers of sport utility vehicles claim that the sharpness of the turning radius for their SUV is better than all other SUVs on the market. John randomly selected 30 professional sports car drivers to test the manufacturers' claims. The drivers were all experienced in driving both manufacturers' SUVs as well as competing SUVs on the market. He asked 15 drivers their opinion of vehicle A and 15 drivers their opinion of vehicle B. The drivers' opinions on both SUV manufacturers' claims are shown in the table.
Vehicle A Vehicle B
Agreed 11 13
Disagreed 4 2
Given John's data collection method and findings, what conclusion can be made?
A. Both SUV manufacturers' claims are true, but the turning radius of vehicle B is sharper than the turning radius of vehicle A.
B. Only the claim for vehicle A is true because 11 out of 15 people agree with their claim.
C. Only the claim for vehicle B is true because more people agree with their claim.
D. Neither of the claims are correct.

Math
StatisticsAt Gillway Community College, 43 out of 381 students earned honors. At Montessa Valley Community College, 17 out of 108 students earned honors. Calculate the rate at which Gillway students earned honors. Round to the nearest 1%.
Math
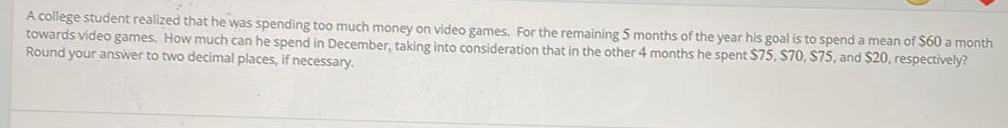
StatisticsA college student realized that he was spending too much money on video games. For the remaining 5 months of the year his goal is to spend a mean of $60 a month towards video games. How much can he spend in December, taking into consideration that in the other 4 months he spent $75, $70, $75, and $20, respectively?
Round your answer to two decimal places, if necessary.
Math
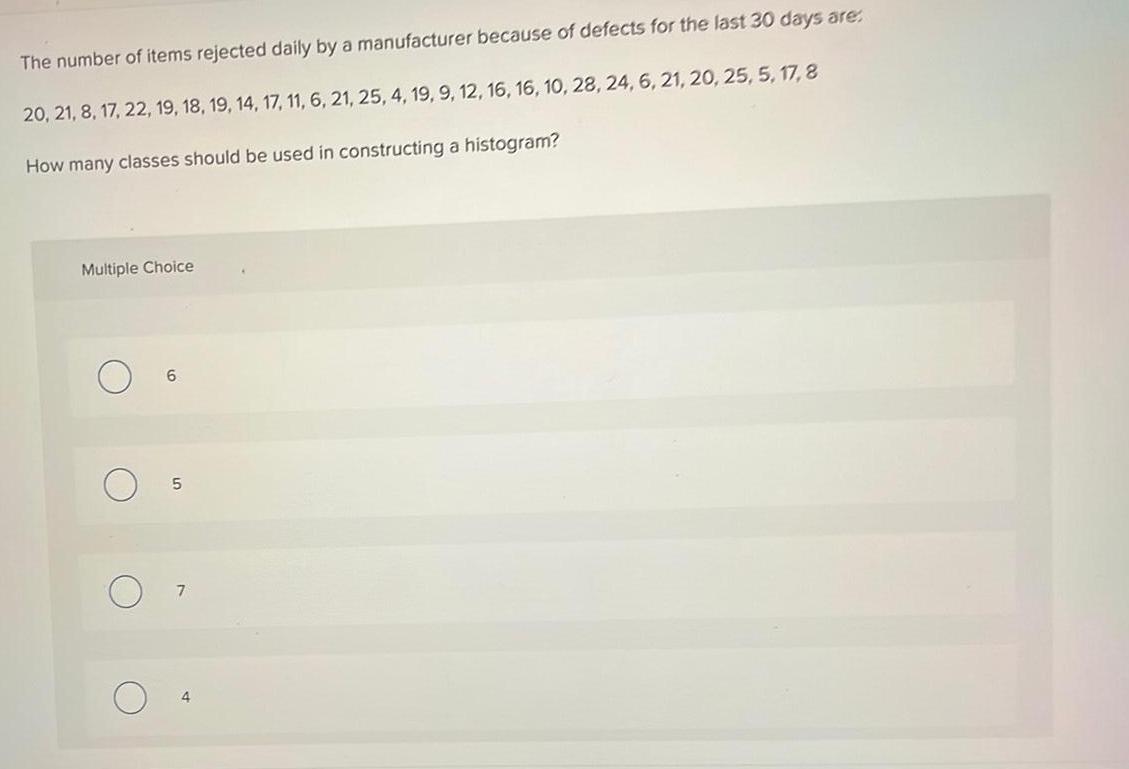
StatisticsThe number of items rejected daily by a manufacturer because of defects for the last 30 days are:
20, 21, 8, 17, 22, 19, 18, 19, 14, 17, 11, 6, 21, 25, 4, 19, 9, 12, 16, 16, 10, 28, 24, 6, 21, 20, 25, 5, 17, 8
How many classes should be used in constructing a histogram?
Math
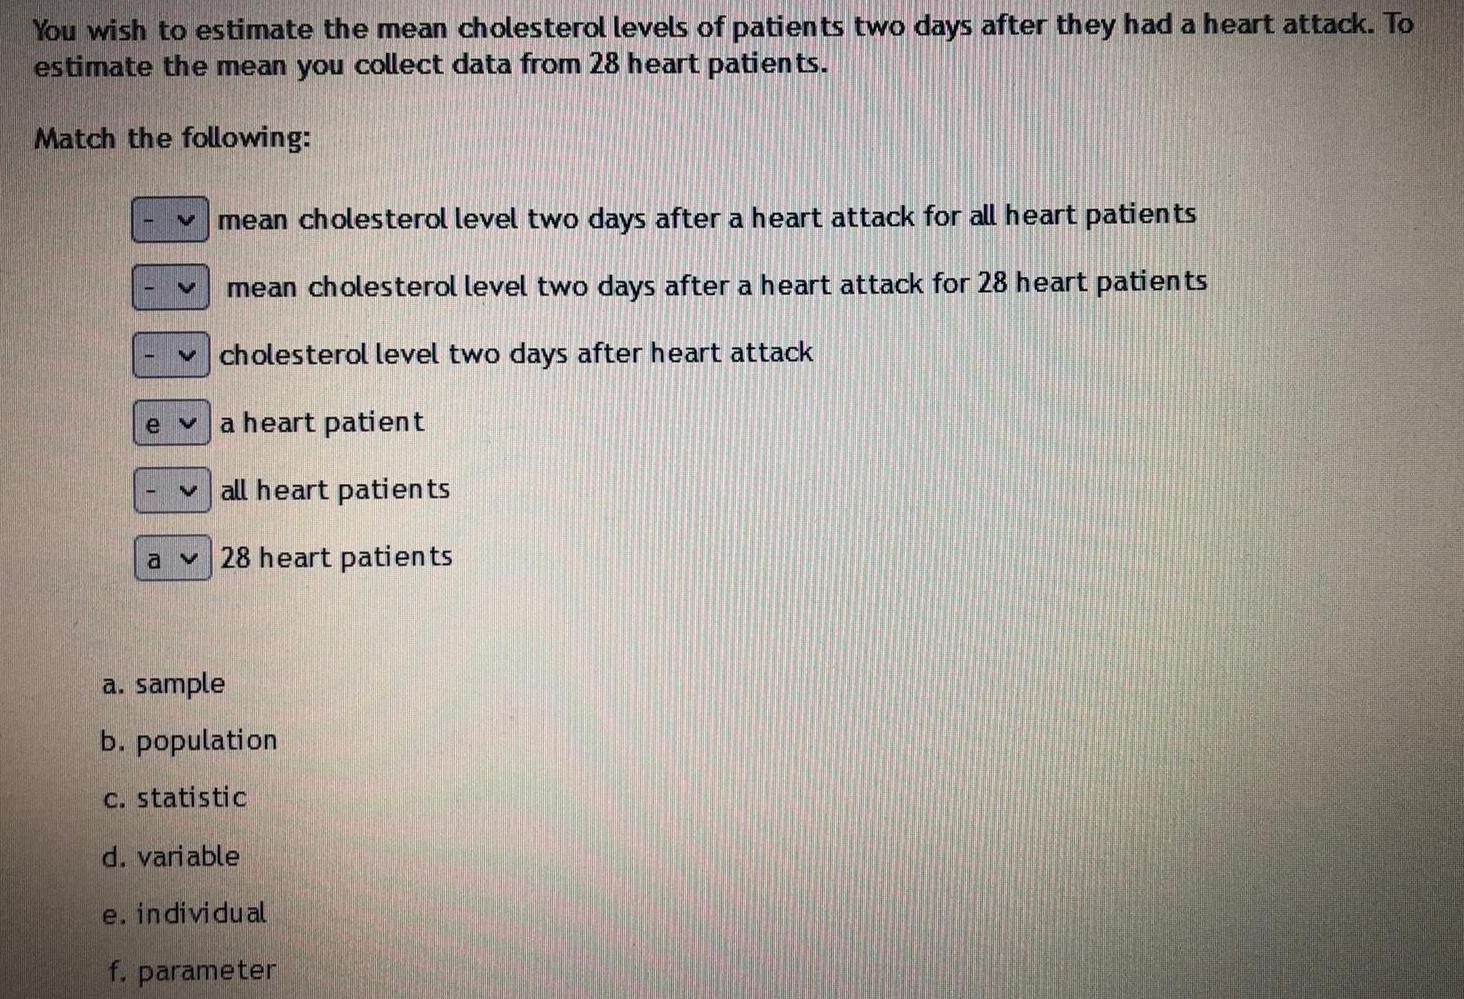
StatisticsYou wish to estimate the mean cholesterol levels of patients two days after they had a heart attack. To
estimate the mean you collect data from 28 heart patients.
Match the following:
e
V
mean cholesterol level two days after a heart attack for all heart patients
mean cholesterol level two days after a heart attack for 28 heart patients
cholesterol level two days after heart attack
a heart patient
all heart patients
28 heart patients
a. sample
b. population
c. statistic
d. variable
e. individual
f. parameter
Math
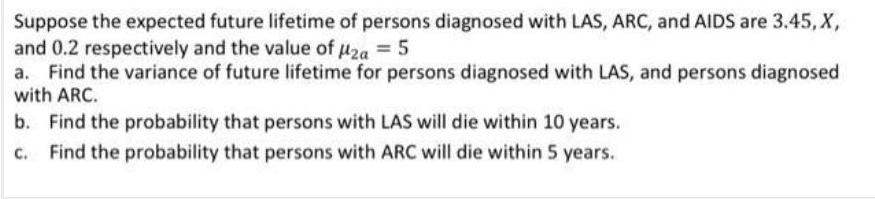
StatisticsSuppose the expected future lifetime of persons diagnosed with LAS, ARC, and AIDS are 3.45, X, and 0.2 respectively and the value of M2a = 5
a. Find the variance of future lifetime for persons diagnosed with LAS, and persons diagnosed with ARC.
b. Find the probability that persons with LAS will die within 10 years.
c. Find the probability that persons with ARC will die within 5 years.
Math
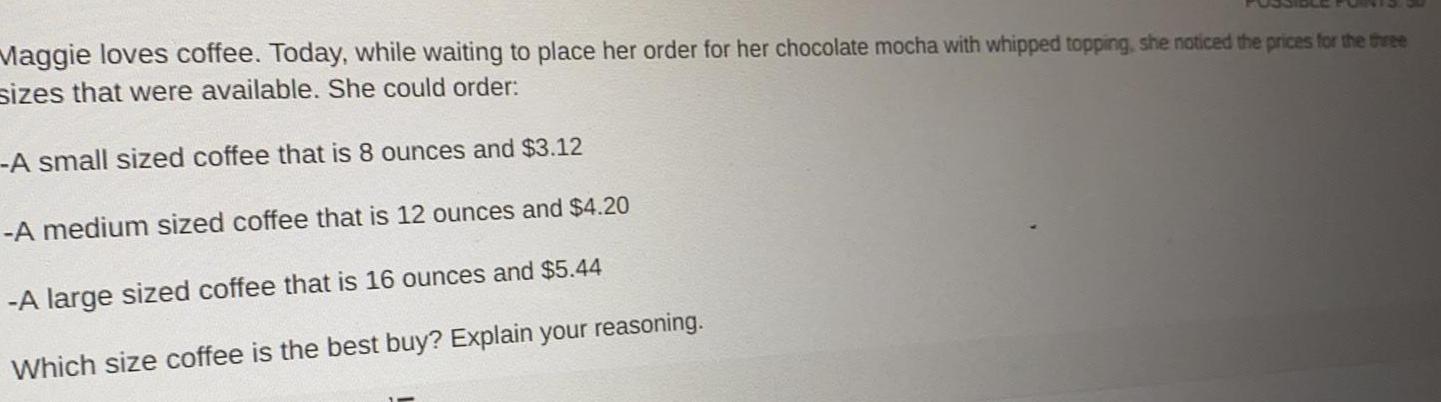
StatisticsMaggie loves coffee. Today, while waiting to place her order for her chocolate mocha with whipped topping, she noticed the prices for the three
sizes that were available. She could order:
--A small sized coffee that is 8 ounces and $3.12
-A medium sized coffee that is 12 ounces and $4.20
-A large sized coffee that is 16 ounces and $5.44
Which size coffee is the best buy? Explain your reasoning.
Math
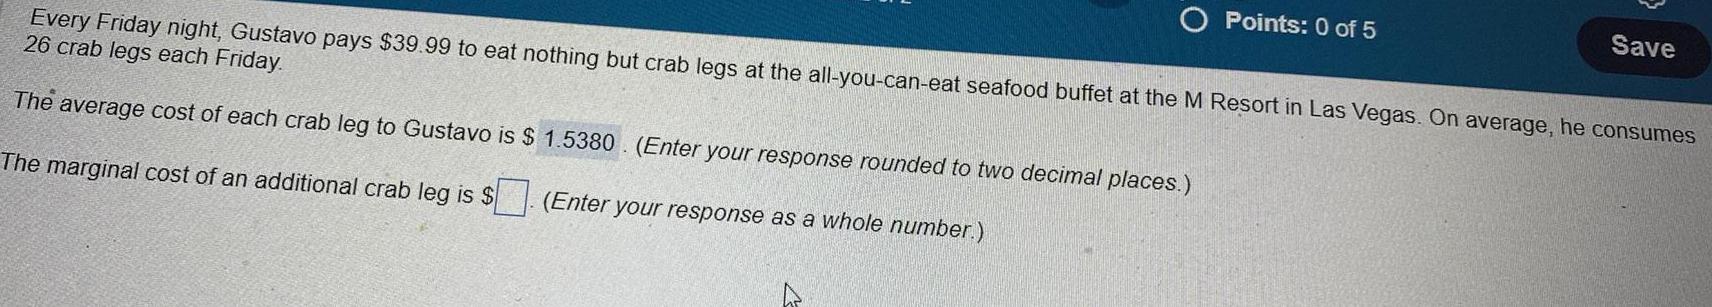
StatisticsEvery Friday night, Gustavo pays $39.99 to eat nothing but crab legs at the all-you-can-eat seafood buffet at the M Resort in Las Vegas. On average, he consumes 26 crab legs each Friday.
The average cost of each crab leg to Gustavo is $ (Enter your response rounded to two decimal places.)
The marginal cost of an additional crab leg is $ (Enter your response as a whole number.)
Math
StatisticsIn country A, about four times as many cars are manufactured per day than in country B. If the total number of these cars manufactured per day is 33,025, find the number manufactured in country B and the number manufactured in country A.
Math
StatisticsFind the number of modes, if any, in the following set of data. If a mode exists, also give the value of the mode.
84, 93, 82, 60, 15, 93, 31
Math
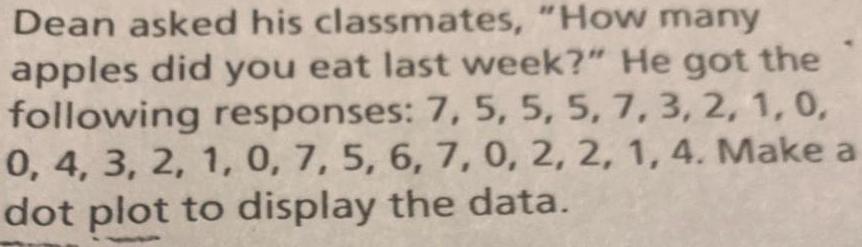
StatisticsDean asked his classmates, "How many
apples did you eat last week?" He got the
following responses: 7, 5, 5, 5, 7, 3, 2, 1, 0,
0, 4, 3, 2, 1, 0, 7, 5, 6, 7, 0, 2, 2, 1, 4. Make a
dot plot to display the data.
Math
StatisticsTiana asked her classmates, "Will you
take Chorus or Music Appreciation next
semester?" She collected these responses:
11 classmates chose Chorus and 17 chose
Music Appreciation. Make a frequency
table to display these data.
Math
StatisticsStudents were randomly selected for a study to determine if they prefer to study Spanish or French. The results showed that 54% would prefer to study
Spanish with a 4% margin of error.
How many students participated in this study?
1,000
621
58
50
320
Math
StatisticsWhen Zahra runs the 400 meter dash, her finishing times are normally distributed
with a mean of 84 seconds and a standard deviation of 1.5 seconds. Using the
empirical rule, what percentage of races will her finishing time be between 81 and 87
seconds?
Math
StatisticsAt the stadium for the Carolina Panthers the owners decide to survey the
opinions of bleacher fans. They plan to select every 50th fan entering the
stadium one Sunday afternoon.
What is the weakness is using this sampling method?
The weakness here is that not every bleacher fan has an equal opportunity of
being chosen. Only every 50th person has a chance. Every other fan is left out.
There is no weakness. This is a an excellent method of collecting a simple
random sample. All people entering the stadium have an equal chance of being
selected.
There is no weakness, this is an example of a simple random sample.
The weakness is that only the people that are volunteering to be part of the
sample have a chance of being selected.
Math
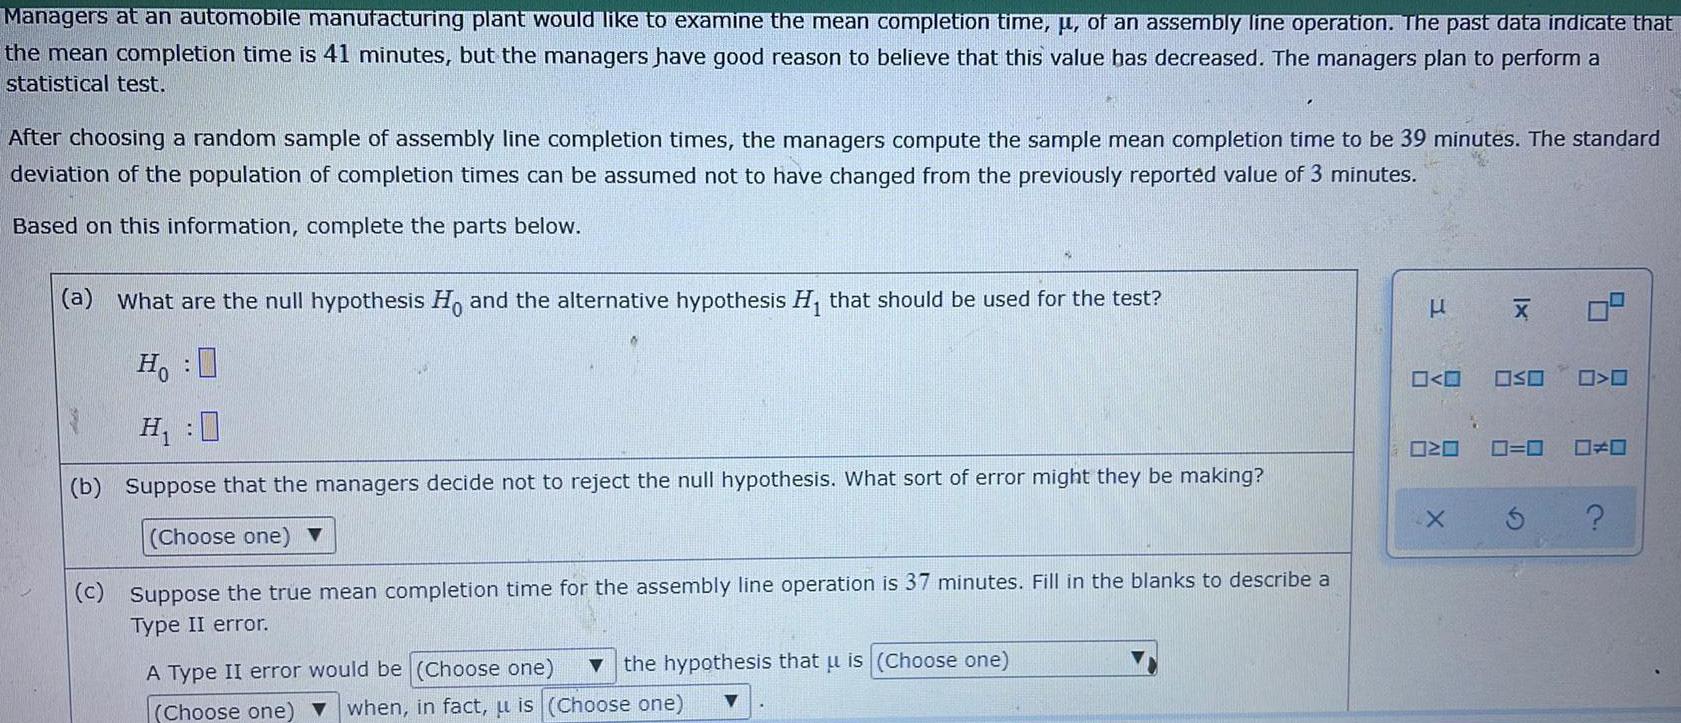
StatisticsManagers at an automobile manufacturing plant would like to examine the mean completion time, u, of an assembly line operation. The past data indicate that the mean completion time is 41 minutes, but the managers have good reason to believe that this value has decreased. The managers plan to perform a
statistical test.
After choosing a random sample of assembly line completion times, the managers compute the sample mean completion time to be 39 minutes. The standard deviation of the population of completion times can be assumed not to have changed from the previously reported value of 3 minutes.
Based on this information, complete the parts below.
(a) What are the null hypothesis Ho and the alternative hypothesis H₁ that should be used for the test?
H:0
H₁ :0
(b) Suppose that the managers decide not to reject the null hypothesis. What sort of error might they be making?
Suppose the true mean completion time for the assembly line operation is 37 minutes. Fill in the blanks to describe a
Type II error.
the hypothesis that u is
A Type II error would be
Math
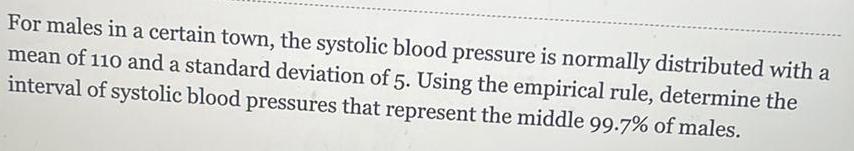
StatisticsFor males in a certain town, the systolic blood pressure is normally distributed with a
mean of 110 and a standard deviation of 5. Using the empirical rule, determine the
interval of systolic blood pressures that represent the middle 99.7% of males.
Math
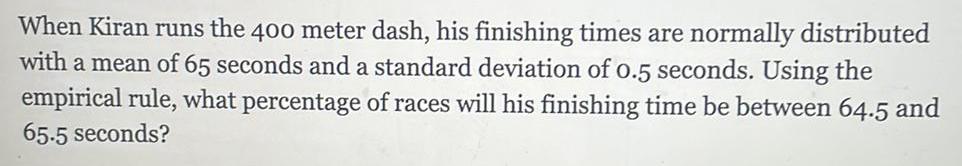
StatisticsWhen Kiran runs the 400 meter dash, his finishing times are normally distributed with a mean of 65 seconds and a standard deviation of 0.5 seconds. Using the empirical rule, what percentage of races will his finishing time be between 64.5 and65.5 seconds?
Math
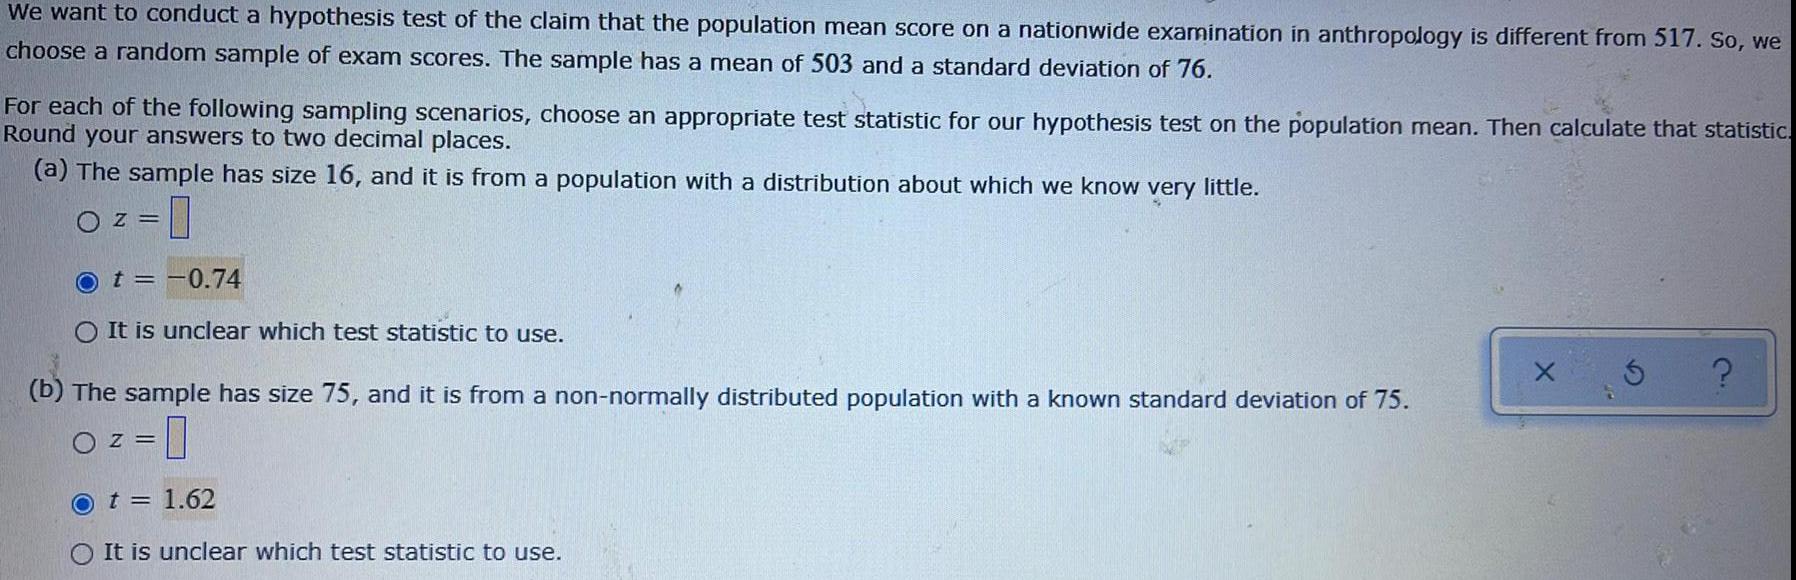
StatisticsWe want to conduct a hypothesis test of the claim that the population mean score on a nationwide examination in anthropology is different from 517. So, we choose a random sample of exam scores. The sample has a mean of 503 and a standard deviation of 76.
For each of the following sampling scenarios, choose an appropriate test statistic for our hypothesis test on the population mean. Then calculate that statistic.
Round your answers to two decimal places.
(a) The sample has size 16, and it is from a population with a distribution about which we know very little.
z=
t = -0.74
It is unclear which test statistic to use.
(b) The sample has size 75, and it is from a non-normally distributed population with a known standard deviation of 75.
z=
t = 1.62
It is unclear which test statistic to use.

Math
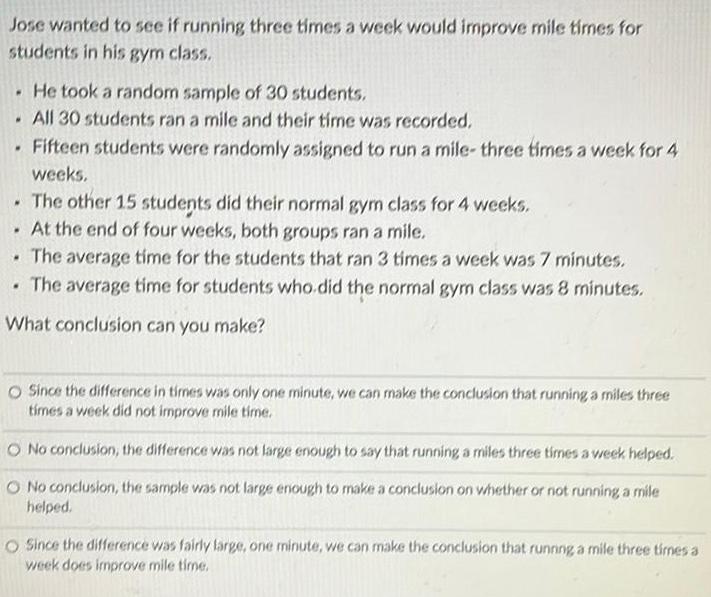
StatisticsJose wanted to see if running three times a week would improve mile times for
students in his gym class.
.
.
.
. The other 15 students did their normal gym class for 4 weeks.
At the end of four weeks, both groups ran a mile.
The average time for the students that ran 3 times a week was 7 minutes.
. The average time for students who did the normal gym class was 8 minutes.
What conclusion can you make?
.
He took a random sample of 30 students.
All 30 students ran a mile and their time was recorded.
Fifteen students were randomly assigned to run a mile- three times a week for 4
weeks.
.
Since the difference in times was only one minute, we can make the conclusion that running a miles three
times a week did not improve mile time.
No conclusion, the difference was not large enough to say that running a miles three times a week helped.
No conclusion, the sample was not large enough to make a conclusion on whether or not running a mile
helped.
Since the difference was fairly large, one minute, we can make the conclusion that running a mile three times a
week does improve mile time.
Math
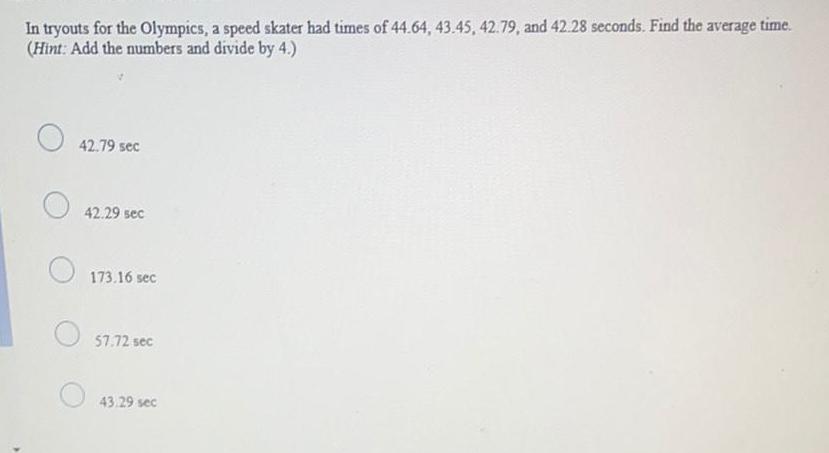
StatisticsIn tryouts for the Olympics, a speed skater had times of 44.64, 43.45, 42.79, and 42.28 seconds. Find the average time.
(Hint: Add the numbers and divide by 4.)
42.79 sec
42.29 sec
173.16 sec
57.72 sec
43.29 sec
Math
StatisticsThe Ancestry Society of North Carolina is compiling records so they can learn about
the history of African Americans in North Carolina from 1820 to 1980. They have
compiled records of all 15,125 gravestones in cemeteries across all 15 counties.
They want to choose a sample of 600 records to check their accuracy by visiting the
actual gravestones.
a) Using the hat method explain how they could gather a simple random sample of
600 gravestones to visit. Here the sample is taken from the setof 15125
gravestones spread accross 15 countries. so the populationt they can infer about
this sample is the population of records of all 15125 gravestones spread across 15
countries.
b) Explain why it would be better to take a sample 40 gravestones from all 15
counties. |
Math
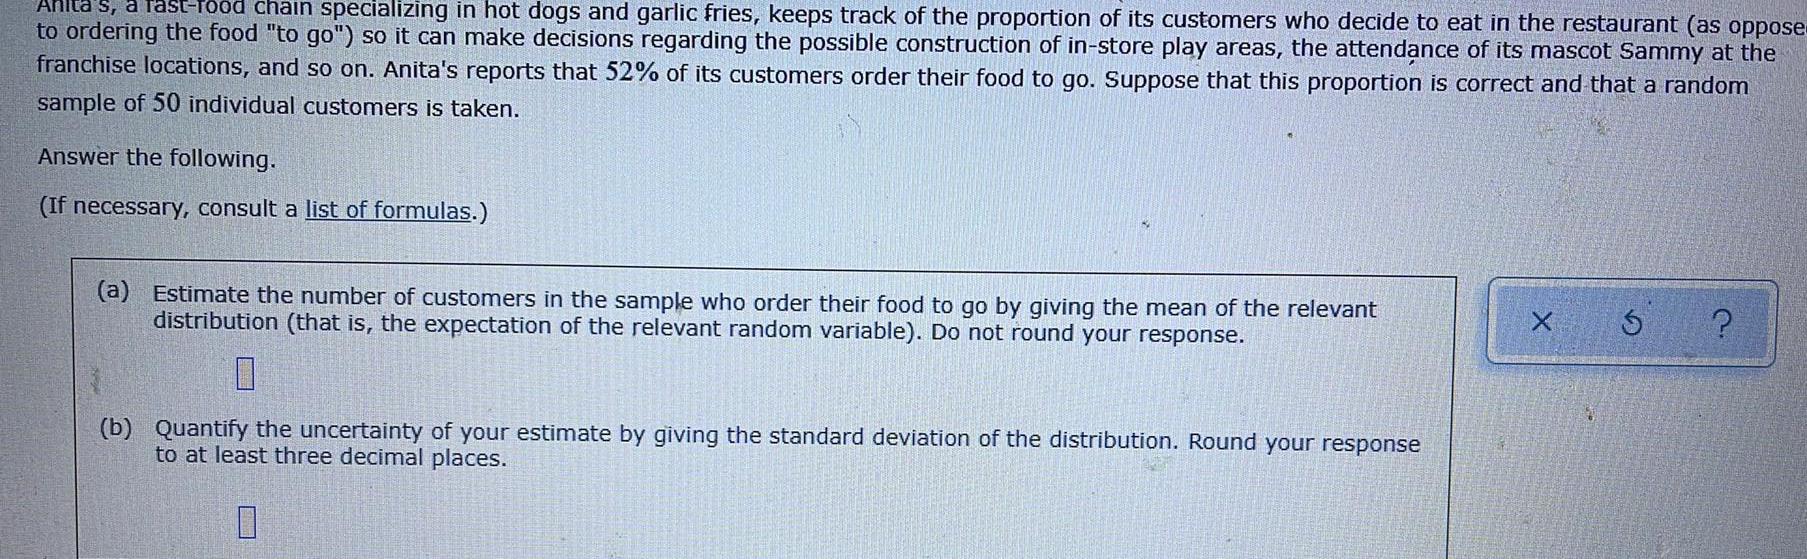
StatisticsAnita's fast-food chain specializing in hot dogs and garlic fries, keeps track of the proportion of its customers who decide to eat in the restaurant (as oppose-to ordering the food "to go") so it can make decisions regarding the possible construction of in-store play areas, the attendance of its mascot Sammy at thefranchise locations, and so on. Anita's reports that 52% of its customers order their food to go. Suppose that this proportion is correct and that a randomsample of 50 individual customers is taken.Answer the following.(If necessary, consult a list of formulas.)
(a) Estimate the number of customers in the sample who order their food to go by giving the mean of the relevantdistribution (that is, the expectation of the relevant random variable). Do not round your response.
(b) Quantify the uncertainty of your estimate by giving the standard deviation of the distribution. Round your responseto at least three decimal places.0XŚ ?

Math
StatisticsAccording to records, the amount of precipitation in a certain city on a November day has a mean of 0.10 inches, with a standard deviation of 0.07 inches. What
is the probability that the mean daily precipitation will be 0.11 inches or less for a random sample of 40 November days (taken over many years)?
Carry your intermediate computations to at least four decimal places. Round your answer to at least three decimal places.
Math
StatisticsAt a local restaurant, the amount of time that customers have to wait for their food is
normally distributed with a mean of 12 minutes and a standard deviation of 2
minutes. Using the empirical rule, determine the interval of minutes that the middle
99.7% of customers have to wait.
Math
StatisticsWhen Alexa commutes to work, the amount of time it takes her to arrive is normally distributed with a mean of 34 minutes and a standard deviation of 3.5 minutes. What percentage of her commutes will be longer than 35 minutes, to the nearest tenth?