Statistics Questions and Answers
Math
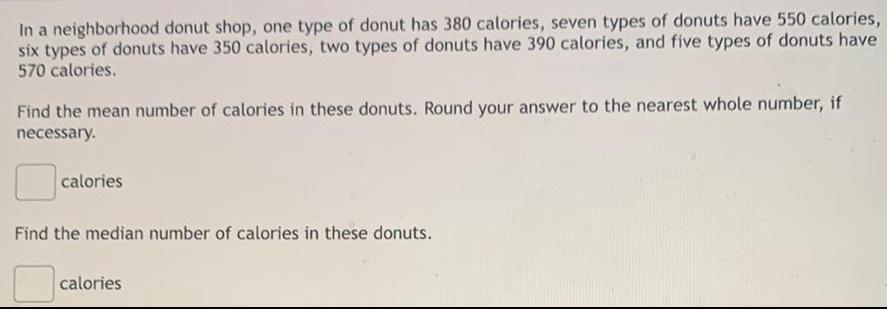
StatisticsIn a neighborhood donut shop, one type of donut has 380 calories, seven types of donuts have 550 calories, six types of donuts have 350 calories, two types of donuts have 390 calories, and five types of donuts have 570 calories.
Find the mean number of calories in these donuts. Round your answer to the nearest whole number, if necessary.
calories
Find the median number of calories in these donuts.
calories
Math
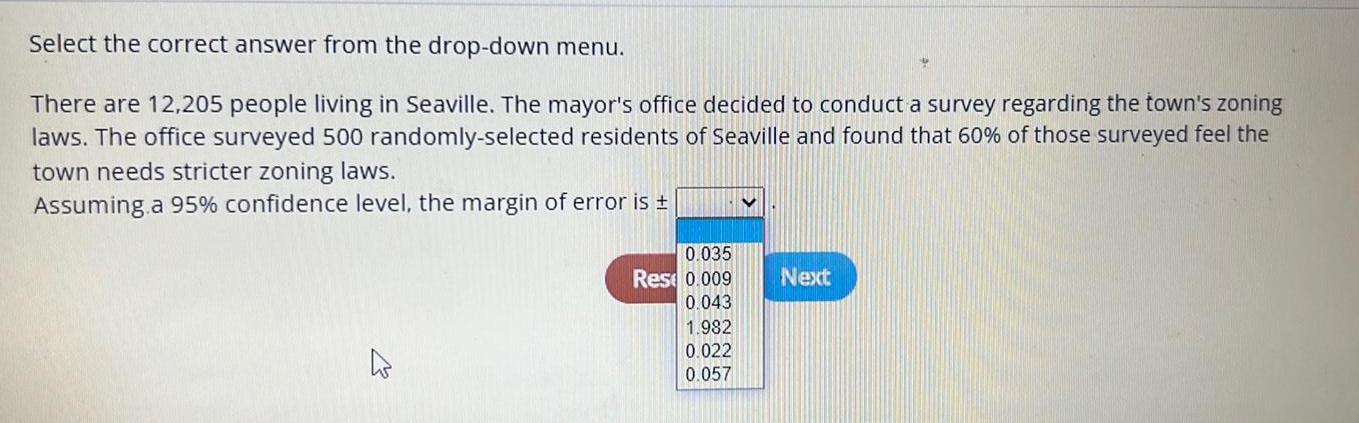
StatisticsSelect the correct answer from the drop-down menu. There are 12,205 people living in Seaville. The mayor's office decided to conduct a survey regarding the town's zoning laws. The office surveyed 500 randomly-selected residents of Seaville and found that 60% of those surveyed feel the town needs stricter zoning laws.
Assuming a 95% confidence level, the margin of error is ±
0.035
0.009
0.043
1.982
0.022
0.057
Math
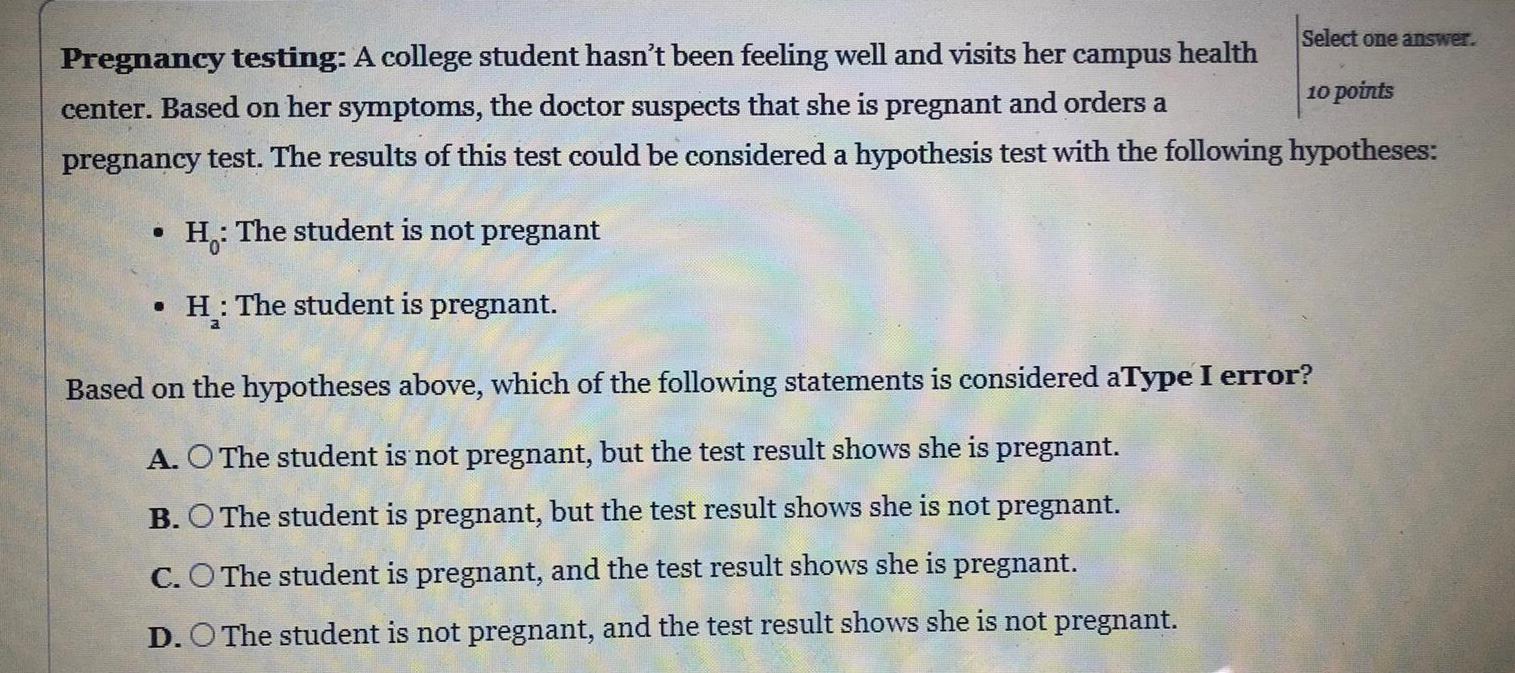
StatisticsPregnancy testing: A college student hasn't been feeling well and visits her campus health
center. Based on her symptoms, the doctor suspects that she is pregnant and orders a
pregnancy test. The results of this test could be considered a hypothesis test with the following hypotheses:
● H: The student is not pregnant
● H: The student is pregnant.
Based on the hypotheses above, which of the following statements is considered aType I error?
A. O The student is not pregnant, but the test result shows she is pregnant.
B. O The student is pregnant, but the test result shows she is not pregnant.
C. O The student is pregnant, and the test result shows she is pregnant.
D. O The student is not pregnant, and the test result shows she is not pregnant.
Math
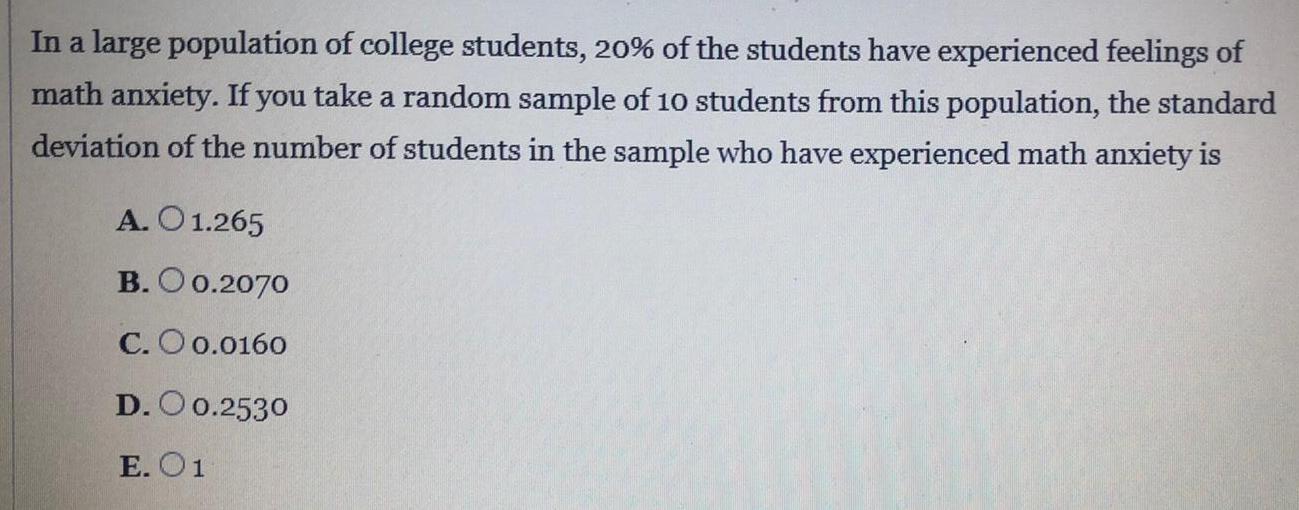
StatisticsIn a large population of college students, 20% of the students have experienced feelings of
math anxiety. If you take a random sample of 10 students from this population, the standard
deviation of the number of students in the sample who have experienced math anxiety is
A. 1.265
B. 0.2070
C. 0.0160
D. 0.2530
E. 1
Math
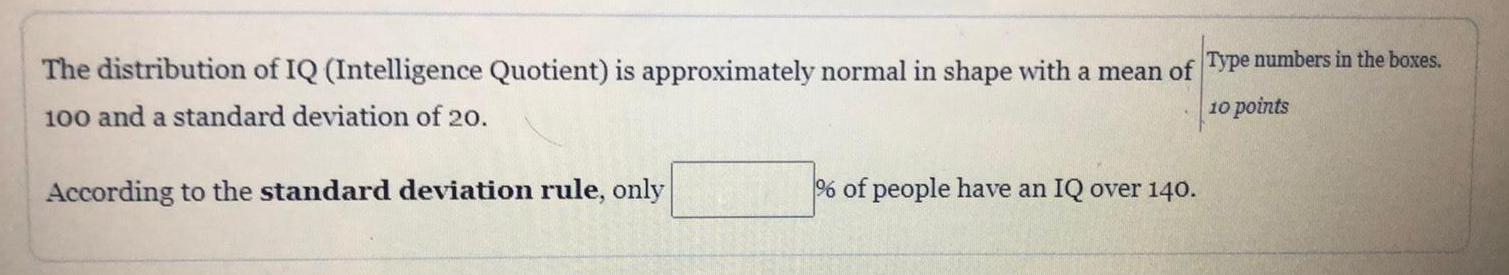
StatisticsThe distribution of IQ (Intelligence Quotient) is approximately normal in shape with a mean of 100 and a standard deviation of 20.
According to the standard deviation rule, only
% of people have an IQ over 140.
Math
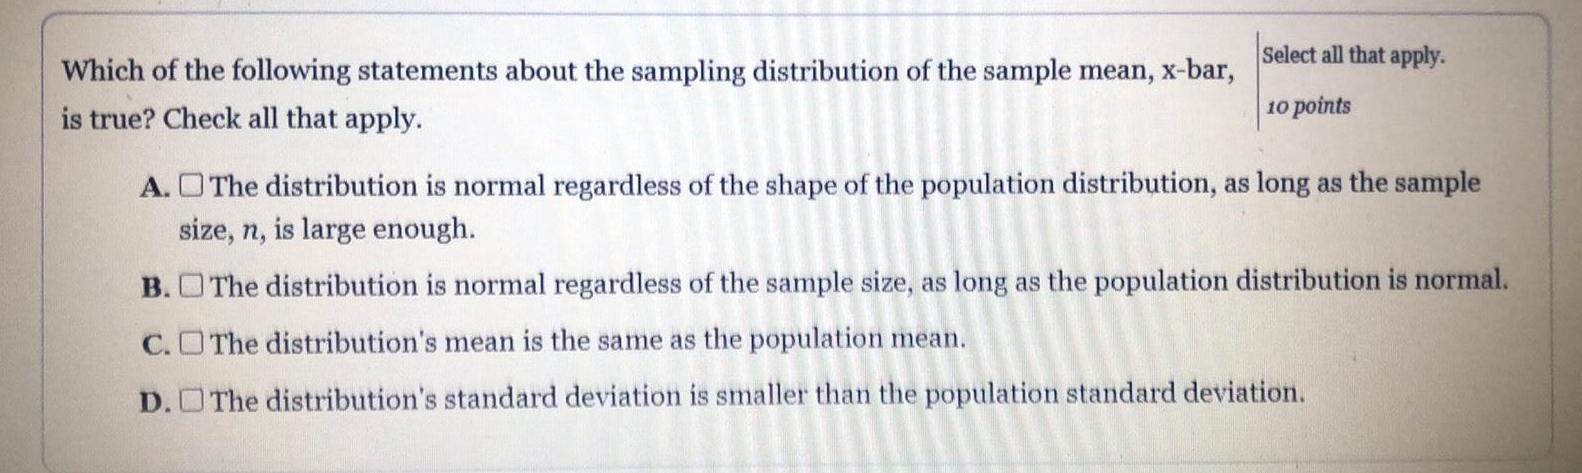
StatisticsWhich of the following statements about the sampling distribution of the sample mean, x-bar,
is true? Check all that apply.
A. The distribution is normal regardless of the shape of the population distribution, as long as the sample size, n, is large enough.
B. The distribution is normal regardless of the sample size, as long as the population distribution is normal.
C. The distribution's mean is the same as the population mean.
D. The distribution's standard deviation is smaller than the population standard deviation.
Math
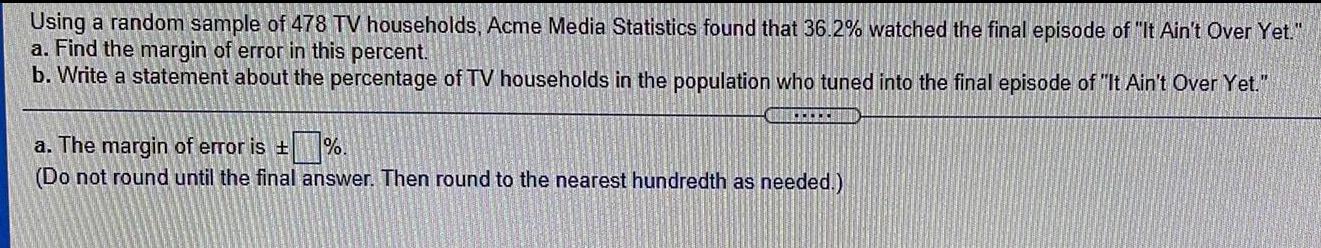
StatisticsUsing a random sample of 478 TV households, Acme Media Statistics found that 36.2% watched the final episode of "It Ain't Over Yet."
a. Find the margin of error in this percent.
b. Write a statement about the percentage of TV households in the population who tuned into the final episode of "It Ain't Over Yet."
a. The margin of error is ±%.
Math
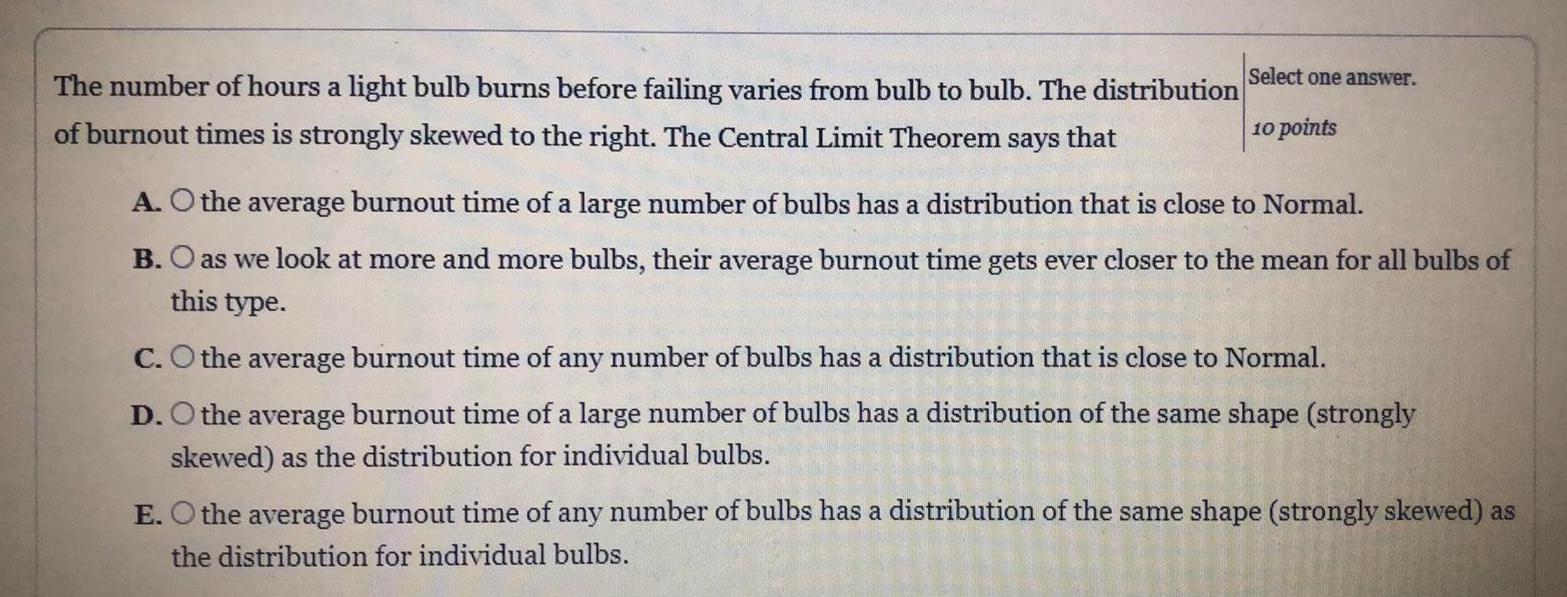
StatisticsThe number of hours a light bulb burns before failing varies from bulb to bulb. The distribution of burnout times is strongly skewed to the right. The Central Limit Theorem says that
A. O the average burnout time of a large number of bulbs has a distribution that is close to Normal.
B. O as we look at more and more bulbs, their average burnout time gets ever closer to the mean for all bulbs of this type.
C.the average burnout time of any number of bulbs has a distribution that is close to Normal.
D. the average burnout time of a large number of bulbs has a distribution of the same shape (strongly skewed) as the distribution for individual bulbs.
E. the average burnout time of any number of bulbs has a distribution of the same shape (strongly skewed) as the distribution for individual bulbs.
Math
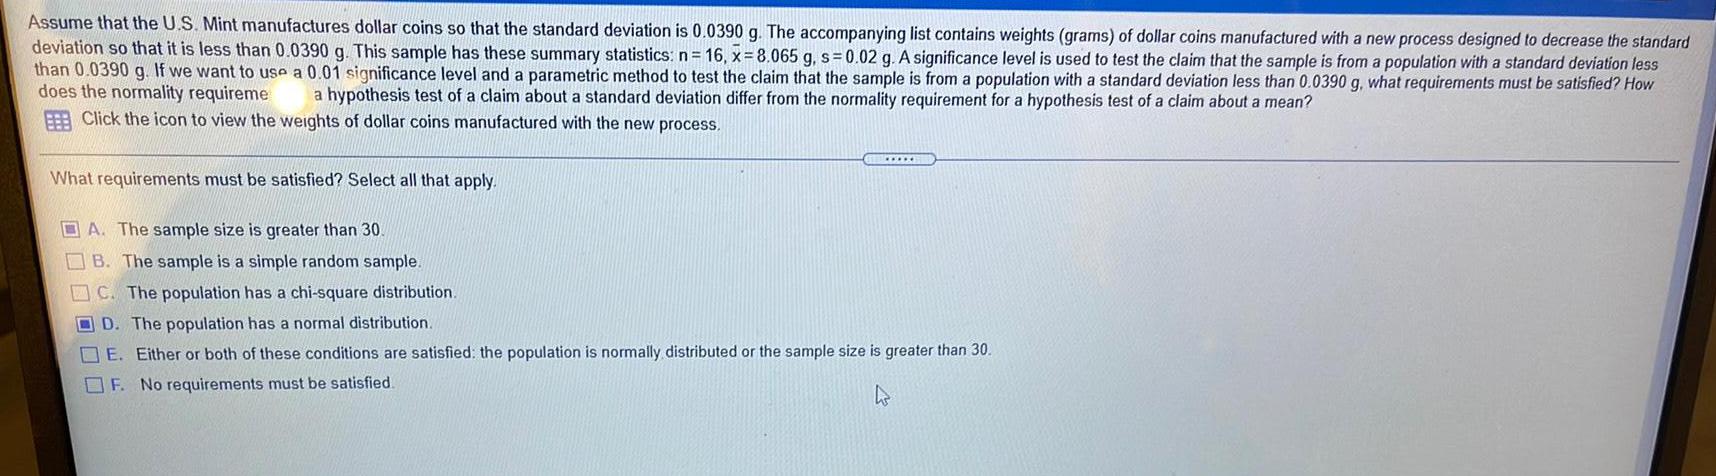
StatisticsAssume that the U.S. Mint manufactures dollar coins so that the standard deviation is 0.0390 g. The accompanying list contains weights (grams) of dollar coins manufactured with a new process designed to decrease the standard
deviation so that it is less than 0.0390 g. This sample has these summary statistics: n = 16, x=8.065 g, s= 0.02 g. A significance level is used to test the claim that the sample is from a population with a standard deviation less
than 0.0390 g. If we want to use a 0.01 significance level and a parametric method to test the claim that the sample is from a population with a standard deviation less than 0.0390 g, what requirements must be satisfied? How
does the normality requireme a hypothesis test of a claim about a standard deviation differ from the normality requirement for a hypothesis test of a claim about a mean?
Click the icon to view the weights of dollar coins manufactured with the new process.
What requirements must be satisfied? Select all that apply.
*****
A. The sample size is greater than 30.
B. The sample is a simple random sample.
C. The population has a chi-square distribution.
D. The population has a normal distribution.
E. Either or both of these conditions are satisfied: the population is normally distributed or the sample size is greater than 30.
OF. No requirements must be satisfied.
Math
Statistics10 points
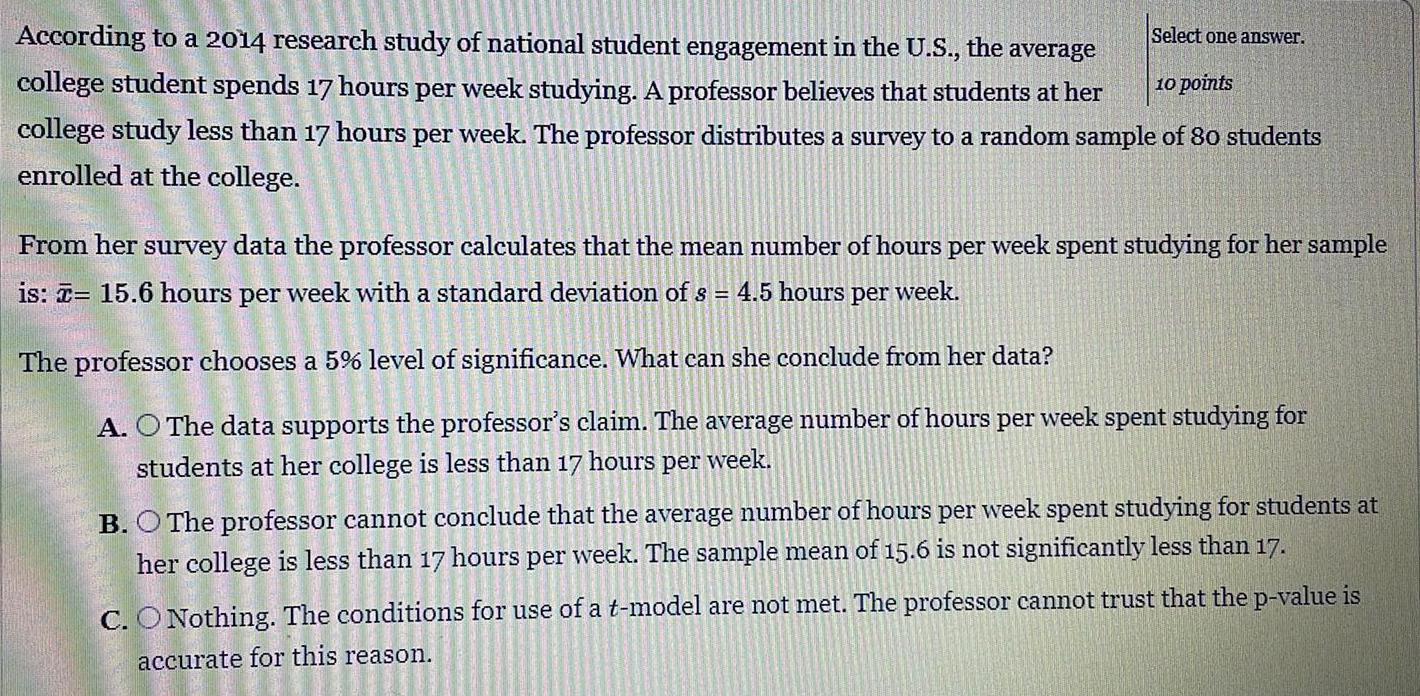
According to a 2014 research study of national student engagement in the U.S., the average
college student spends 17 hours per week studying. A professor believes that students at her
college study less than 17 hours per week. The professor distributes a survey to a random sample of 80 students
enrolled at the college.
Select one answer.
From her survey data the professor calculates that the mean number of hours per week spent studying for her sample
is: - 15.6 hours per week with a standard deviation of s = 4.5 hours per week.
The professor chooses a 5% level of significance. What can she conclude from her data?
A. O The data supports the professor's claim. The average number of hours per week spent studying for
students at her college is less than 17 hours per week.
B. O The professor cannot conclude that the average number of hours per week spent studying for students at
her college is less than 17 hours per week. The sample mean of 15.6 is not significantly less than 17.
C. O Nothing. The conditions for use of a t-model are not met. The professor cannot trust that the p-value is
accurate for this reason.

Math
StatisticsA random variable is normally distributed with a mean of 50 and a standard deviation of 5. What is the probability the random
variable will assume a value between 45 and 55. The probability when Z-1 is .3413; Z-2 is 4772 and Z-3 is .4986
Math
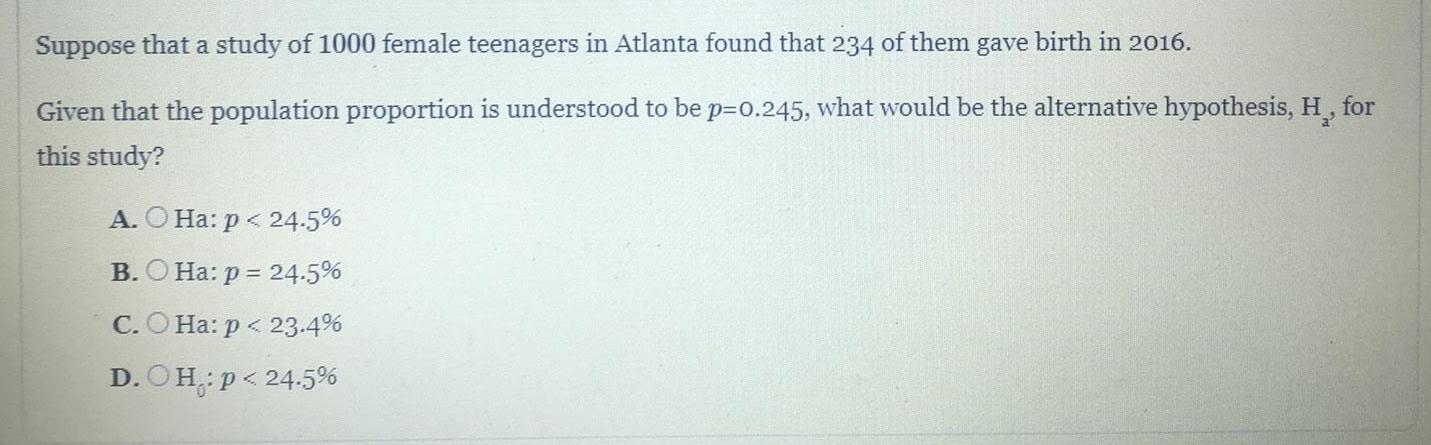
StatisticsSuppose that a study of 1000 female teenagers in Atlanta found that 234 of them gave birth in 2016.
Given that the population proportion is understood to be p=0.245, what would be the alternative hypothesis, H, for this study?
A. O Ha: p < 24.5%
B. O Ha: p = 24.5%
C. O Ha: p < 23.4%
D. O H.: p < 24.5%
Math
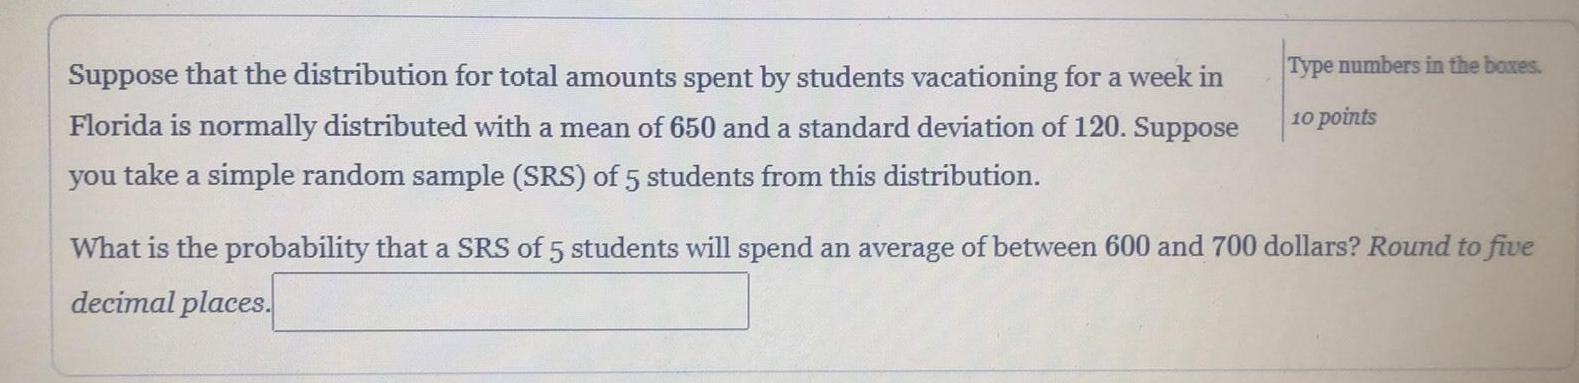
StatisticsSuppose that the distribution for total amounts spent by students vacationing for a week in
Florida is normally distributed with a mean of 650 and a standard deviation of 120. Suppose
you take a simple random sample (SRS) of 5 students from this distribution.
Type numbers in the boxes.
10 points
What is the probability that a SRS of 5 students will spend an average of between 600 and 700 dollars? Round to five
decimal places.
Math
StatisticsSelect one answer.
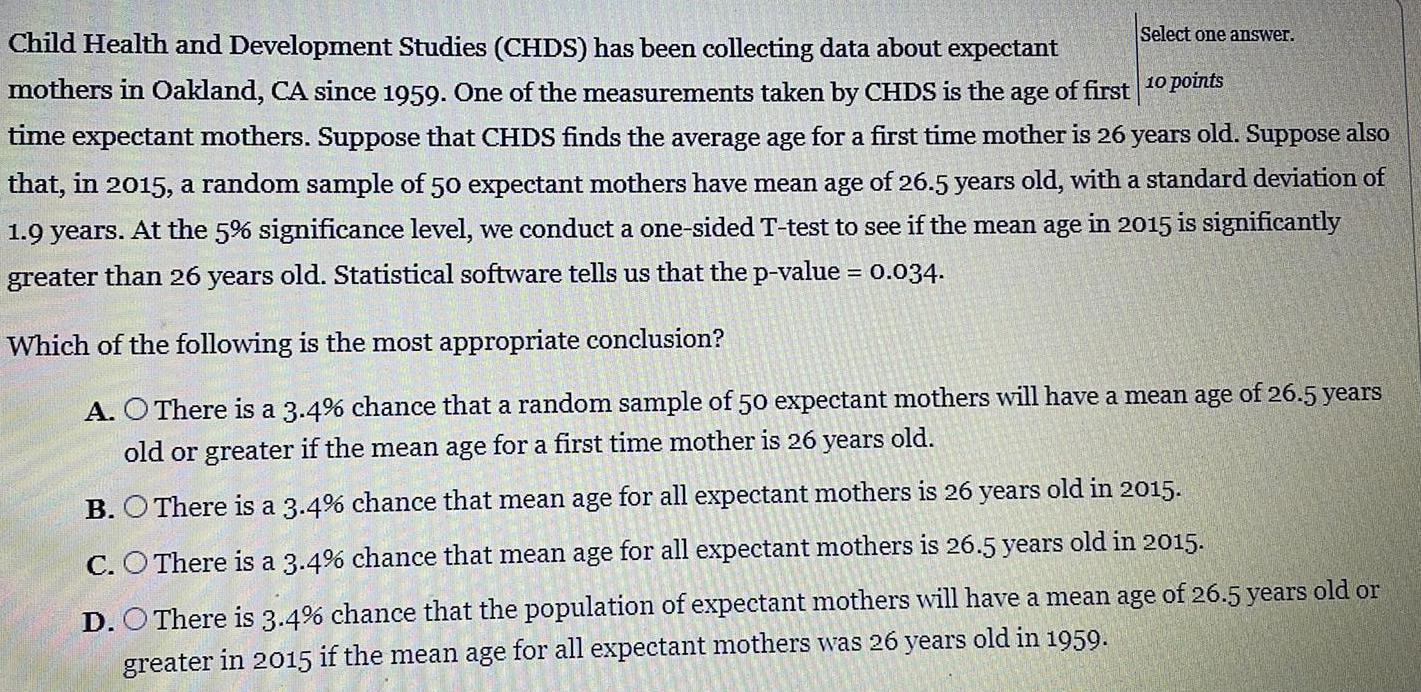
Child Health and Development Studies (CHDS) has been collecting data about expectant
mothers in Oakland, CA since 1959. One of the measurements taken by CHDS is the age of first 10 points
time expectant mothers. Suppose that CHDS finds the average age for a first time mother is 26 years old. Suppose also
that, in 2015, a random sample of 50 expectant mothers have mean age of 26.5 years old, with a standard deviation of
1.9 years. At the 5% significance level, we conduct a one-sided T-test to see if the mean age in 2015 is significantly
greater than 26 years old. Statistical software tells us that the p-value = 0.034.
Which of the following is the most appropriate conclusion?
A. There is a 3.4% chance that a random sample of 50 expectant mothers will have a mean age of 26.5 years
old or greater if the mean age for a first time mother is 26 years old.
B. There is a 3.4% chance that mean age for all expectant mothers is 26 years old in 2015.
C. There is a 3.4% chance that mean age for all expectant mothers is 26.5 years old in 2015.
D. There is 3.4% chance that the population of expectant mothers will have a mean age of 26.5 years old or
greater in 2015 if the mean age for all expectant mothers was 26 years old in 1959.
Math
StatisticsSelect one answer.
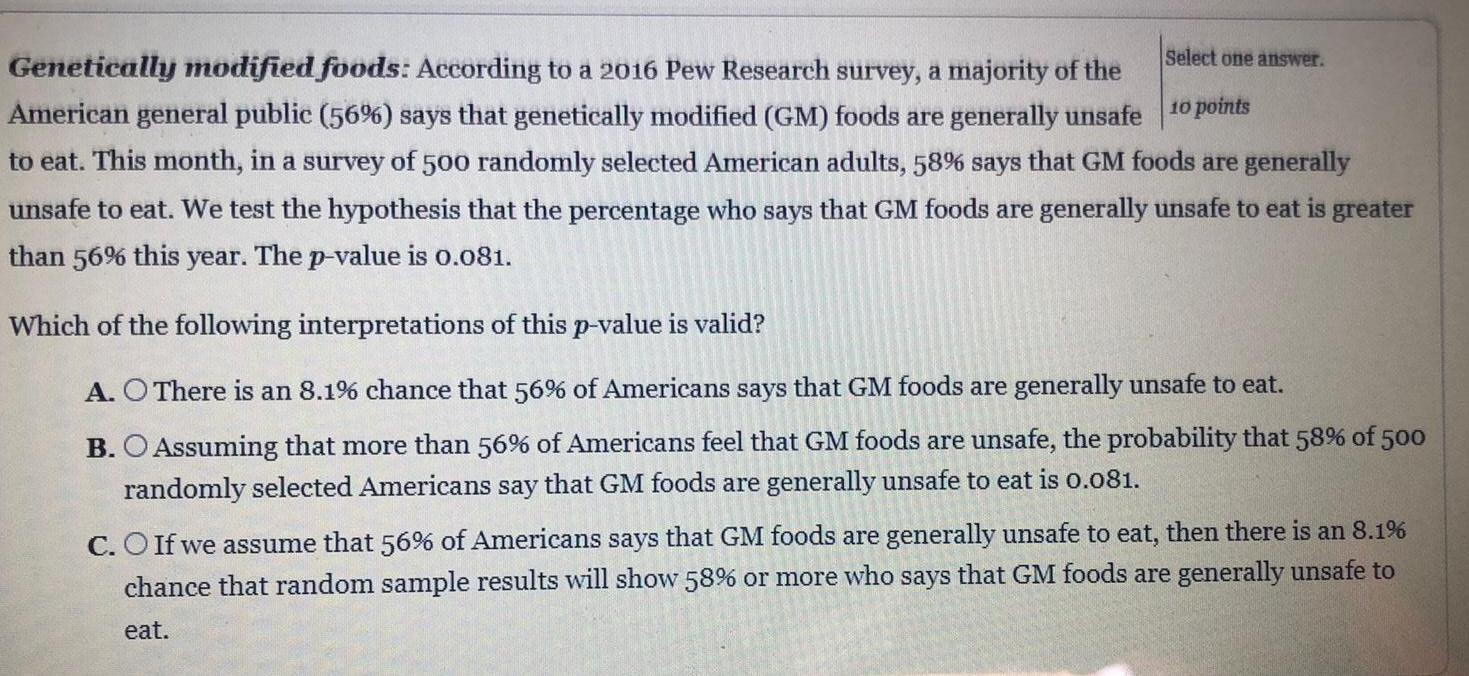
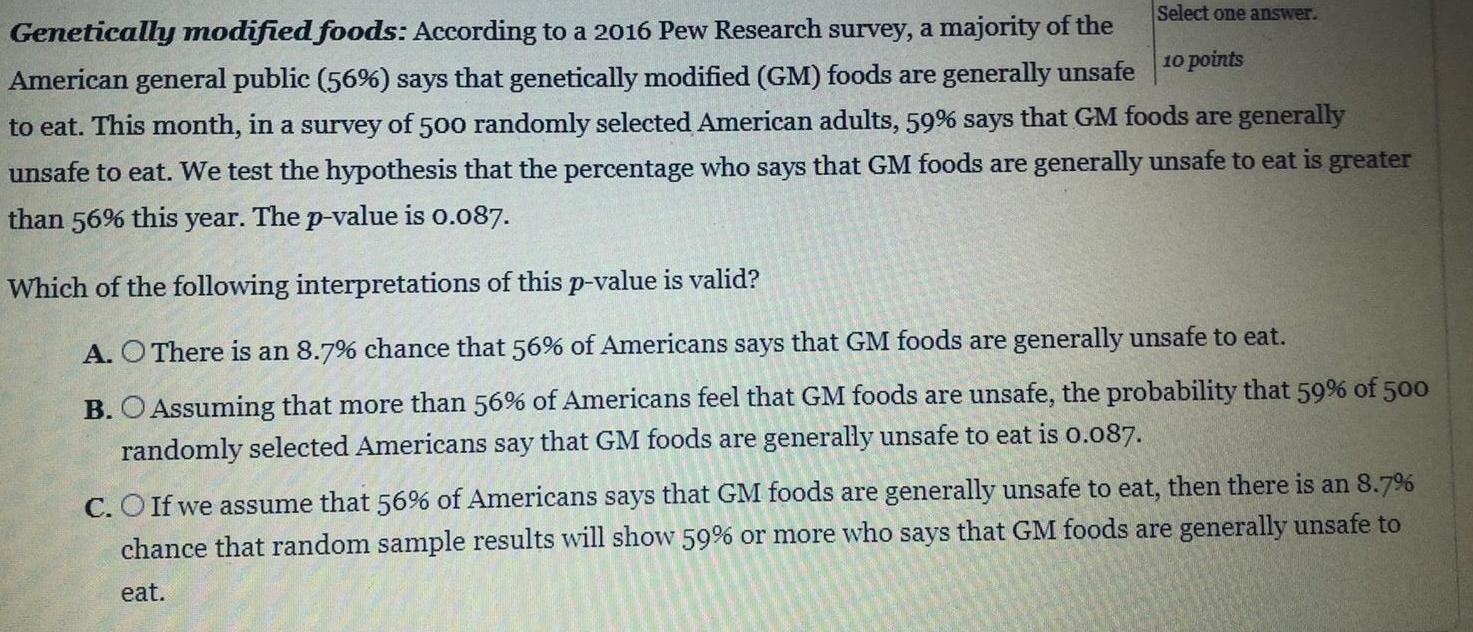
Genetically modified foods: According to a 2016 Pew Research survey, a majority of the
American general public (56%) says that genetically modified (GM) foods are generally unsafe 10 points
to eat. This month, in a survey of 500 randomly selected American adults, 58% says that GM foods are generally
unsafe to eat. We test the hypothesis that the percentage who says that GM foods are generally unsafe to eat is greater
than 56% this year. The p-value is 0.081.
Which of the following interpretations of this p-value is valid?
A. There is an 8.1% chance that 56% of Americans says that GM foods are generally unsafe to eat.
B. Assuming that more than 56% of Americans feel that GM foods are unsafe, the probability that 58% of 500
randomly selected Americans say that GM foods are generally unsafe to eat is 0.081.
C. If we assume that 56% of Americans says that GM foods are generally unsafe to eat, then there is an 8.1%
chance that random sample results will show 58% or more who says that GM foods are generally unsafe to
eat.
Math
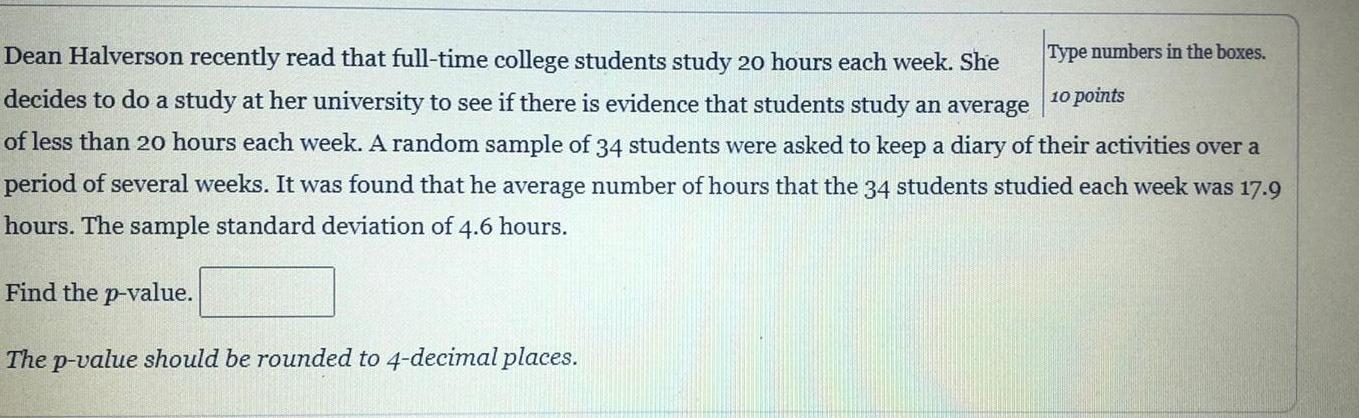
StatisticsDean Halverson recently read that full-time college students study 20 hours each week. She
decides to do a study at her university to see if there is evidence that students study an average
of less than 20 hours each week. A random sample of 34 students were asked to keep a diary of their activities over aperiod of several weeks. It was found that he average number of hours that the 34 students studied each week was 17.9 hours. The sample standard deviation of 4.6 hours.
Find the p-value.
The p-value should be rounded to 4-decimal places.
Math
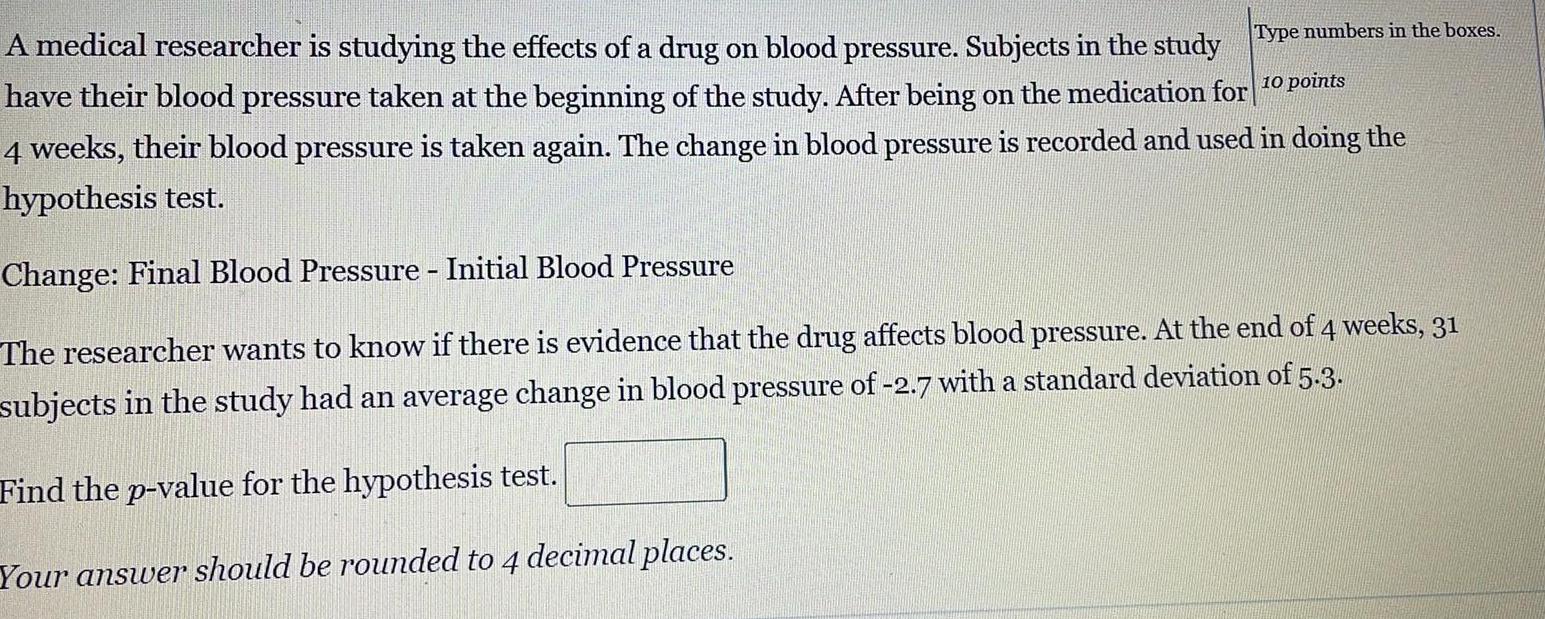
StatisticsA medical researcher is studying the effects of a drug on blood pressure. Subjects in the study Type numbers in the boxes. have their blood pressure taken at the beginning of the study. After being on the medication for eir blood pressure is taken again. The change in blood pressure is recorded and used in doing the hypothesis test.
Change: Final Blood Pressure - Initial Blood Pressure
The researcher wants to know if there is evidence that the drug affects blood pressure. At the end of 4 weeks, 31 subjects in the study had an average change in blood pressure of -2.7 with a standard deviation of 5.3.
Find the p-value for the hypothesis test.
Your answer should be rounded to 4 decimal places.
Math
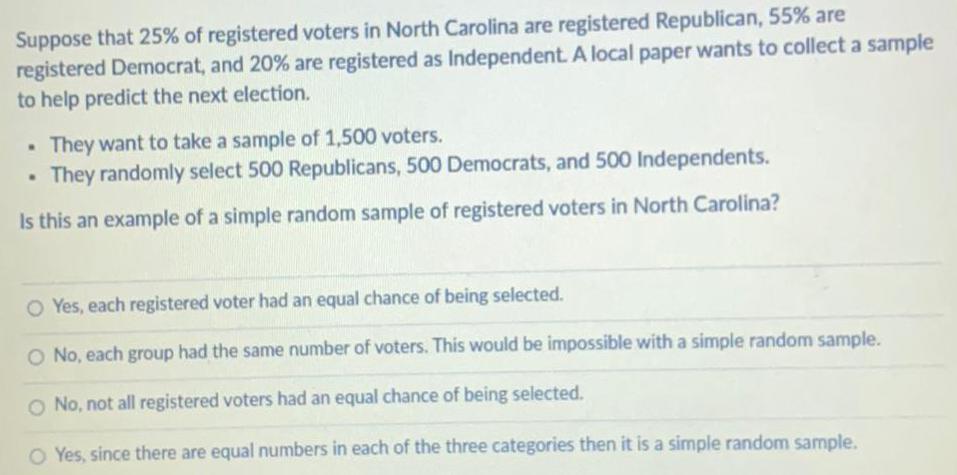
StatisticsSuppose that 25% of registered voters in North Carolina are registered Republican, 55% are
registered Democrat, and 20% are registered as Independent. A local paper wants to collect a sample
to help predict the next election.
...
. They want to take a sample of 1,500 voters.
. They randomly select 500 Republicans, 500 Democrats, and 500 Independents.
Is this an example of a simple random sample of registered voters in North Carolina?
Yes, each registered voter had an equal chance of being selected.
No, each group had the same number of voters. This would be impossible with a simple random sample.
No, not all registered voters had an equal chance of being selected.
Yes, since there are equal numbers in each of the three categories then it is a simple random sample.
Math
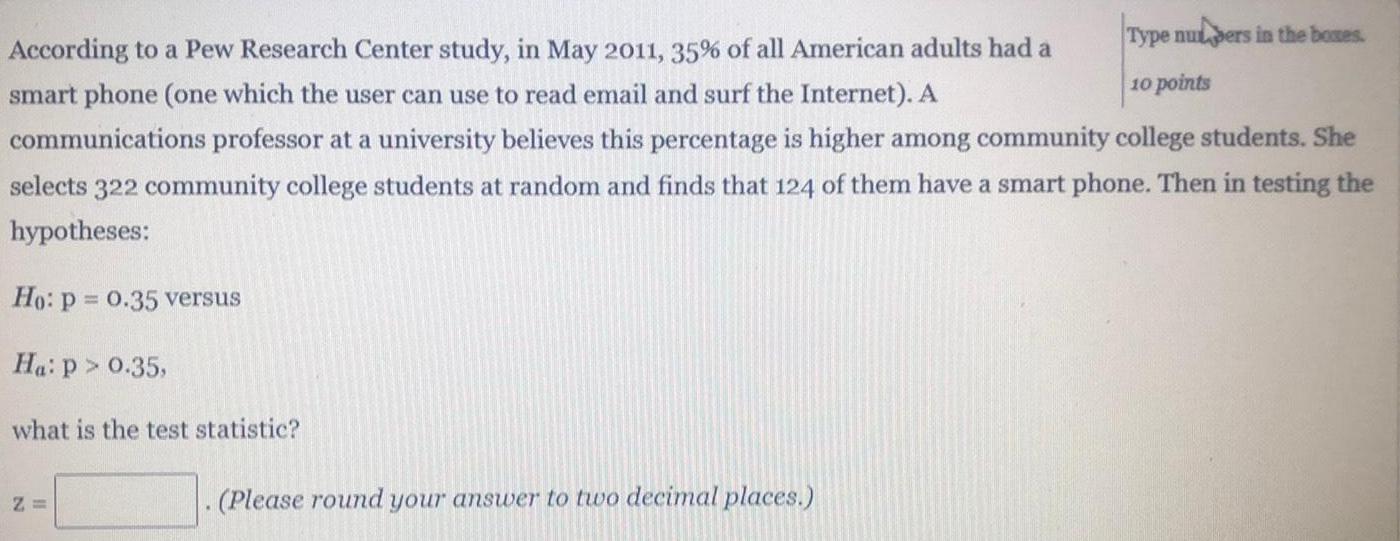
StatisticsAccording to a Pew Research Center study, in May 2011, 35% of all American adults had a
smart phone (one which the user can use to read email and surf the Internet). A
communications professor at a university believes this percentage is higher among community college students. She selects 322 community college students at random and finds that 124 of them have a smart phone. Then in testing the hypotheses:
Ho: p=0.35 versus
Ha: p > 0.35,
what is the test statistic?
Math
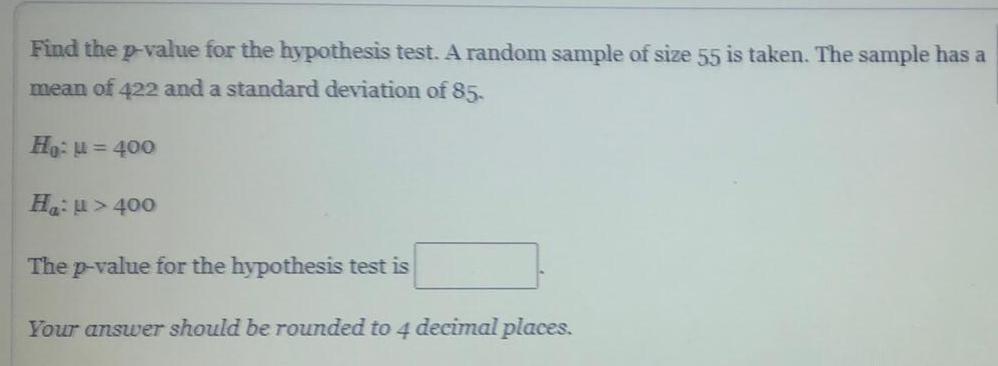
StatisticsFind the p-value for the hypothesis test. A random sample of size 55 is taken. The sample has a
mean of 422 and a standard deviation of 85.
Ho: µ = 400
Ha: µ >400
The p-value for the hypothesis test is
Your answer should be rounded to 4 decimal places.
Math
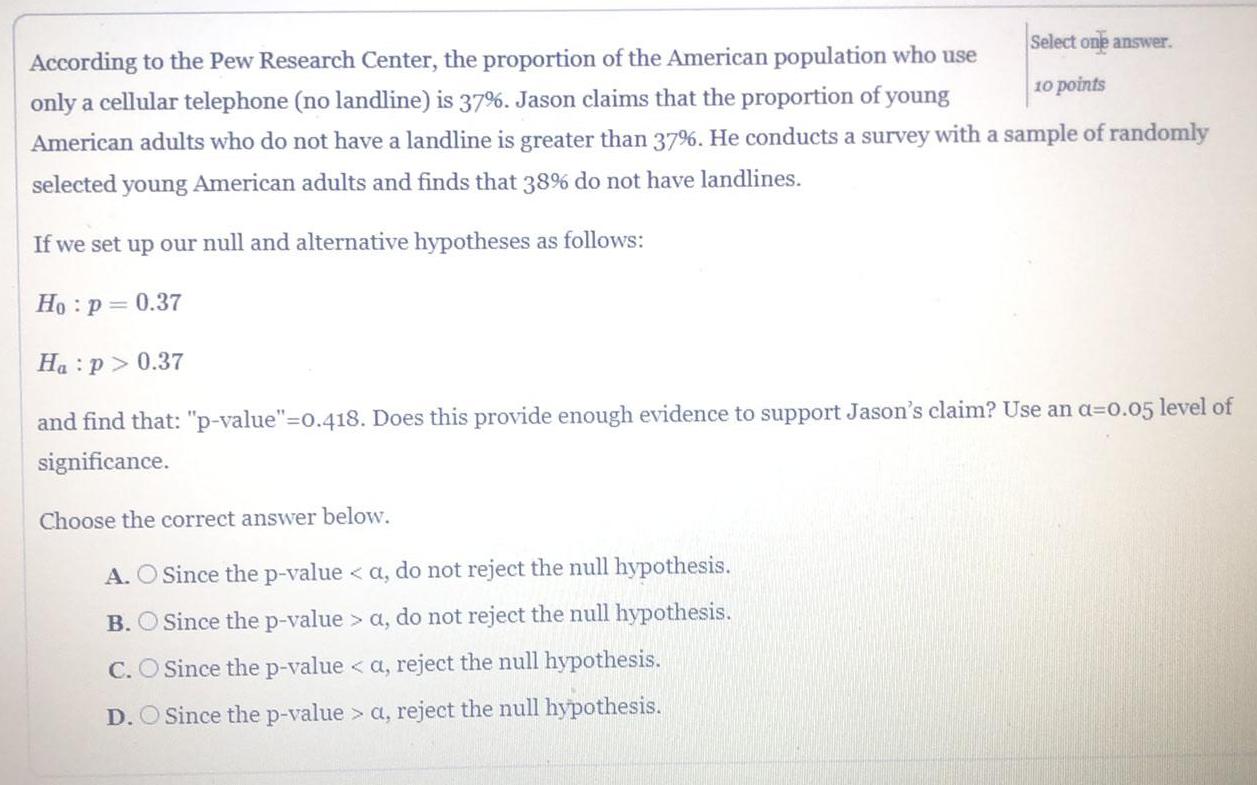
StatisticsAccording to the Pew Research Center, the proportion of the American population who use
only a cellular telephone (no landline) is 37%. Jason claims that the proportion of young
American adults who do not have a landline is greater than 37%. He conducts a survey with a sample of randomly
selected young American adults and finds that 38% do not have landlines.
If we set up our null and alternative hypotheses as follows:
Ho: p = 0.37
Ha:p> 0.37
and find that: "p-value"=0.418. Does this provide enough evidence to support Jason's claim? Use an a=0.05 level of
significance.
Choose the correct answer below.
A. O Since the p-value < a, do not reject the null hypothesis.
B. O Since the p-value > a, do not reject the null hypothesis.
C. O Since the p-value <a, reject the null hypothesis.
D. O Since the p-value > a, reject the null hypothesis.
Math
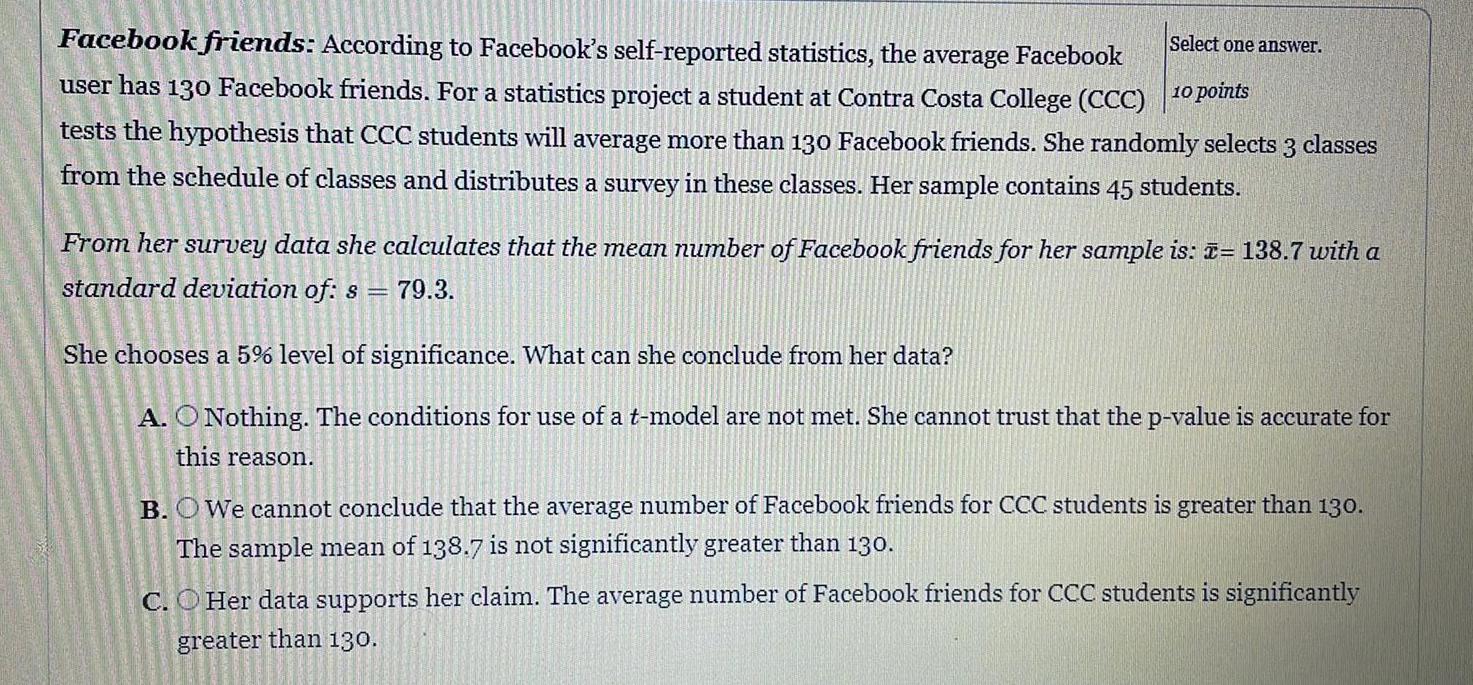
StatisticsFacebook friends: According to Facebook's self-reported statistics, the average Facebook
user has 130 Facebook friends. For a statistics project a student at Contra Costa College (CCC)
tests the hypothesis that CCC students will average more than 130 Facebook friends. She randomly selects 3 classes from the schedule of classes and distributes a survey in these classes. Her sample contains 45 students.
From her survey data she calculates that the mean number of Facebook friends for her sample is: - 138.7 with a standard deviation of: s = 79.3.
She chooses a 5% level of significance. What can she conclude from her data?
A. Nothing. The conditions for use of a t-model are not met. She cannot trust that the p-value is accurate for
this reason.
B. We cannot conclude that the average number of Facebook friends for CCC students is greater than 130.
The sample mean of 138.7 is not significantly greater than 130.
C. Her data supports her claim. The average number of Facebook friends for CCC students is significantly
greater than 130.
Math
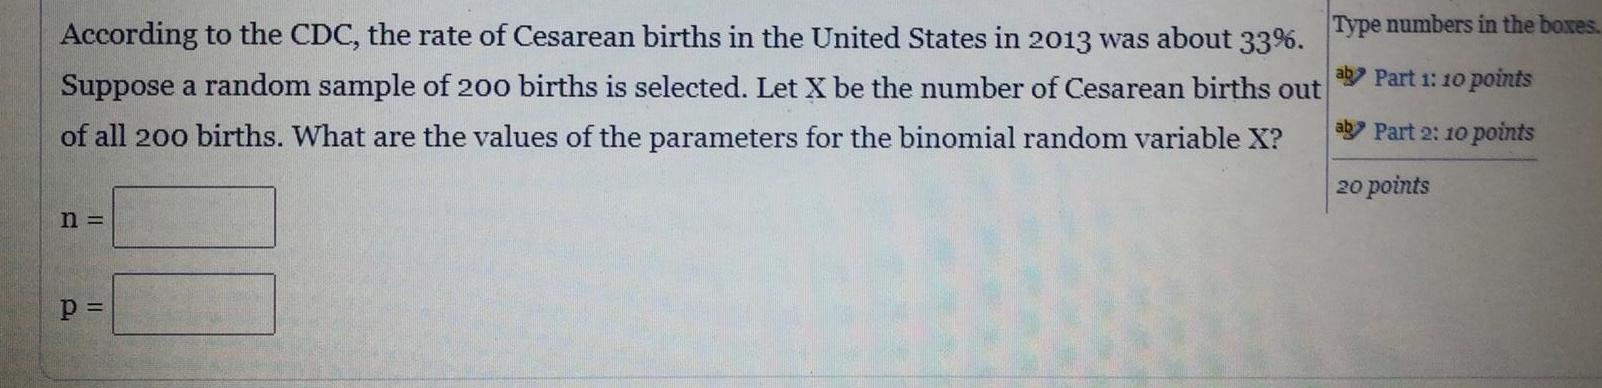
StatisticsAccording to the CDC, the rate of Cesarean births in the United States in 2013 was about 33%. Type numbers in the boxes.
ab P
Suppose a random sample of 200 births is selected. Let X be the number of Cesarean births out
of all 200 births. What are the values of the parameters for the binomial random variable X?
aby Part 2: 10 points
20 points
n =
p =
Math
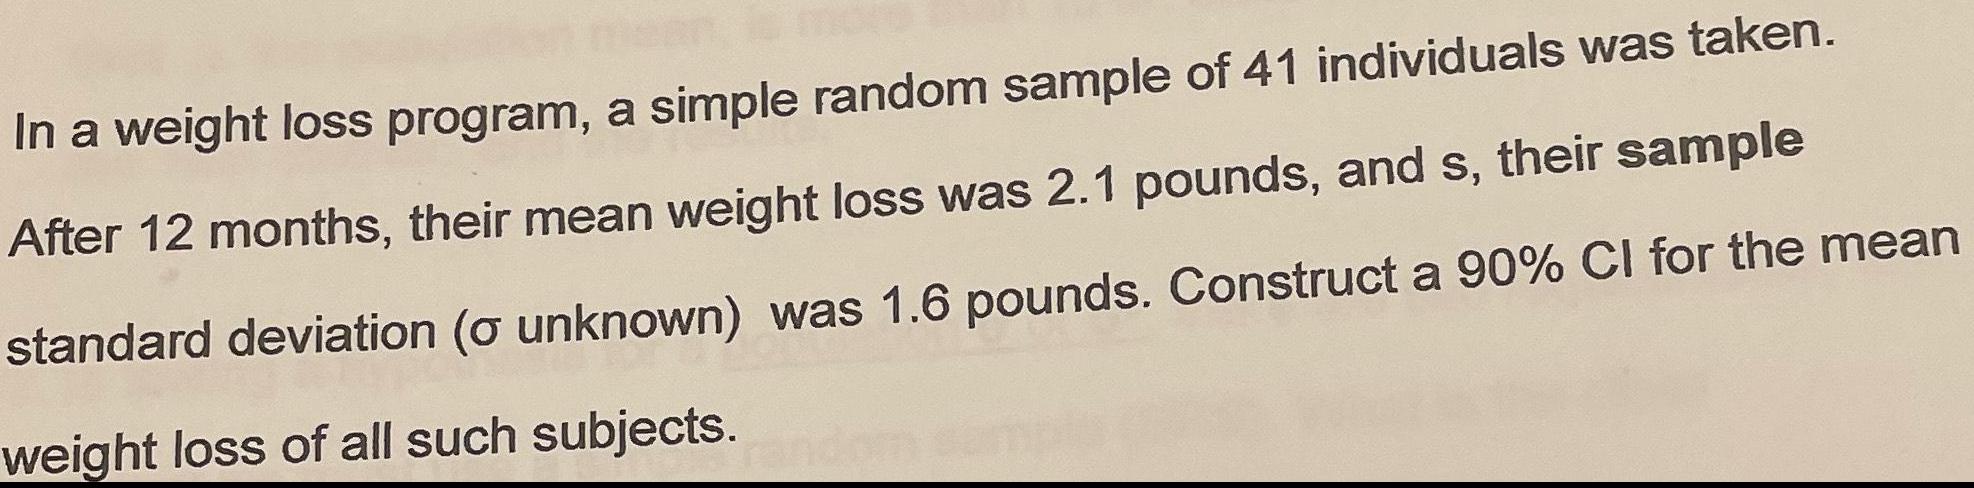
StatisticsIn a weight loss program, a simple random sample of 41 individuals was taken. After 12 months, their mean weight loss was 2.1 pounds, and s, their sample standard deviation (o unknown) was 1.6 pounds. Construct a 90% CI for the mean weight loss of all such subjects.
Math
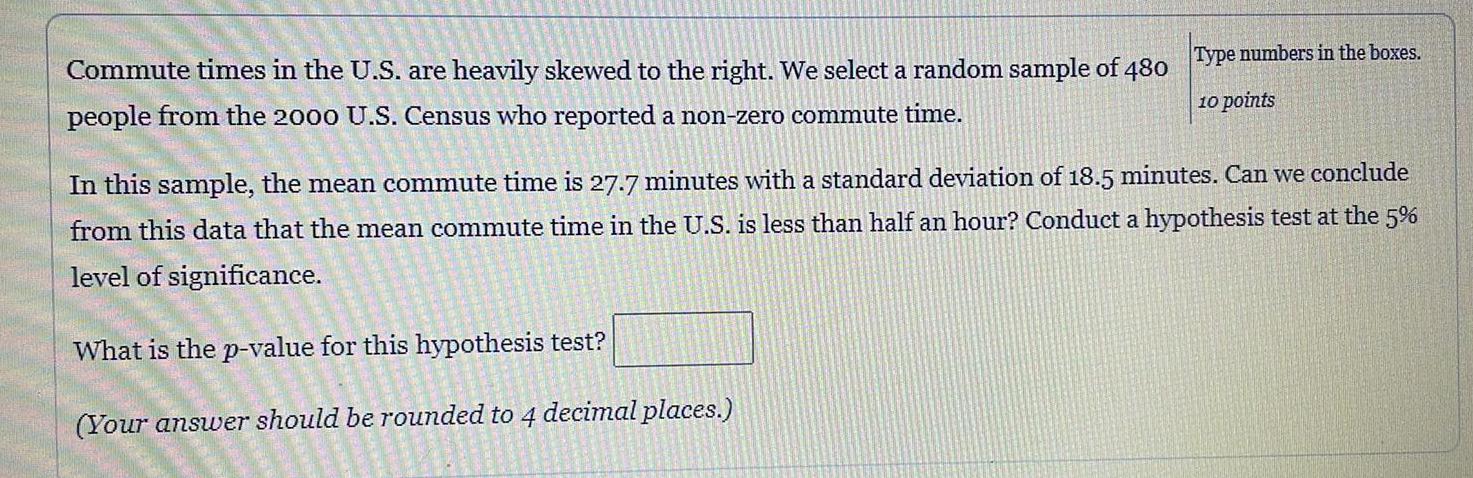
StatisticsCommute times in the U.S. are heavily skewed to the right. We select a random sample of 480 Type numbers in the boxes.people from the 2000 U.S. Census who reported a non-zero commute time.
In this sample, the mean commute time is 27.7 minutes with a standard deviation of 18.5 minutes. Can we conclude from this data that the mean commute time in the U.S. is less than half an hour? Conduct a hypothesis test at the 5% level of significance.
What is the p-value for this hypothesis test?
(Your answer should be rounded to 4 decimal places.)
Math
StatisticsGenetically modified foods: According to a 2016 Pew Research survey, a majority of the American general public (56%) says that genetically modified (GM) foods are generally unsafe to eat. This month, in a survey of 500 randomly selected American adults, 59% says that GM foods are generally unsafe to eat. We test the hypothesis that the percentage who says that GM foods are generally unsafe to eat is greater than 56% this year. The p-value is 0.087. Which of the following interpretations of this p-value is valid?
A. O There is an 8.7% chance that 56% of Americans says that GM foods are generally unsafe to eat.
B. O Assuming that more than 56% of Americans feel that GM foods are unsafe, the probability that 59% of 500 randomly selected Americans say that GM foods are generally unsafe to eat is 0.087.
C. O If we assume that 56% of Americans says that GM foods are generally unsafe to eat, then there is an 8.7% chance that random sample results will show 59% or more who says that GM foods are generally unsafe to eat.
Math
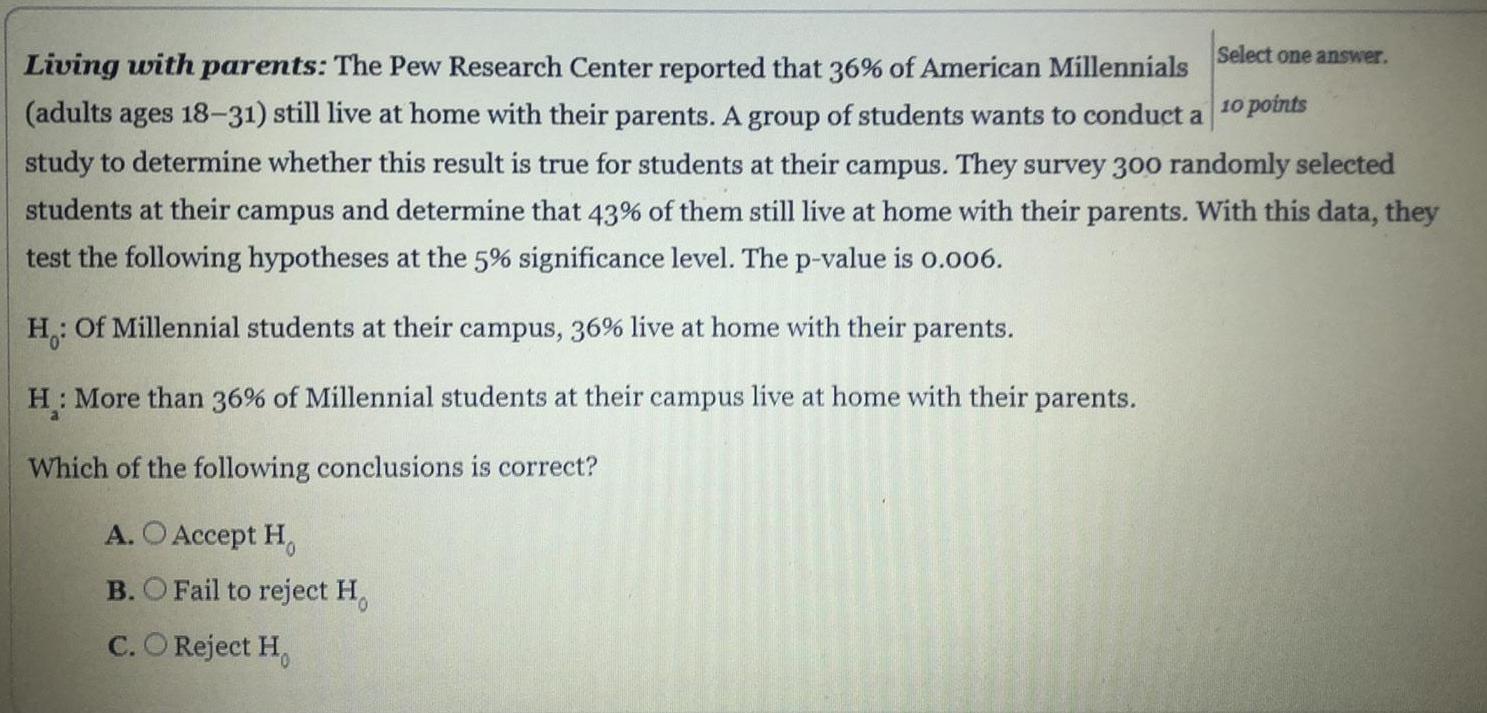
StatisticsLiving with parents: The Pew Research Center reported that 36% of American Millennials
(adults ages 18-31) still live at home with their parents. A group of students wants to conduct a
study to determine whether this result is true for students at their campus. They survey 300 randomly selected
students at their campus and determine that 43% of them still live at home with their parents. With this data, they
test the following hypotheses at the 5% significance level. The p-value is 0.006.
H0: Of Millennial students at their campus, 36% live at home with their parents.
Ha: More than 36% of Millennial students at their campus live at home with their parents.
Which of the following conclusions is correct?
A. Accept H
B. Fail to reject H
C. Reject Ho
Math
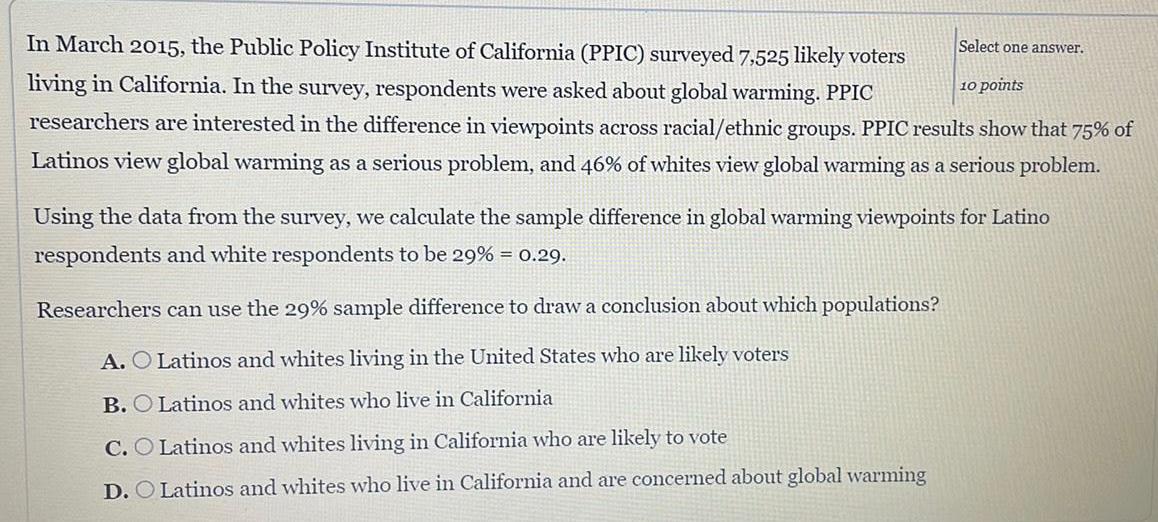
StatisticsIn March 2015, the Public Policy Institute of California (PPIC) surveyed 7,525 likely voters
living in California. In the survey, respondents were asked about global warming. PPIC
researchers are interested in the difference in viewpoints across racial/ethnic groups. PPIC results show that 75% of
Latinos view global warming as a serious problem, and 46% of whites view global warming as a serious problem.
Using the data from the survey, we calculate the sample difference in global warming viewpoints for Latino
respondents and white respondents to be 29% = 0.29.
Researchers can use the 29% sample difference to draw a conclusion about which populations?
A. Latinos and whites living in the United States who are likely voters
B. Latinos and whites who live in California
C. Latinos and whites living in California who are likely to vote
D. Latinos and whites who live in California and are concerned about global warming
Math
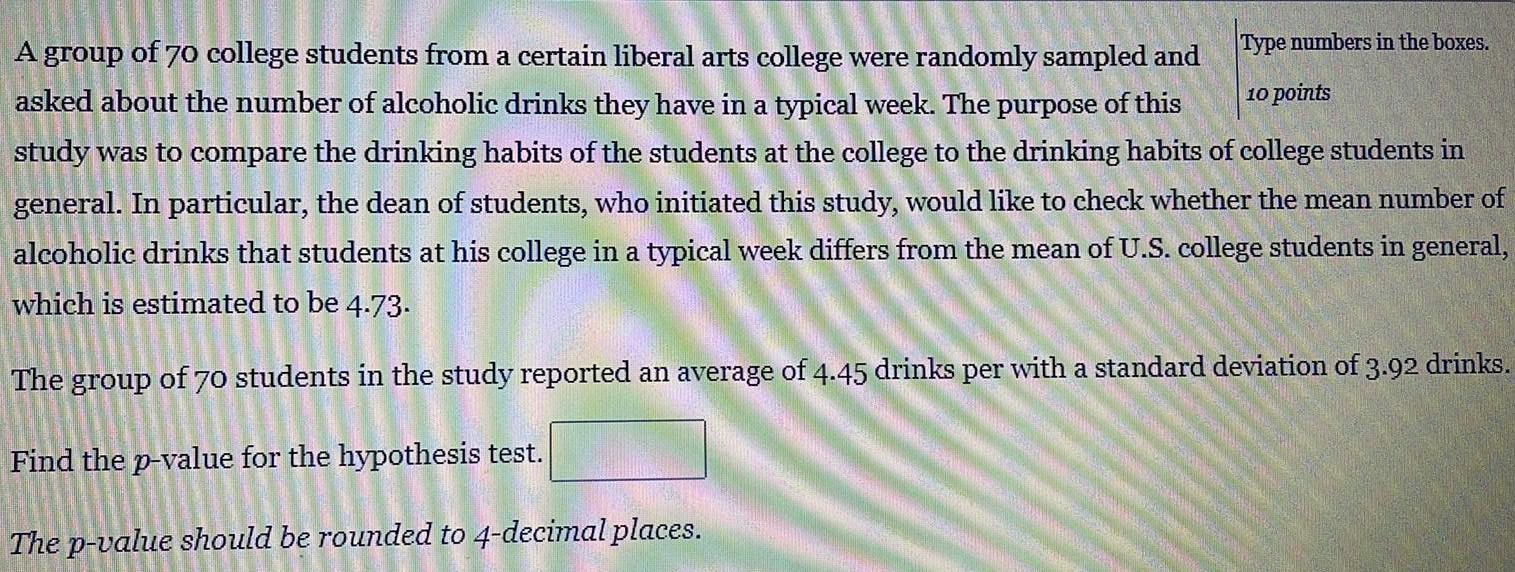
StatisticsA group of 70 college students from a certain liberal arts college were randomly sampled and
asked about the number of alcoholic drinks they have in a typical week. The purpose of this
study was to compare the drinking habits of the students at the college to the drinking habits of college students in
general. In particular, the dean of students, who initiated this study, would like to check whether the mean number of alcoholic drinks that students at his college in a typical week differs from the mean of U.S. college students in general, which is estimated to be 4.73.
The group of 70 students in the study reported an average of 4.45 drinks per with a standard deviation of 3.92 drinks.
Find the p-value for the hypothesis test.
The p-value should be rounded to 4-decimal places.
Math
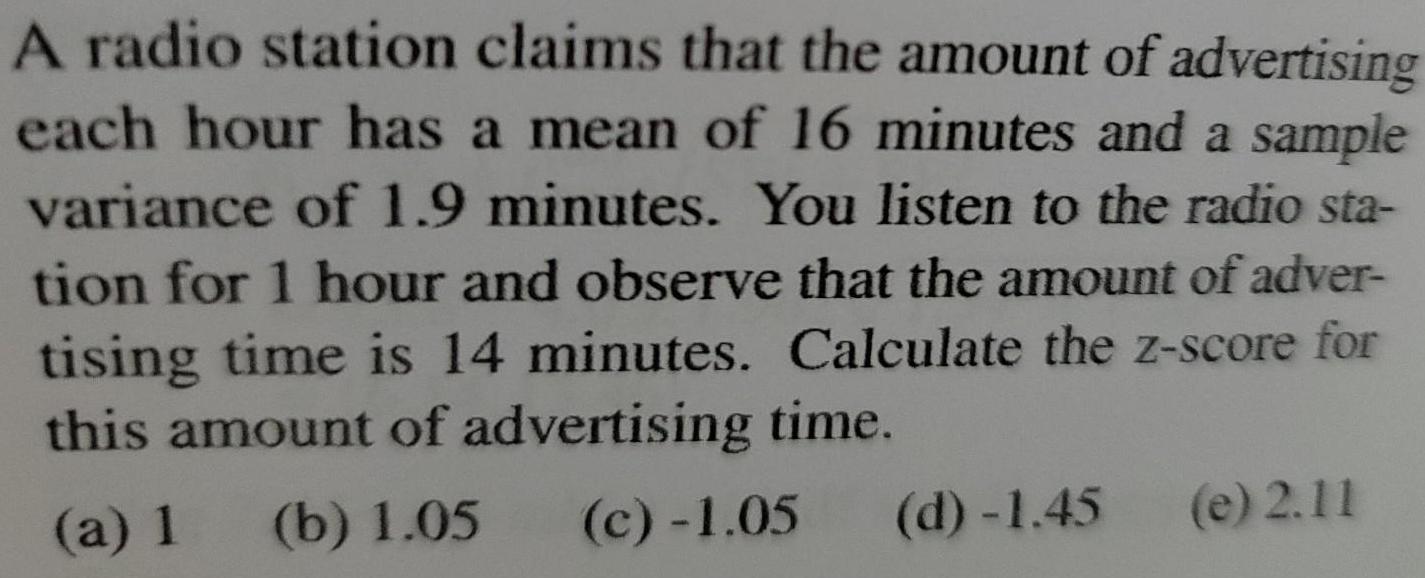
StatisticsA radio station claims that the amount of advertising each hour has a mean of 16 minutes and a sample variance of 1.9 minutes. You listen to the radio sta- tion for 1 hour and observe that the amount of adver- tising time is 14 minutes. Calculate the z-score for this amount of advertising time.
(a) 1 (b) 1.05 (c)-1.05 (d) -1.45 (e) 2.11

Math
StatisticsGerald had scores of 87, 99, 96, and 81 on four exams in his algebra class. What score will he need on his fifth exam to have an overall average of 81? (All exams have a maximum of 100 points.)
Math
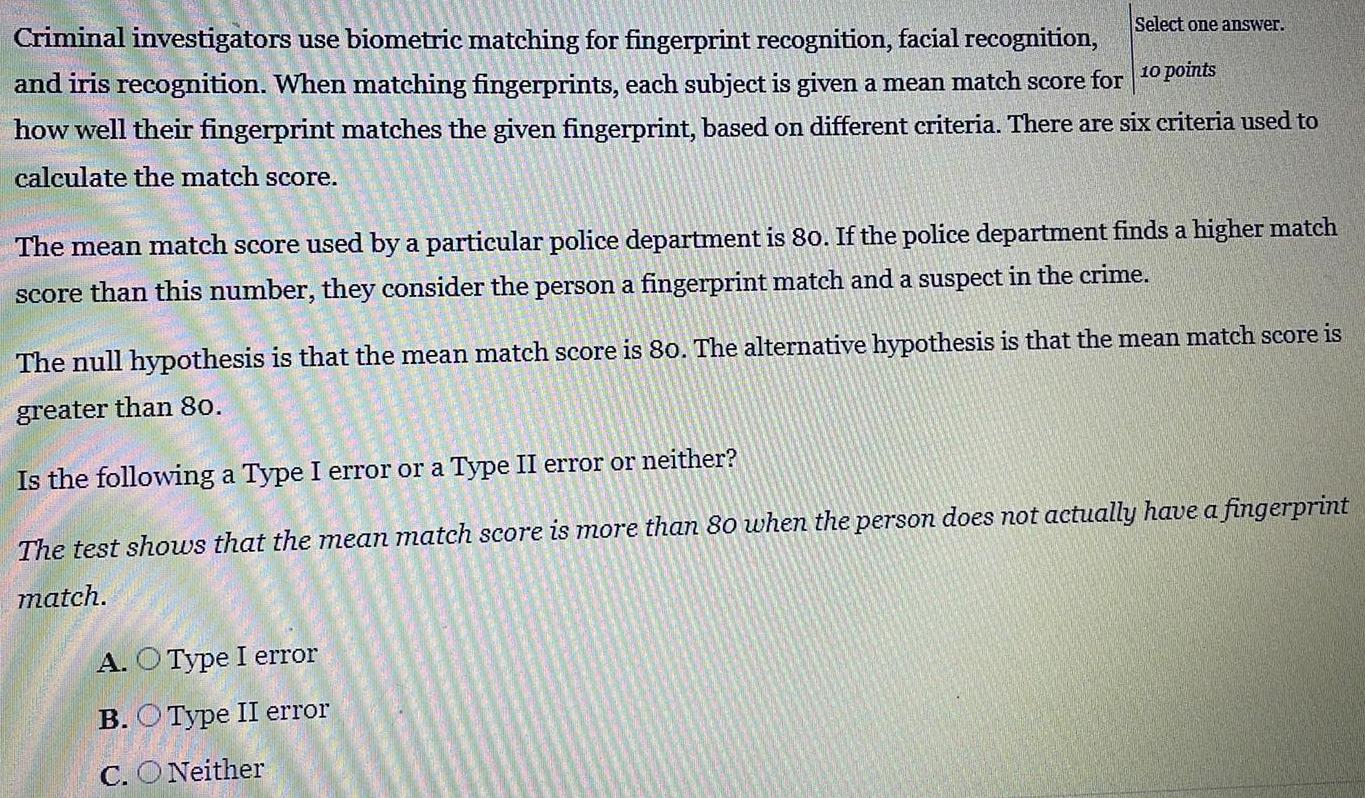
StatisticsCriminal investigators use biometric matching for fingerprint recognition, facial recognition,
and iris recognition. When matching fingerprints, each subject is given a mean match score for 10 points how well their fingerprint matches the given fingerprint, based on different criteria. There are six criteria used to calculate the match score.
The mean match score used by a particular police department is 80. If the police department finds a higher match
score than this number, they consider the person a fingerprint match and a suspect in the crime.
The null hypothesis is that the mean match score is 80. The alternative hypothesis is that the mean match score is greater than 80.
Is the following a Type I error or a Type II error or neither?
The test shows that the mean match score is more than 80 when the person does not actually have a fingerprint match.
A. Type I error
B. Type II error
C. Neither
Math
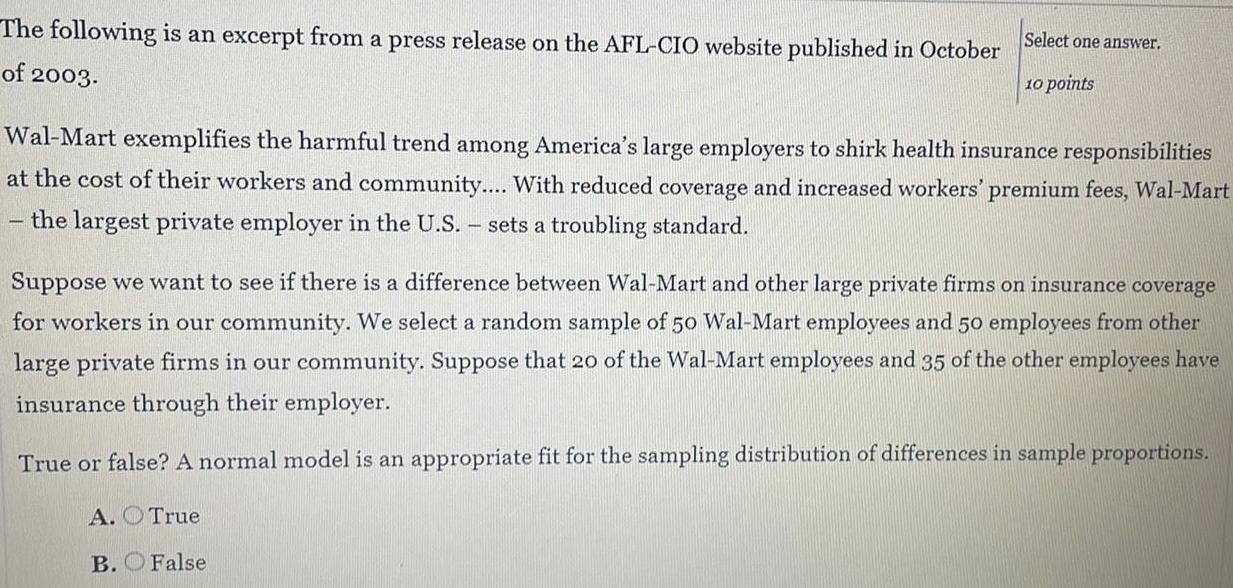
StatisticsThe following is an excerpt from a press release on the AFL-CIO website published in October
of 2003.
Wal-Mart exemplifies the harmful trend among America's large employers to shirk health insurance responsibilities
at the cost of their workers and community.... With reduced coverage and increased workers' premium fees, Wal-Mart
the largest private employer in the U.S. - sets a troubling standard.
Suppose we want to see if there is a difference between Wal-Mart and other large private firms on insurance coverage for workers in our community. We select a random sample of 50 Wal-Mart employees and 50 employees from other large private firms in our community. Suppose that 20 of the Wal-Mart employees and 35 of the other employees have insurance through their employer.
True or false? A normal model is an appropriate fit for the sampling distribution of differences in sample proportions.
A. True
B. False
Math
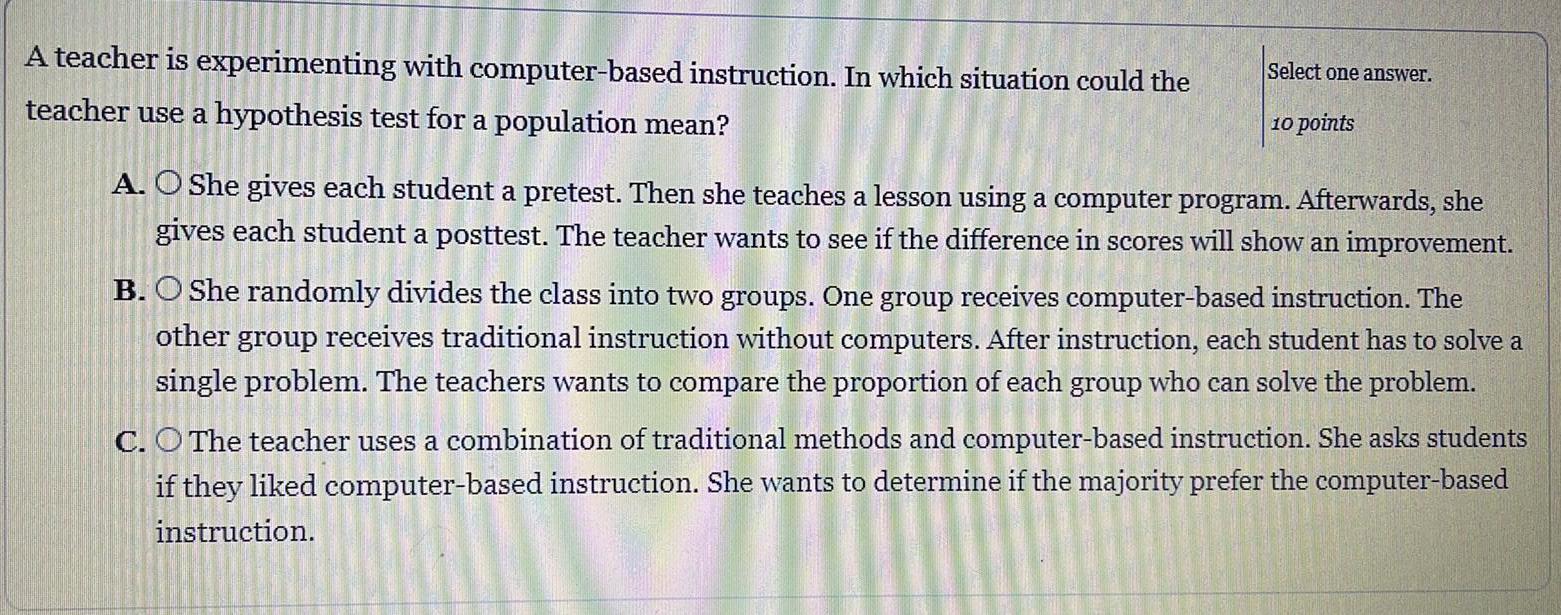
StatisticsA teacher is experimenting with computer-based instruction. In which situation could the
teacher use a hypothesis test for a population mean?
A. She gives each student a pretest. Then she teaches a lesson using a computer program. Afterwards, she
gives each student a posttest. The teacher wants to see if the difference in scores will show an improvement.
B. She randomly divides the class into two groups. One group receives computer-based instruction. The
other group receives traditional instruction without computers. After instruction, each student has to solve a
single problem. The teachers wants to compare the proportion of each group who can solve the problem.
C. The teacher uses a combination of traditional methods and computer-based instruction. She asks students
if they liked computer-based instruction. She wants to determine if the majority prefer the computer-based
instruction.
Math
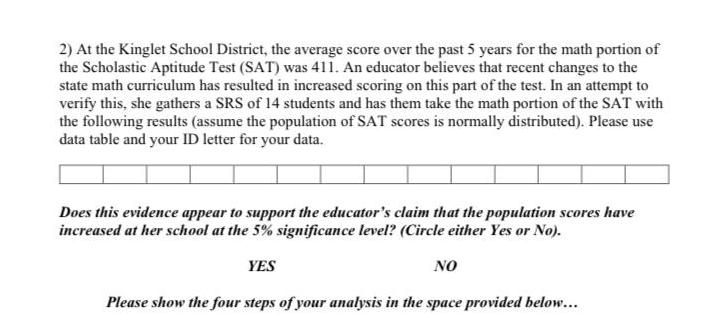
StatisticsAt the Kinglet School District, the average score over the past 5 years for the math portion of the Scholastic Aptitude Test (SAT) was 411. An educator believes that recent changes to the state math curriculum has resulted in increased scoring on this part of the test. In an attempt to verify this, she gathers a SRS of 14 students and has them take the math portion of the SAT with the following results (assume the population of SAT scores is normally distributed). Please use data table and your ID letter for your data. Does this evidence appear to support the educator's claim that the population scores have increased at her school at the 5% significance level? (Circle either Yes or No).
YES
NO
Please show the four steps of your analysis in the space provided below...
Math
StatisticsIf points on a scatterplot fall on a nearly-straight line that slopes downward, the two variables have
a) a strong positive correlation
b) a strong negative correlation
c) a weak positive correlation
d) a weak negative correlation
Math
StatisticsThe first quartile for wages at a coffee shop is $12.00 and the third quartile is $14.00. What
percentage of the workers make less than $14.00?
a) 20%
b) 25%
c) 50%
d) 75%
Math
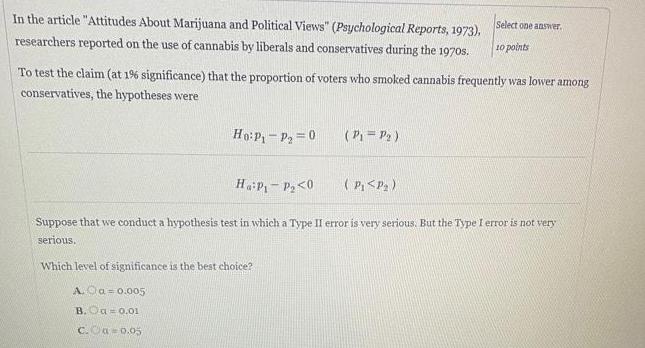
StatisticsIn the article "Attitudes About Marijuana and Political Views" (Psychological Reports, 1973), researchers reported on the use of cannabis by liberals and conservatives during the 1970s.
To test the claim (at 1% significance) that the proportion of voters who smoked cannabis frequently was lower among conservatives, the hypotheses were
H0: P₁ - P₂ = 0 (P₁ = P₂)
Ha:P₁-P₂<0 (P₁<P₂)
Suppose that we conduct a hypothesis test in which a Type II error is very serious. But the Type I error is not very serious.
Which level of significance is the best choice?
A. a=0.005
B. a=0.01
C. a = 0.05
Math
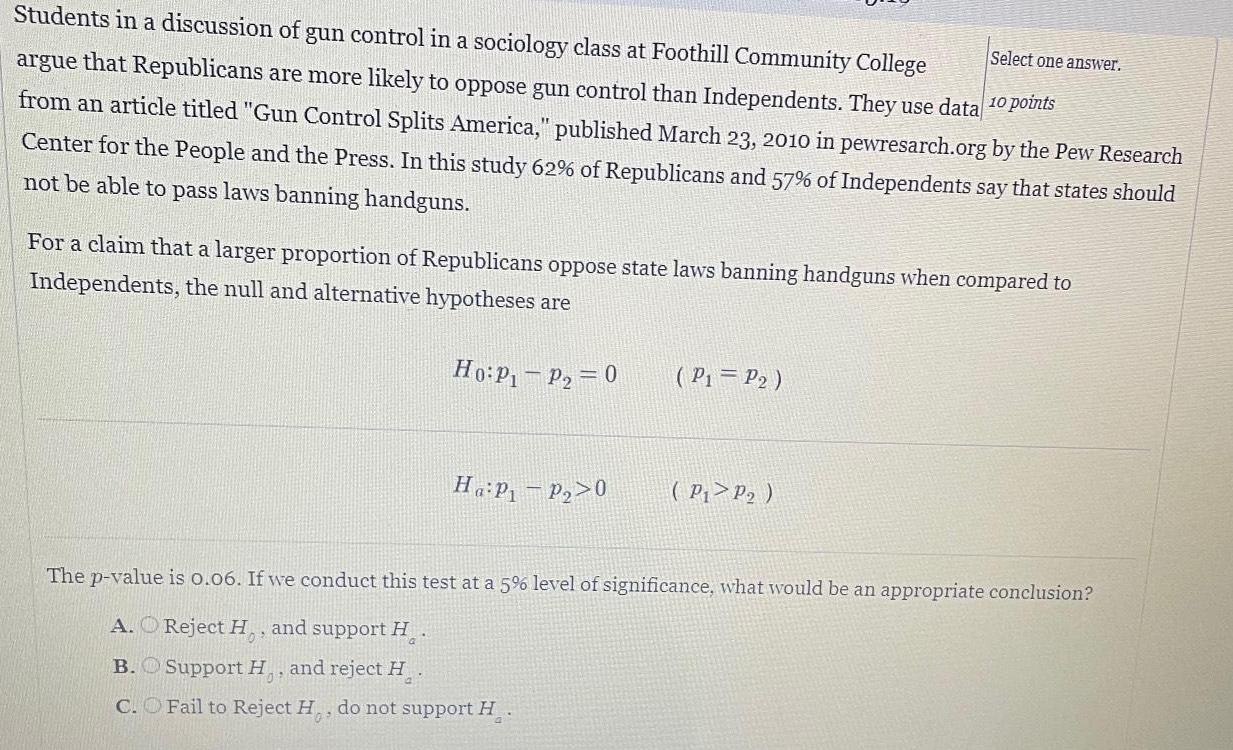
StatisticsStudents in a discussion of gun control in a sociology class at Foothill Community College argue that Republicans are more likely to oppose gun control than Independents. They use data from an article titled "Gun Control Splits America," published March 23, 2010 in pewresarch.org by the Pew Research Center for the People and the Press. In this study 62% of Republicans and 57% of Independents say that states should not be able to pass laws banning handguns.
For a claim that a larger proportion of Republicans oppose state laws banning handguns when compared to Independents, the null and alternative hypotheses are
H0: P₁ P₂ = 0
Ha:P₁ P₂0 (P₁ = P₂) . (P₁>P₂)
The p-value is 0.06. If we conduct this test at a 5% level of significance, what would be an appropriate conclusion?
A. Reject H0, and support Ha
B. Support H0, and reject Ha
C.Fail to Reject H0, do not support Ha.
Math
StatisticsTom is selling t-shirts and finds that if he sells them for d dollars each, he will sell S(d) t-shirts.
What is Tom's revenue if he sells his t-shirts for d dollars each?
Math
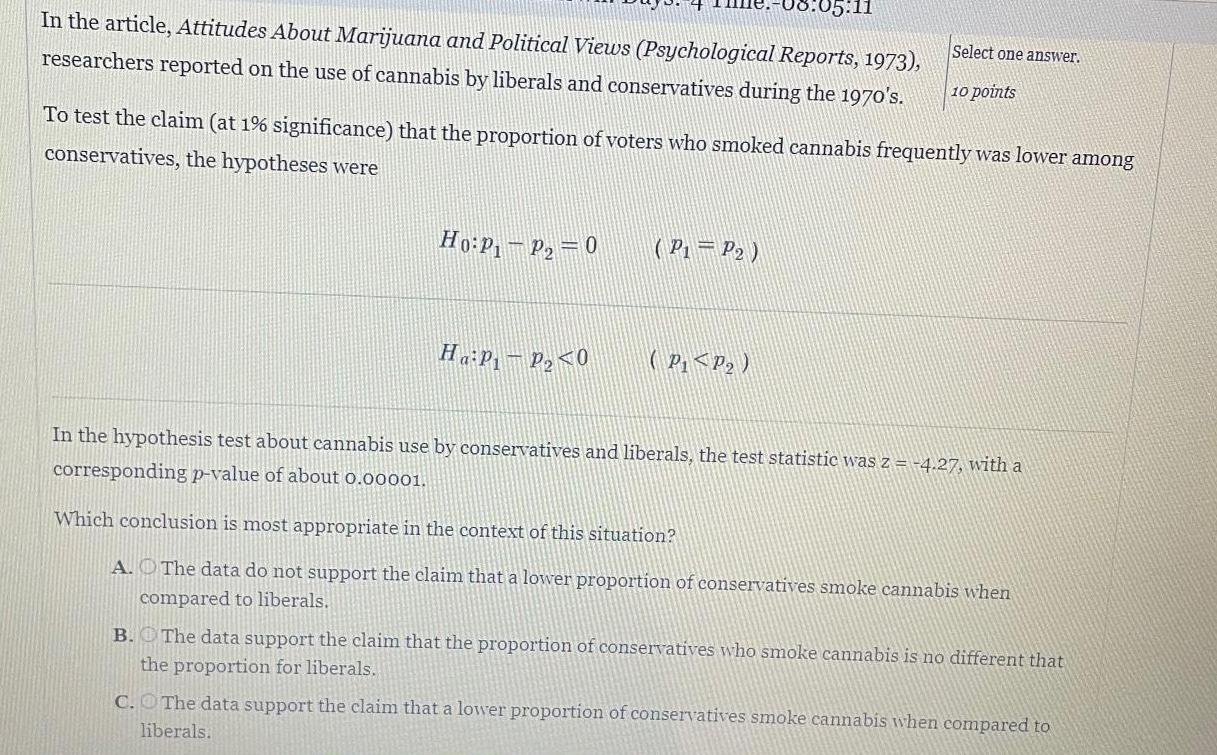
StatisticsTo test the claim (at 1% significance) that the proportion of voters who smoked cannabis frequently was lower among conservatives, the hypotheses were
Ho: P₁ P₂ = 0
Ha:P₁ – P₂ <0 (P₁-P2) (P₁<P₂)
In the hypothesis test about cannabis use by conservatives and liberals, the test statistic was z = -4.27, with a corresponding p-value of about 0.00001. Which conclusion is most appropriate in the context of this situation?
A. The data do not support the claim that a lower proportion of conservatives smoke cannabis when compared to liberals.
B. The data support the claim that the proportion of conservatives who smoke cannabis is no different that the proportion for liberals.
C. The data support the claim that a lower proportion of conservatives smoke cannabis when compared to liberals.
Math
StatisticsA tennis player keeps track of the number of balls he hits out of the court each game for four games. Here are his numbers: Game 1 15 balls out of the court, Game 2 = 21 balls out of the court, Game 3 = 5 balls out of the court, Game 4 = 51 balls out of the court. What is the average number of balls that he hits out of the court each game?
23
21
92
4
Math
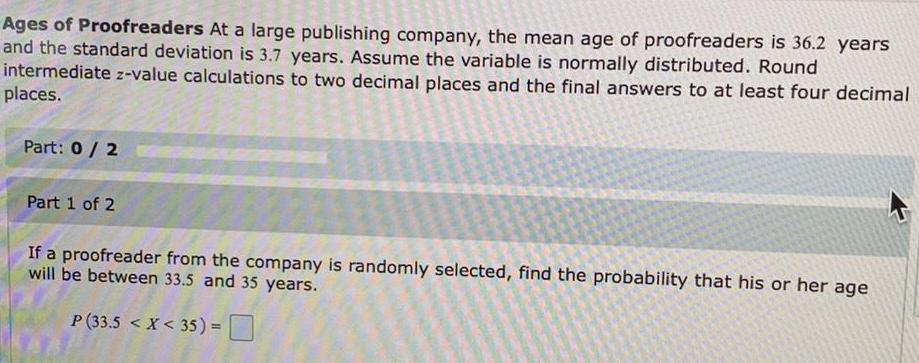
StatisticsAges of Proofreaders At a large publishing company, the mean age of proofreaders is 36.2 years and the standard deviation is 3.7 years. Assume the variable is normally distributed. Round intermediate z-value calculations to two decimal places and the final answers to at least four decimal places.
If a proofreader from the company is randomly selected, find the probability that his or her age
will be between 33.5 and 35 years.
P (33.5 < X < 35) =
Math
StatisticsScores on the GRE (Graduate Record Examination) are normally distributed with a mean of 537 and a standard deviation of 86. Use the 68-95-99.7 Rule to find the percentage of people taking the test who score between 451 and 623.
Math
StatisticsLast year's freshman class at Big State University totaled 5,310 students. Of those, 1,258 received a merit scholarship to help offset tuition costs their freshman year (although the amount varied per student). The amount a student received was M$3,457, $477) If the cost of full tuition was $4,450 last year, what percentage of students who received a merit scholarship did not receive enough to cover full tuition? (Round your answer to the nearest whole percent.) Percentage of students %
Math
StatisticsYou report a 95% confidence interval for a proportion as 53% 4%. Choose the most accurate statement below.
If you did this many times, 95% of the time the proportion you found would be between 49% and 57%.
If you did this many times, 95% of those times, the true population proportion would be the same as your sample proportion.
The true population proportion is 95%.
You are 95% sure that you did the arithmetic correctly.
If you did this many times, 95% of those times, the true population proportion would be within your confidence-interval.

Math
StatisticsA researcher wants to estimate the mean age of all Business Week readers at a 99% confidence level. She wants the margin of error to
be within 3.1 years of the population mean. The standard deviation of ages of all Business Week readers is 10.04 years. The sample size
that will yield a margin of error within 3.1 of the population mean is:
Math
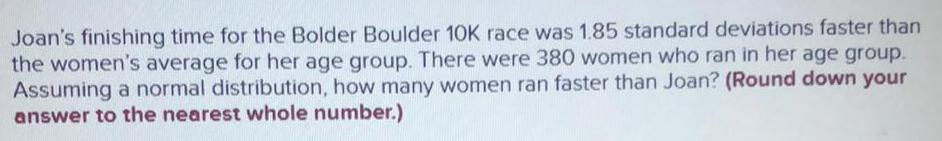
StatisticsJoan's finishing time for the Bolder Boulder 10K race was 1.85 standard deviations faster than the women's average for her age group. There were 380 women who ran in her age group. Assuming a normal distribution, how many women ran faster than Joan? (Round down your answer to the nearest whole number.)
Math
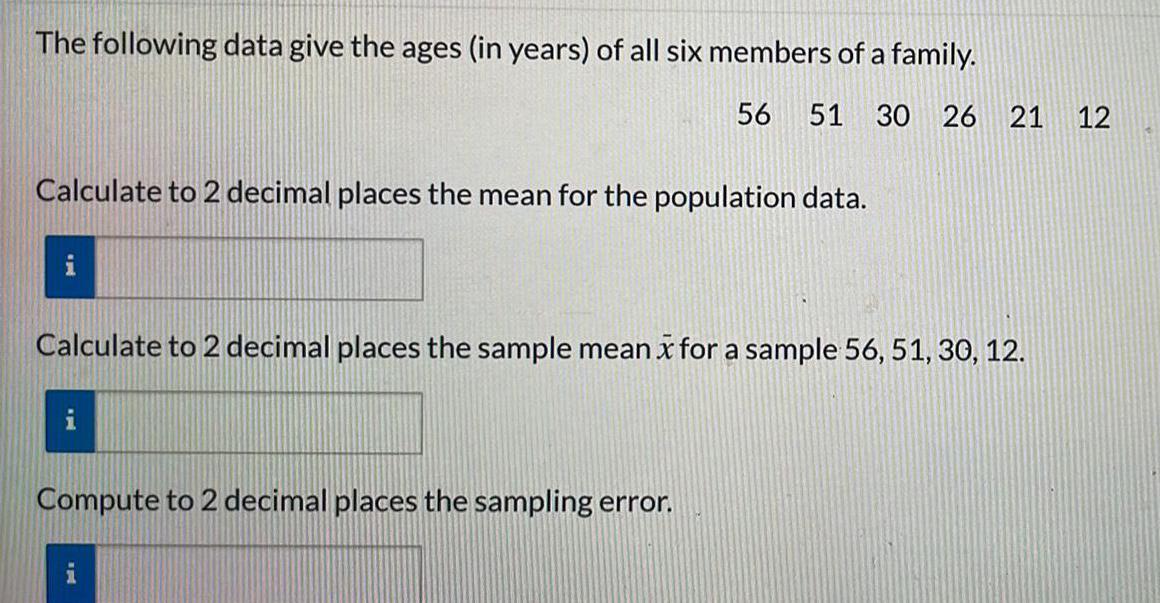
StatisticsThe following data give the ages (in years) of all six members of a family.
56 51 30 26 21 12
Calculate to 2 decimal places the mean for the population data.
Calculate to 2 decimal places the sample mean x for a sample 56, 51, 30, 12.
Compute to 2 decimal places the sampling error.
Math
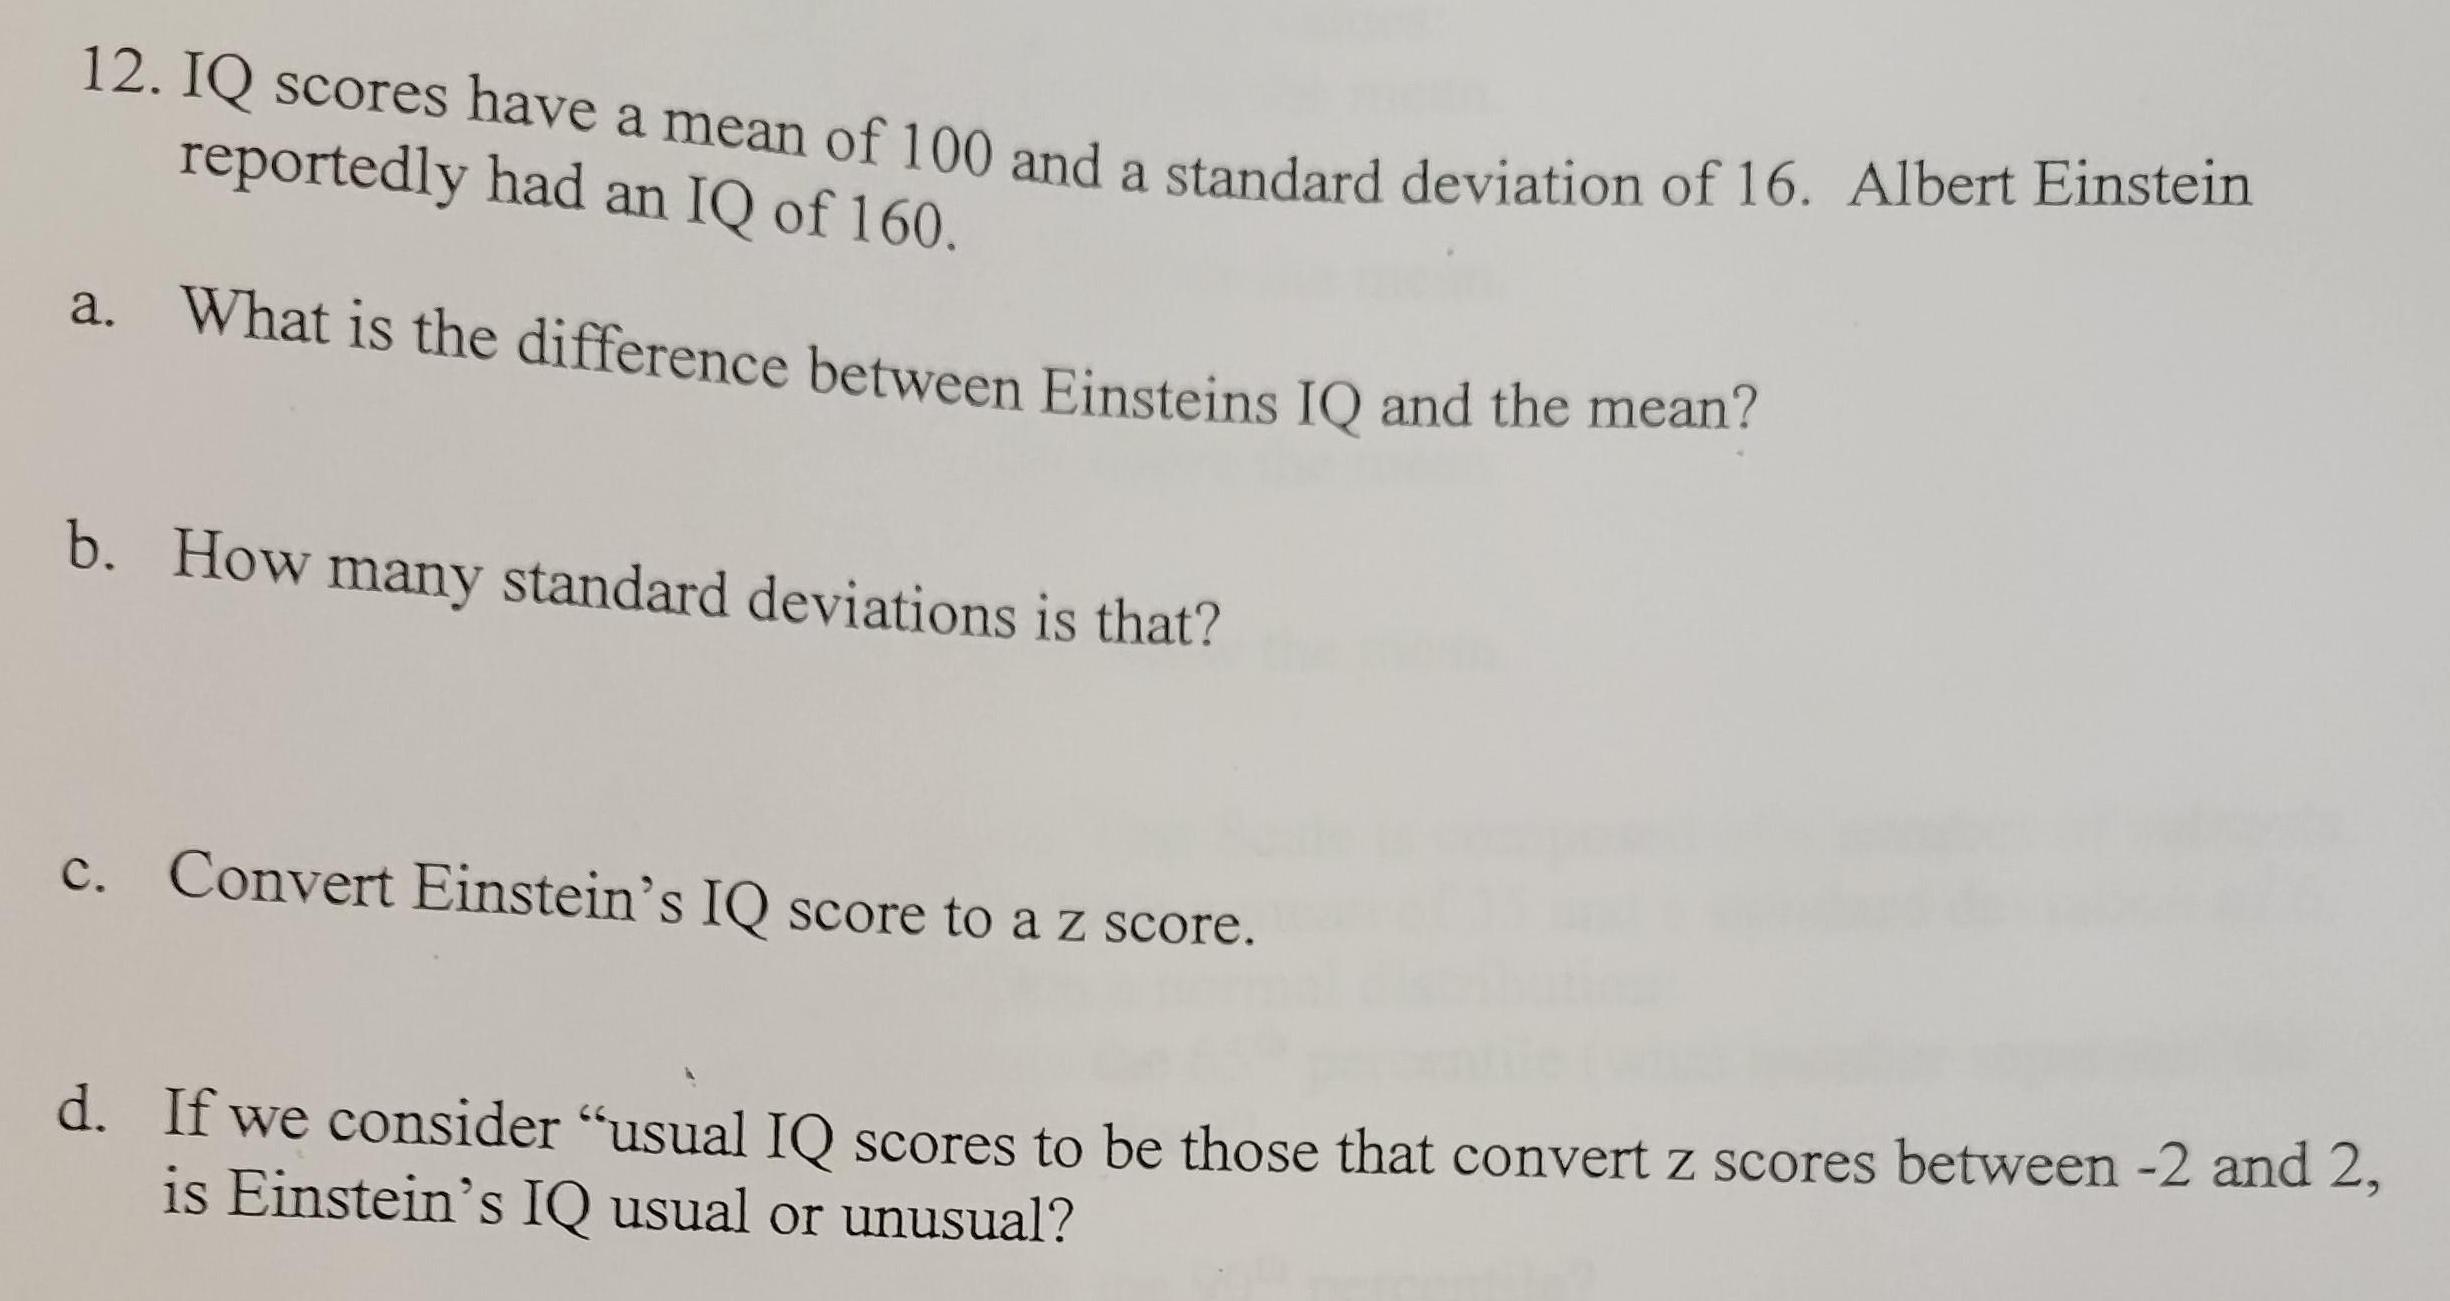
StatisticsIQ scores have a mean of 100 and a standard deviation of 16. Albert Einstein
reportedly had an IQ of 160.
a. What is the difference between Einsteins IQ and the mean?
b. How many standard deviations is that?
c. Convert Einstein's IQ score to a z score.
d. If we consider "usual IQ scores to be those that convert z scores between -2 and 2,
is Einstein's IQ usual or unusual?