Statistics Questions and Answers

Math
StatisticsCarter invested $3,900 in an account paying an interest rate of 3.9% compounded daily. Assuming no deposits or withdrawals are made, how much money, to the nearest hundred dollars, would be in the account after 5 years?

Math
StatisticsHeights of AHS Girls basketball team players are approximately normally distributed with a mean of 70 inches and a standard deviation of 2.5. If there were 175 players, how many had a height between 71 and 74 inches?

Math
StatisticsDescribe the sampling distribution of p. Assume the size of the population is 20,000.
n = 600, p=0.6
Choose the phrase that best describes the shape of the sampling distribution of p below.
A. Approximately normal because n≤0.05N and np(1-p)<10.
B. Not normal because n≤0.05N and np(1-p)≥10.
C. Not normal because n≤0.05N and np(1-p)<10.
D. Approximately normal because n≤0.05N and np(1-p)≥10.

Math
StatisticsSuppose a simple random sample of size n = 81 is obtained from a population that is skewed right with µ=73 and σ=9.
(a) Describe the sampling distribution of x.
(b) What is P (x>74.1)?
(c) What is P (x≤70.55) ?
(d) What is P (72.15<x<74.85)?

Math
StatisticsA concrete mix is designed to withstand 3000 pounds per square inch (psi) of pressure. The following data represent the strength of nine randomly selected casts
3960, 4090, 3200, 3200, 2950, 3830, 4100, 4040, 3570
Compute the mean, median and strength of the concrete (in psi).

Math
StatisticsSuppose that a set of test scores is normally distributed with mean 55 and standard deviation 22. What is the probability that score pulled at random is less than 48.4? Express your answer rounded correctly to the thousandths place.

Math
StatisticsThe effectiveness of a blood-pressure drug is being investigated. An experimenter finds that, on average, the reduction in systolic blood pressure is 48.7 for a sample of size 981 and standard deviation 17.6. Estimate how much the drug will lower a typical patient's systolic blood pressure (using a 80% confidence level).

Math
StatisticsThe expected value when you purchase a lottery ticket is - $2.00 and the cost of the ticket is $8.00. Determine the fair price of the lottery ticket.

Math
StatisticsDetermine the area under the standard normal curve that lies between (a) Z=-1.02 and Z=1.02, (b) Z= -0.36 and Z=0, and (c) Z=-2.19 and Z=0.64.

Math
StatisticsProfessor Ivy's students have a mean class grade of 68 with a standard deviation of 3.5.
Express your answers rounded correctly to the hundredths place.
A. If Isabel has a grade of 70.8 in the class, what would be the z-score for Isabel's grade?
Z-score= =
B. Into which percentile does Isabel's grade place her?
Round the Percentile to the nearest whole number.
Percentile =

Math
StatisticsYou can insert Desmos graphs or hand-drawn graphs.
Draw a normal curve representation for the area, then write the numerical value of the area under the normal curve for each of the following.
A) All values below the mean
B) All values to the left of z=-2.17

Math
StatisticsIn a survey, 32 people were asked how much they spent on their child's last birthday gift. The results were roughly bell-shaped with a mean of $33 and standard deviation of $4. Construct and interpret a 90% confidence interval.

Math
StatisticsThe following data represents the body
temperature in degrees Fahrenheit of randomly selected
adults:
99.5, 98, 99.9, 98.5, 99.2, 100.2, 99, 100.3, 98.8, 98.3
Use Excel to compute the values indicated below.
Express your answers rounded to the nearest tenth.
Use the 68-95-99.7 Rule to answer the following
question.
What is the probability, in decimal form, of a body
temperature less than 99.2 ?
Express your answer rounded to four decimal places.
you haven't answered the question correctly in 3
attempts, you can get a hint.

Math
StatisticsYou want to know if smoking rates are different in your state (call this population 1) and your sister's state (call this population 2). Test this at the 5% level of significance. Suppose that random samples showed that 90 of 500 in your state were smoker's and 70 out of 500 in your sister's state were smokers.

Math
StatisticsThe following data set represents weights
measured in grams of randomly selected MnM plain
candies:
0.946, 0.9, 0.868, 0.943, 0.925, 0.902
0.851, 0.858, 0.886, 0.948, 0.85
Use Excel to compute the values indicated below.
Express your answers rounded to the nearest
thousandth.
Use the 68-95-99.7 Rule to answer the following
question.
What is the probability, as a decimal, of a weight more
than 0.822 ?
Express the probability as a decimal with four places.

Math
StatisticsThe average IQ score is 100 points with a standard deviation of 15 points. Jenny says that her IQ is in the 44th percentile. Use this information and a z-table to approximate Jenny's IQ. Express your answer rounded correctly to the nearest whole point.


Math
StatisticsA researcher is interested in determining whether there is a relationship between price and quantity demanded for her firm.

Math
StatisticsChoose all of the statistical questions.
How many texts a day do most high school students
send?
How many texts did you send today?
On average, how old are college graduates?
When is your birthday?

Math
StatisticsA normally distributed data set has a mean of 0 and a standard deviation of 2. Which of the following is closest to the percent of values between -4.0 and 2.0?
2.3%
81.9%
50%
84.1%

Math
StatisticsA set of data has a normal distribution with a mean of 50 and a standard deviation of 10.
Draw a normal distribution to model these data and find the percent of data within each
interval.
A. All values between 50 to 60.
B. All values less than 30.
C. All values NOT between 40 and 50

Math
StatisticsDraw a normal curve representation for the area, then write the numerical value of the
area under the normal curve for each of the following.
A) All values to the right of z=2.86
B) All values Not between -1.09 and 0.16 standard deviations from the mean. (hint: if
you use Desmos, you will need to create two graphs)

Math
StatisticsWattage Good Defective Total
A quality control inspector is checking a sample of light bulbs. The table summarizes her results. If one of the light bulbs is selected at random, find the probability that the light bulb is defective, given that it is a
50 or 100 watt bulb.
The probability is

Math
StatisticsHow would you interpret a statistical significance level of 0.48?
This means that the probability for the null hypothesis to be false is 0.48.
This means that the probability for the null hypothesis to be true is 0.48.
This means that the probability for the alternate hypothesis to be true is (1 -0.48).
This means that the probability for the alternate hypothesis to be false is (1 -0.48).

Algebra
StatisticsJalen scored 82 in a recent golf tournament. If the mean score in the tournament was 71 with a standard deviation of 3.9, what is Jalen's Z-score? Round to the nearest hundredth.

Math
StatisticsWhat is the purpose of constructing a confidence interval?
In order to find the exact sample proportion.
In order to find a range of values to estimate the population proportion.
In order to find a range of values to estimate the sample proportion.
To find the exact value of the population proportion.

Math
StatisticsThe length of human pregnancies varies normally with a mean of 266 days and a standard deviation of 16 days. What percentage of pregnancies last between 234 and 298 days?
75%
68%
95%
99.7%

Math
StatisticsThe population in a city is 356,902 people.
If this city sees a decline in the population at a rate of 1.4% per year, find the new population after 25 years.
A. 250, 883 B. 351,905 C. 277,037 D. 269,001

Math
StatisticsAn amusement park would like to determine if they want to add in a new roller
coaster. In order to decide whether or not they should add the new roller coaster,
they poll people at the park to see how many rode the current roller coaster.
• As people are leaving the park they randomly sample 600 people.
• Out of the 600 people, 400 rode the roller coaster at the park.
Construct a 90% confidence interval to represent the proportion of riders who
rode the roller coaster at the park. All conditions for inference have been met.

Math
StatisticsA cell phone carrier claims that 90% of customers are very satisfied with the service
they receive. The local paper thinks the true proportion is lower and decides to test
the claim, they surveyed 100 customers using a simple random sampling. Among the
sampled customers, 79% percent say they are very satisfied. What is an appropriate
null and alternative hypothesis?
Hx: p = 79
H.: p <.79
OH, p = 9
H.: p<.9
Hx p = .79
H₂:p>.9
Ho: p= .9
H.:p>.9

Math
StatisticsA company claims that 9% of the items produced on a new
machine are defective.
The factory will get rid of the machine if the data indicates that the proportion of defective items is more than 9%.
They take a random sample of 300 items and 50 are defective.
What null hypothesis is appropriate?
Ho: p>0.09
Ho: p=0.17
Ho: p<0.09
Ho: p=0.09

Math
StatisticsA sample of 500 items produced on a new machine showed that 28 of them are
defective. The factory will get rid of the machine if the data indicates that the
proportion of defective items is significantly more than 5%. At a significance level of
10% does the factory get rid of the machine or not?
No. there is not enough evidence to suggest getting rid of the machine
Yes, there is enough evidence to suggest getting ride of the machine

Math
StatisticsA grocery store would like to determine whether or not they should continue to sell shortbread cookies.
They take a random sample of 550 customers.
30% of the customers purchase shortbread cookies.
Construct a 95% confidence interval to estimate the proportion of customers that
purchase shortbread cookies. All conditions for confidence intervals have been met.
(0.28, 0.320)
(0.261, 0.338)
(0.20, 0.40)
(0.25, 0.35)

Math
StatisticsWhen constructing a 99% confidence interval which of the following is true?
If you construct 100 intervals, 99 of the intervals will NOT contain the population proportion.
When you construct the confidence interval you are sure you have created an interval that will
capture the population proportion.
If you construct 100 intervals, 99 of the intervals will contain the population proportion.
Because the confidence level is so high, we used the population proportion to construct the
confidence interval instead of the sample proportion.

Math
StatisticsThe number of books in a small library increases according to the function B = 7,500 e 0.05t, where t is measured in years. How many books will the library have after
4 years? Round to the nearest book.
A. 7,885 books
B. 11,887 books
C. 9,161 books
D. 6,140 books
Math
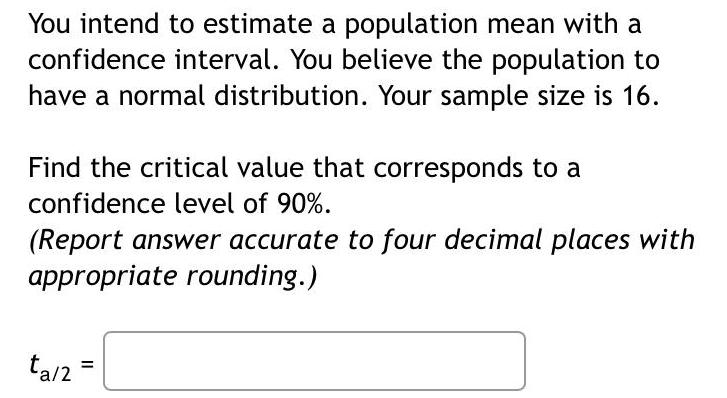
StatisticsYou intend to estimate a population mean with a confidence interval. You believe the population to have a normal distribution. Your sample size is 16. Find the critical value that corresponds to a confidence level of 90%.
Math
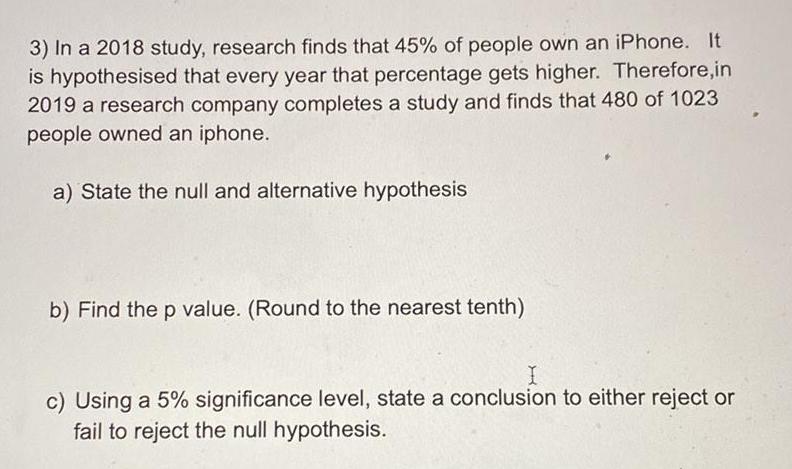
StatisticsIn a 2018 study, research finds that 45% of people own an iPhone. It is hypothesised that every year that percentage gets higher. Therefore,in 2019 a research company completes a study and finds that 480 of 1023
people owned an iphone.
a) State the null and alternative hypothesis
b) Find the p value. (Round to the nearest tenth)
c) Using a 5% significance level, state a conclusion to either reject or fail to reject the null hypothesis.
Math
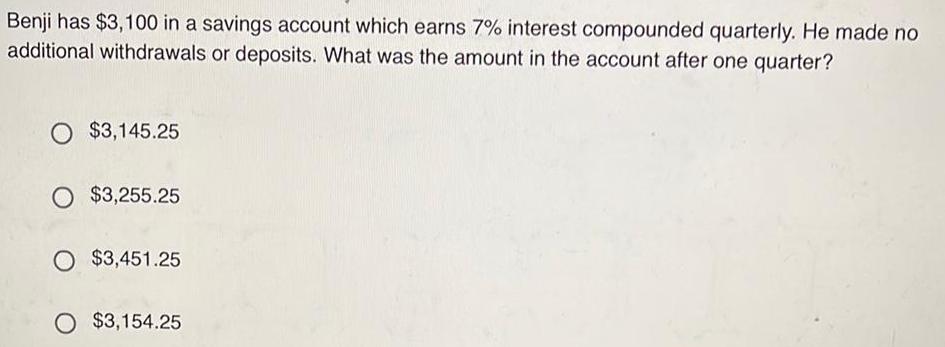
StatisticsBenji has $3,100 in a savings account which earns 7% interest compounded quarterly. He made no
additional withdrawals or deposits. What was the amount in the account after one quarter?
O $3,145.25
O $3,255.25
O $3,451.25
O $3,154.25
Math
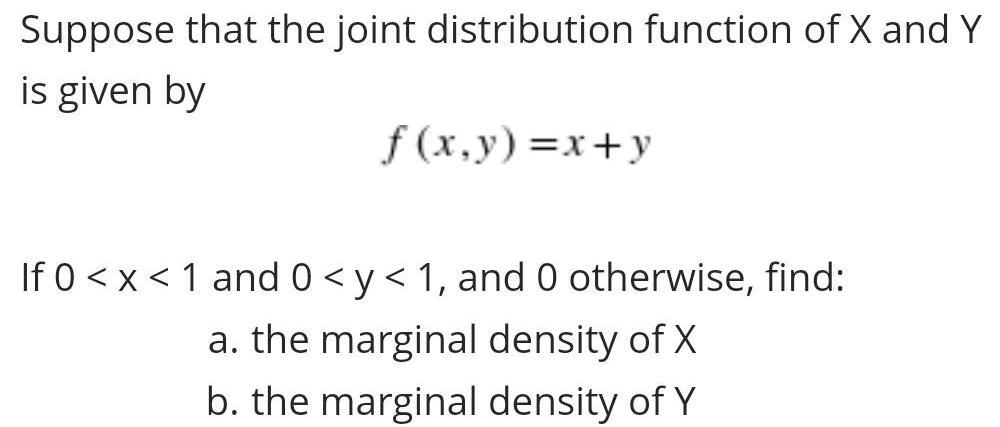
StatisticsSuppose that the joint distribution function of X and Y
is given by
f(x,y)=x+y
If 0<x< 1 and 0 <y< 1, and 0 otherwise, find:
a. the marginal density of X
b. the marginal density of Y

Math
StatisticsThe weights (to the nearest five pounds) of 34 randomly selected male college students are organized in the histogram. Use the graph to find the median weight.

Math
StatisticsTyler is investigating how long his phone's battery lasts (in hours) for various brightness levels (on a scale of 0-100). His data is displayed in the table and graph below.

Math
StatisticsSuppose a survey of 551 women in the United States found that more than 63% are the primary investor in their household. Which part of the survey represents the descriptive branch of statistics? Make an inference based on the results of the survey.
Choose the best statement of the descriptive statistic in the problem.
A. 63% of women in the sample are the primary investor in their household.
B. There is an association between the 551 women and being the primary investor in their household.
C. There is an association between U.S. women and being the primary investor in their household.
D. 551 women were surveyed.
Choose the best inference from the given information.
A. There is an association between the 551 women and being the primary investor in their household.
B. 63% of women in the sample are the primary investor in their household.
C. There is an association between U.S. women and being the primary investor in their household.
D. 551 women were surveyed.

Math
StatisticsA random sample of 225 observations were selected from a population with a mean μ = 20 and variance σ2 = 144.
Find mean and standard deviation of the sampling distribution of the sample mean.
mean = 20, s.d. = 12
mean = 20, s.d. = 0.64
mean = 0.9, s.d. = 0.8
mean = 20, s.d. = 0.8
mean = 0.9, s.d. = 12

Math
StatisticsThe null and alternative hypotheses are given. Determine whether the hypothesis test is left-tailed, right-tailed, or two-tailed. What parameter is being tested? Ho: 0 = 5 H₁: 0 # 5 What type of test is being conducted in this problem? Left-tailed test Right-tailed test Two-tailed test

Math
StatisticsDescribe the sampling distribution of p. Assume the size of the population is 30,000.
n=1300, p=0.288
Describe the shape of the sampling distribution of p. Choose the correct answer below.
A. The shape of the sampling distribution of p is approximately normal because n ≤0.05N and np(1-p) ≥ 10.
B. The shape of the sampling distribution of p is not normal because n ≤0.05N and np(1-p) ≥ 10.
C. The shape of the sampling distribution of p is approximately normal because n ≤0.05N and np(1-p) < 10.
D. The shape of the sampling distribution of p is not normal because n ≤0.05N and np(1-p) < 10.

Math
StatisticsBelow is a sample of share prices (in dollars) for a particular stock, selected at random over several years:
242 253 261 269 271 235 240 242 230
259 243 242 274 255 232 259 230 273
Use Excel (or other form of electronic assistance) to find the mean, median, mode, and standard deviation for this sample. Round answers to the nearest tenth.
Mean =
Median =
Mode =
Standard Deviation =
Using the Empircal Rule, what percent of values would be 235.4 or less?
%
What percent of values would be 281 or more?
%
If you haven't answered the question correctly in 3 attempts, you can get a hint.

Math
StatisticsA research center claims that 31% of adults in a certain country would travel into space on a commercial flight if they could afford it. In a random sample of 1000 adults in that country, 35% say that they would travel into space on a commercial flight if they could afford it. At a = 0.01, is there enough evidence to reject the research center's claim? Complete parts (a) through (d) below.
(a) Identify the claim and state Ho and Ha
Identify the claim in this scenario. Select the correct choice below and fill in the answer box to complete your choice.
(Type an integer or a decimal. Do not round.)
A. % of adults in the country would travel into space on a commercial flight if they could afford it.
B. The percentage adults in the country who would travel into space on a commercial flight if they could afford it is not
C. At least % of adults in the country would travel into space on a commercial flight if they could afford it.
D. No more than % of adults in the country would travel into space on a commercial flight if they could afford it.
Let p be the population proportion of successes, where a success is an adult in the country who would travel into space on a commercial flight if they could afford it. State Ho and H₂. Select the correct choice below and fill in the answer boxes to
complete your choice.
(Round to two decimal places as needed.)
A. Ho: P
Ha:p=
D. Ho: P
H₂: p
B. Ho: P<
H₂: p2
E. Ho: p2
H₂: p<
C. Ho:p>
Haps
F. Ho: PS
H₂:p>
(b) Use technology to find the P-value.
Identify the standardized test statistic.
Z=

Math
StatisticsProfessor Ivy has the following scores on her final exam:
76, 51, 81, 57, 62, 70, 98
41, 50, 100, 86, 93, 48
Compute the values indicated below. Express your answers rounded to the nearest tenth.
Mean:
Standard Deviation:
Use the 68-95-99.7 Rule to answer the following question.
What is the probability of an exam score more than 49.9 ?
Express your probability answer as a decimal.
If you haven't answered the question correctly in 3 attempts, you can get a hint.

Math
StatisticsA simple random sample of size n = 15 is obtained from a population with µ = 67 and σ = 17.
(a) What must be true regarding the distribution of the population in order to use the normal model to compute probabilities involving the sample mean? Assuming
that this condition is true, describe the sampling distribution of x.
(b) Assuming the normal model can be used, determine P(x < 70.9).
(c) Assuming the normal model can be used, determine P(x ≥ 68.3).
(a) What must be true regarding the distribution of the population?
A. The population must be normally distributed and the sample size must be large.
B. Since the sample size is large enough, the population distribution does not need to be normal.
C. The sampling distribution must be assumed to be normal.
D. The population must be normally distributed.
Math
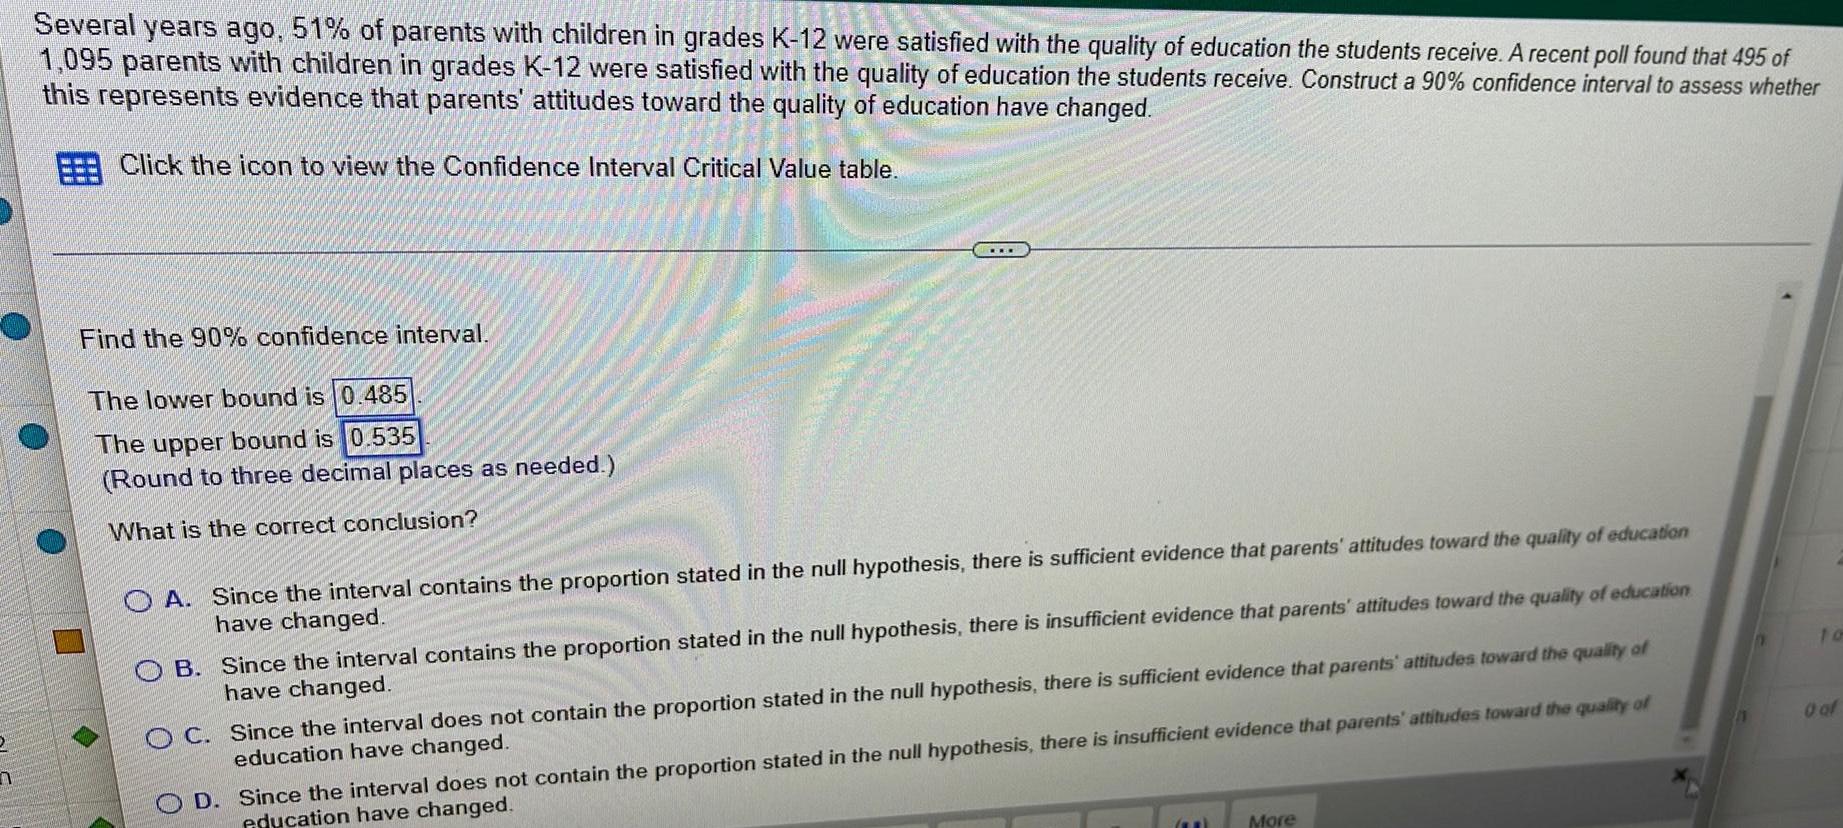
StatisticsnSeveral years ago, 51% of parents with children in grades K-12 were satisfied with the quality of education the students receive. A recent poll found that 495 of 1,095 parents with children in grades K-12 were satisfied with the quality of education the students receive. Construct a 90% confidence interval to assess whether this represents evidence that parents' attitudes toward the quality of education have changed.
Find the 90% confidence interval.
The lower bound is 0.485
The upper bound is 0.535
(Round to three decimal places as needed.)
What is the correct conclusion?
A. Since the interval contains the proportion stated in the null hypothesis, there is sufficient evidence that parents' attitudes toward the quality of education
have changed.
B. Since the interval contains the proportion stated in the null hypothesis, there is insufficient evidence that parents' attitudes toward the quality of education
have changed.
C. Since the interval does not contain the proportion stated in the null hypothesis, there is sufficient evidence that parents' attitudes toward the quality of
education have changed.
D. Since the interval does not contain the proportion stated in the null hypothesis, there is insufficient evidence that parents' attitudes toward the quality of
education have changed.