Statistics Questions and Answers

Math
StatisticsUse the given minimum and maximum data entries, and the number of classes, to find the class width, the lower class limits, and the upper class limits.
minimum = 8, maximum = 78, 6 classes
The class width is.
Choose the correct lower class limits below.
A. 8, 19, 32, 43, 55, 68
B. 8, 20, 32, 44, 56, 68
C. 19, 31, 44, 55, 67, 79
D. 20, 31, 44, 56, 68, 79
Choose the correct upper class limits below.
A. 20, 32, 44, 56, 68, 79
B. 19, 31, 44, 56, 67, 79
C. 19, 31, 43, 55, 67, 79
D. 20, 32, 43, 55, 68, 79

Math
StatisticsWhich of the following regressions represents the strongest linear
relationship between x and y?
Regression 1
y = ax + b
a =-17.8
b = -8.1
r = -0.4682
Regression 2
y = ax + b
a = = 4
b = -19.5
r = 1.1369
Regression 3
y = ax + b
a = = 4.9
b = -16.8
r = 0.5454
Regression 4
y = ax + b
a = 4.1
b=-17.5
r = 0.5836

Math
StatisticsFor the given data set, find the a. mean and b. mode (or state that there is no mode)
Ages of teachers in the mathematics department of a certain high school:
26,31,48,37,24,30,26,37,20
a.37
b. 30
a. 31
b. 26,37
a. 26
b. 31.5
a. 30
b. 31

Math
StatisticsHow is a sample related to a population?
Choose the correct answer below.
A. A sample is a numerical measure that describes a sample characteristic.
B. A sample is a subset of a population.
C. A sample is the collection of all outcomes, responses, measurements, or counts.

Math
StatisticsYou are conducting a study to see if the proportion of men over 50 who regularly have their prostate examined is significantly more than 0.18. Thus you are performing a right-tailed test. Your sample data produce the test statistic z 1.92. Find the p-value accurate to 4 decimal places.

Math
StatisticsA scuba diver is taking samples for research. The depths (in feet) from which samples were taken
are listed below.
24.2, 11.1, 8.2, 17.5, 28.4, 8.2, 9.7, 41.2, 13.4, 12.1, 26.8, 8.2
a. Find the mean, median, and the mode of the depths. Be sure to show your work.
b. Which measure of center best represents the data? Explain.

Math
StatisticsA city has a population of 300,000 people. Suppose that each year the population grows by 6.5%. What will the population be after 11 years?
Use the calculator provided and round your answer to the nearest whole number.

Math
StatisticsBased on the data set below, what is the frequency of numbers ranging from 90-95?
100, 102, 111, 106, 108, 99, 91, 122, 95, 94, 145, 150, 130, 110, 121, 141, 137, 136, 103, 144

Math
StatisticsA researcher randomly selects and measures the volumes of the contents of 13 bottles of cough syrup. Assume the sample is taken from a normally distributed population. The 99% confidence interval for the population standard deviation o is (0.0299,0.0405). The population standard deviation of the volumes of the bottles' contents should be less than 0.051 fluid ounce. Does the confidence interval for a suggest that the variation in the volumes of the bottles' contents is at an acceptable level? Explain your reasoning. Choose the correct answer below.
A. Yes, because 0.051 is contained in the confidence interval.
B. Yes, because all values contained in the confidence interval are less than 0.051.
C. Yes, because all values contained in the confidence interval are greater than.
D. No, because 0.051 is contained in the confidence interval.
E. No, because all values contained in the confidence interval are less than 0.051.
F. No, because all values contained in the confidence interval are greater than 0.051.

Math
StatisticsThe scores of eighth-grade students in a math test are normally distributed with a mean of 57.5 and a standard deviation of 6.5. From this data, we can conclude that 68% of the students received scores between and

Math
StatisticsFind the mean, median, and mode: 2.3, 4.3, 3.2, 2.9, 2.7, 2.3
A. 2.95, 2.8, 2.3
B. 2.95, 2.3, 2.8
C. 2.8, 2.95, 2.3
D. 3.05, 2.8, 2.3

Math
StatisticsFor the following set of data, find the population standard deviation, to the nearest thousandth.
45, 30, 35, 20, 21, 46, 16, 37
Copy Values for Calculator
Open Statistics Calculator

Math
StatisticsThe salaries of six bank employees are $37,000, $38,500, $35,000, $37,000,
$45,000, $40,000, and $75,000.
Which statement is true?
Both the median and mode are appropriate measures of center.
The mean, median, and mode are all appropriate measures of center.
Both the mean and median are appropriate measures of center.
The median is the only appropriate measure of center.

Math
StatisticsThe numbers of items that customers purchased using a self-checkout lane are shown.
8, 4, 6, 5, 4, 3, 15, 4, 4, 1, 10, 3, 4, 12, 7, 2, 4, 6, 21, 18, 4, 10, 13, 4
Which measure or measures of central tendency best reflect the data?
Select EACH correct answer.
mean
mode
median

Math
StatisticsA magazine includes a report on the energy costs per year for 32-inch liquid crystal display (LCD) televisions. The article states that 14 randomly selected 32-inch LCD televisions have a sample standard deviation of $3.72. Assume the sample is taken from a normally distributed population. Construct 99% confidence intervals for (a) the population variance o2 and (b) the population standard deviation σ
Interpret the results. (a) The confidence interval for the population variance is (Round to two decimal places as needed.)

Math
StatisticsFor the following set of data, find the number of data within 2 population standard deviations of the mean.
63, 62, 95, 33, 65, 62, 57

Math
StatisticsSuppose the line of best fit is drawn for some data points. If the mean of the x-coordinates of the points is 10, and the mean of the y-coordinates of the points is -8, the line must pass through which of these points?
A. (8,-10)
B. (-8, 10)
C. (10,-8)
D. (-10, 8)

Math
StatisticsA line of best fit was drawn for 7 data points. What is the maximum number
of these data points that may not actually be on the line?
A. 7
B. 5
C. 4
D. 6
Math
StatisticsWhen Jonathan runs the 400 meter dash, his finishing times are normally distributed with a mean of 88 seconds and a standard deviation of 2.5 seconds. If Jonathan were to run 48 practice trials of the 400 meter dash, how many of those trials would be between 89 and 91 seconds, to the nearest whole number?

Math
StatisticsThe total points scored by two youth soccer teams are shown.
Rockets: 3, 0, 3, 4, 2, 6, 1, 0, 3
Jets: 2, 3, 2, 1, 0, 0, 0, 2, 1

Math
StatisticsOn his 6 Algebra tests, Omar received the following scores: 82, 44, 92, 86, 77 & 82.
Find the mean, median, mode, range and outlier of the data set. Round the the
nearest tenth.
a. Mean:
b. Median:
c. Mode:
d. Range:
e. Outlier:

Math
StatisticsBased on the following calculator output, determine the range of the dataset.
1-Var-Stats
114.285714286
Ex=800
Σx² = 92018
Sx 9.91151326681
σx= = 9.17627820157
n = 7
minX = 102
Q₁ = 104
Med = 115
Q3 = 122
maxX = 128
Math
StatisticsHow is the interquartile range calculated?
A. Find the difference between the values for quartile 3 and the median.
B. Find the difference between the values for quartile 3 and quartile 1.
C. Find the difference between the values for quartile 3 and the minimum.
D. Find the difference between the values for the maximum and minimum.

Math
StatisticsCJ wanted to see if listening to music would make the basketball players make more baskets. On day one, he didn't play any music and counted how many baskets they could make in 10 minutes. On day 2, he played rap music and counted the baskets, and on day 3, he played classical music and counted the baskets.
a. Independent Variable (V): the different kinds of music
b. Dependent Variable (DV)
c. Control:

Math
StatisticsIf there are 25 values in a data set in order from smallest to largest, what is
the third quartile of the data set?
A. The mean of the 21st and 22nd values
B. The mean of the 20th and 21st values
C. The mean of the 19th and 20th values
D. The mean of the 22nd and 23rd values

Math
StatisticsA line of best fit predicts that when x equals 35, y will equal 34.785, but y actually equals 37. What is the residual in this case?
A. -0.215
B. 2.215
C. 15
D. 0.215

Math
StatisticsSuppose the line of best fit is being found for some data points that have an r-value of 0.793. If the standard deviation of the x-coordinates is 5.591, and the standard deviation of the y-coordinates is 2.772, what is the slope of the line to three decimal places?
A. 0.625
B. 2.543
C. 0.393
D. 1.599

Math
StatisticsSuppose the linear regression line = 4.009x - 77.531 predicts a pizza
parlor's profits based on the number of pizzas sold. If x represents the
number of pizzas sold, and ŷ represents the pizza parlor's profits in dollars,
about how much can the pizza parlor expect in profits if it sells 325 pizzas?
A. $1375
B. $1300
C. $1225
D. $1150

Math
StatisticsFind the mean, median, and mode for the data set below. Explain which measure best describes the data.
3 30 26 27 29 30
The mean is
(Type an integer or decimal rounded to the nearest hundredth as needed.)
The median is
(Type an integer or a decimal.)
Select the correct choice below and, if necessary, fill in the answer box to complete your choice.
A. The mode is (Use a comma to separate answers as needed.)
B. There is no mode.

Math
StatisticsSuppose that there were a negative correlation between the variables a and b. If bis 60 when a is 8, which of these is most likely to be the value of b when a is 16?
A. 75
B. 90
C. 60
D. 30

Math
StatisticsThe first quartile of a data set is 23, the median is 30, the third quartile is 33, and an outlier is 6. Which of these data values would be represented by a point in a modified box plot?
A. 30
B. 6
C. 23
D. 33

Math
StatisticsThe value of an explanatory variable is 10, while the corresponding value of
the response variable is 5. What would be the coordinates of this data point
when plotted on a scatterplot?
A. (10,5)
B. (5, 15)
C. (5, 10)
D. (15,5)
Math
StatisticsIf a sample of 187 bowlers were taken from a population of 999 bowlers, x
could refer to the mean of how many bowlers' scores?
A. Both 187 and 999
B. 187
C. 999
D. Neither 187 nor 999
Math
StatisticsThe mean is the average of the numbers.
Add up all the numbers, then divide by how many numbers there are.
Reminder: there are 15 numbers
7.5, 6.5, 8, 10, 9, 9.5, 5.5, 8, 7.5, 6.5, 6, 8, 7.5, 10, 10.5
Data set:
Math
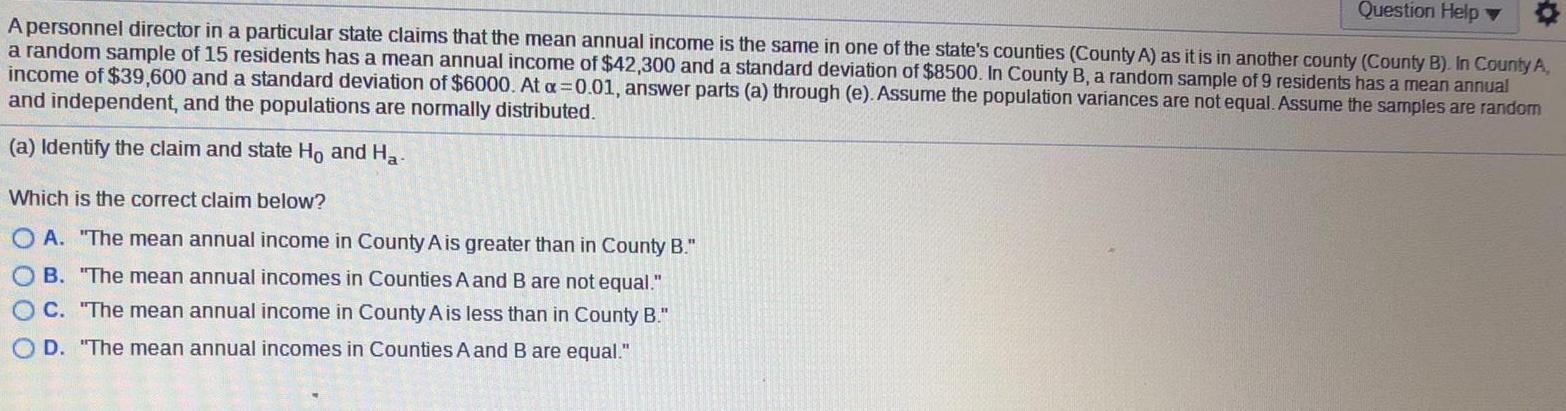
StatisticsA personnel director in a particular state claims that the mean annual income is the same in one of the state's counties (County A) as it is in another county (County B). In County A, a random sample of 15 residents has a mean annual income of $42,300 and a standard deviation of $8500. In County B, a random sample of 9 residents has a mean annual income of $39,600 and a standard deviation of $6000. At a=0.01, answer parts (a) through (e). Assume the population variances are not equal. Assume the samples are random and independent, and the populations are normally distributed.
(a) Identify the claim and state Ho and Ha
Which is the correct claim below?
A. "The mean annual income in County A is greater than in County B."
B. "The mean annual incomes in Counties A and B are not equal."
C. "The mean annual income in County A is less than in County B."
D. "The mean annual incomes in Counties A and B are equal."
Math
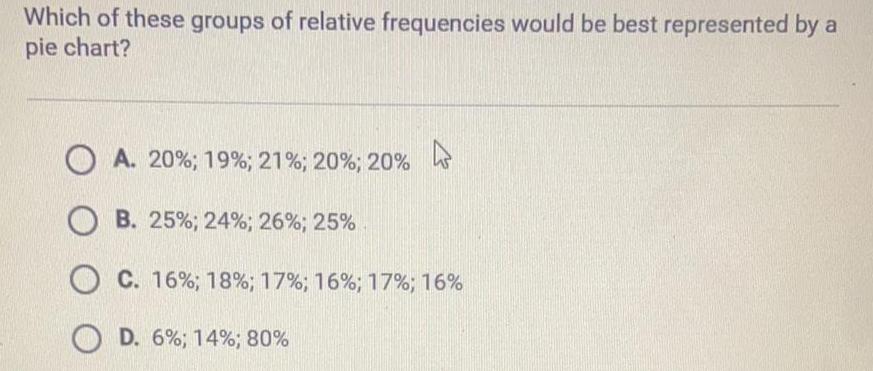
StatisticsWhich of these groups of relative frequencies would be best represented by a
pie chart?
A. 20%; 19%; 21%; 20%; 20%
B. 25%; 24%; 26%; 25%
C. 16% ; 18%; 17%; 16% ; 17%; 16%
D. 6%; 14%; 80%
Math
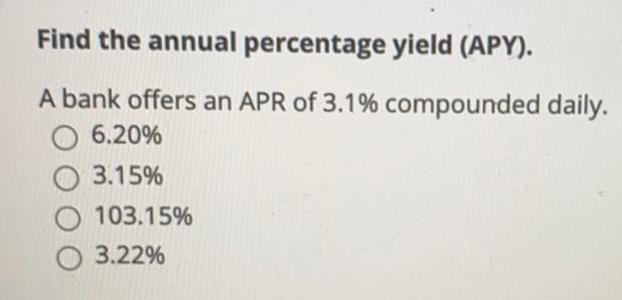
StatisticsFind the annual percentage yield (APY).
A bank offers an APR of 3.1% compounded daily.
6.20%
3.15%
103.15%
3.22%
Math
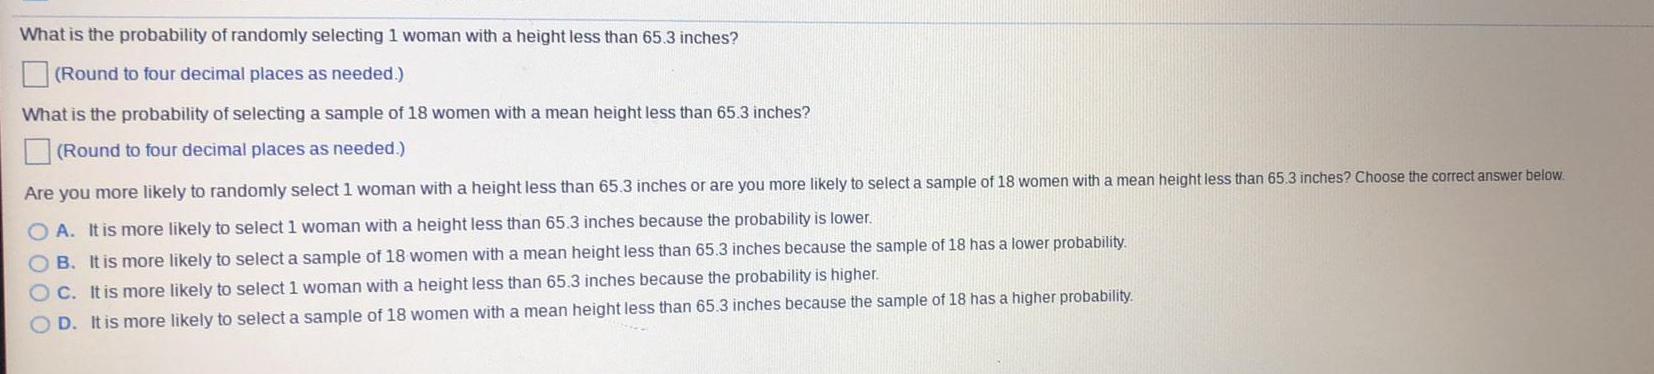
StatisticsWhat is the probability of randomly selecting 1 woman with a height less than 65.3 inches?
(Round to four decimal places as needed.)
What is the probability of selecting a sample of 18 women with a mean height less than 65.3 inches?
(Round to four decimal places as needed.)
Are you more likely to randomly select 1 woman with a height less than 65.3 inches or are you more likely to select a sample of 18 women with a mean height less than 65.3 inches? Choose the correct answer below.
A. It is more likely to select 1 woman with a height less than 65.3 inches because the probability is lower.
B. It is more likely to select a sample of 18 women with a mean height less than 65.3 inches because the sample of 18 has a lower probability.
C. It is more likely to select 1 woman with a height less than 65.3 inches because the probability is higher.
D. It is more likely to select a sample of 18 women with a mean height less than 65.3 inches because the sample of 18 has a higher probability.
Math
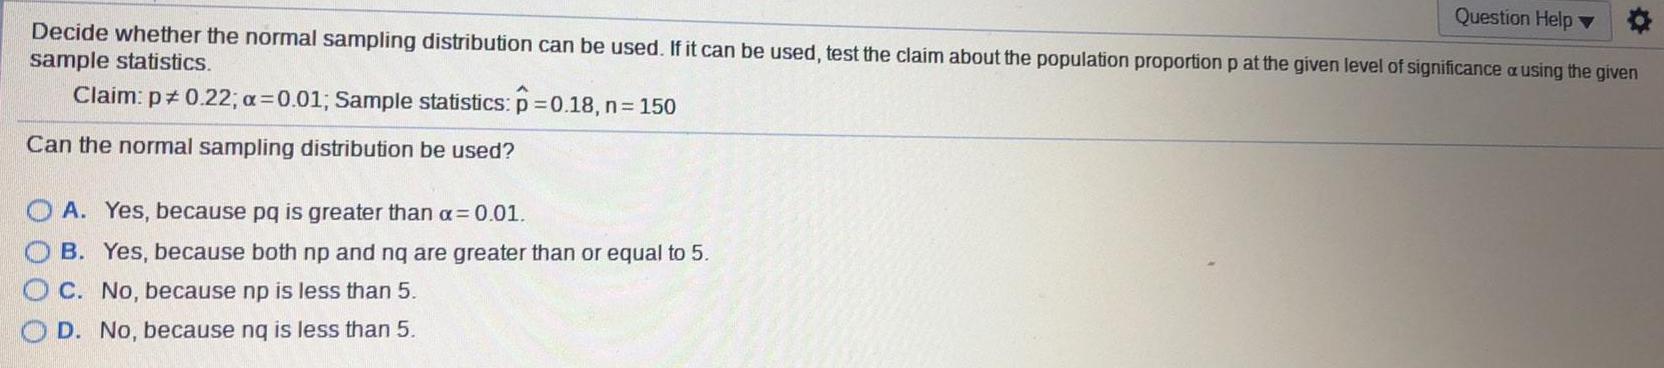
StatisticsQuestion Help Decide whether the normal sampling distribution can be used. If it can be used, test the claim about the population proportion p at the given level of significance a using the given sample statistics.
Claim: p=0.22; x = 0.01; Sample statistics: p=0.18, n = 150
Can the normal sampling distribution be used?
A. Yes, because pq is greater than α=0.01.
B. Yes, because both np and nq are greater than or equal to 5.
C. No, because np is less than 5.
D. No, because ng is less than 5.
Math
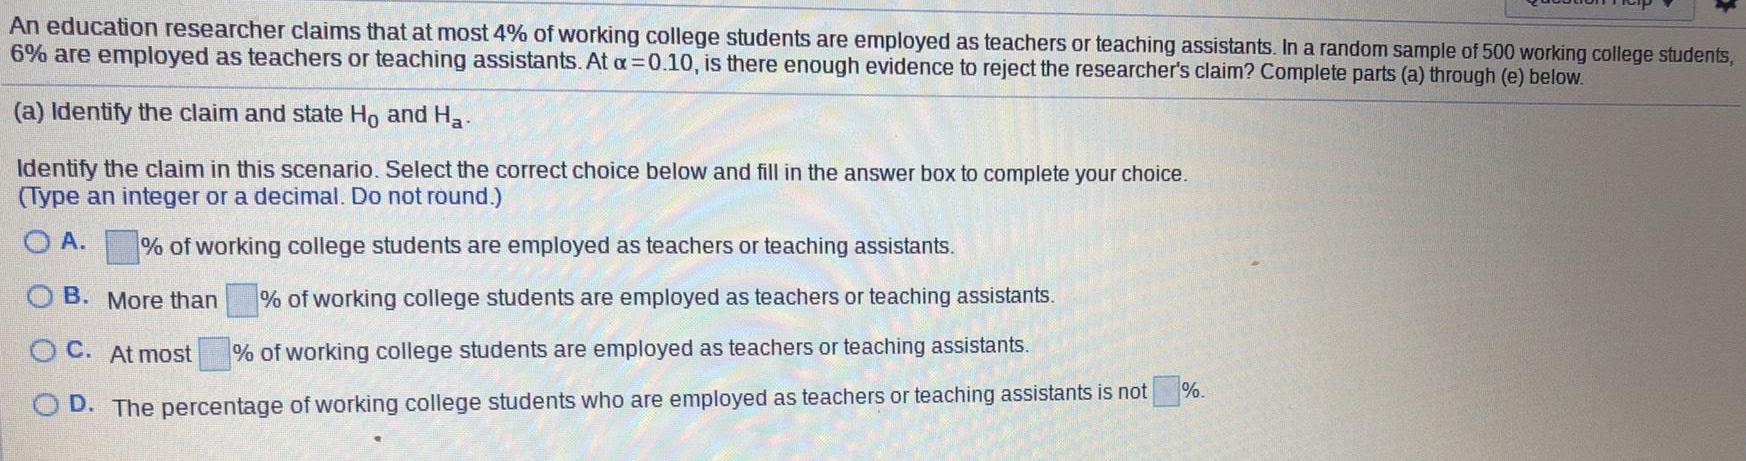
StatisticsAn education researcher claims that at most 4% of working college students are employed as teachers or teaching assistants. In a random sample of 500 working college students, 6% are employed as teachers or teaching assistants. At a=0.10, is there enough evidence to reject the researcher's claim? Complete parts (a) through (e) below. (a) Identify the claim and state Ho and Ha
Identify the claim in this scenario. Select the correct choice below and fill in the answer box to complete your choice. (Type an integer or a decimal. Do not round.)
A. % of working college students are employed as teachers or teaching assistants.
B. More than % of working college students are employed as teachers or teaching assistants.
C. At most % of working college students are employed as teachers or teaching assistants.
D. The percentage of working college students who are employed as teachers or teaching assistants is not %.
Math
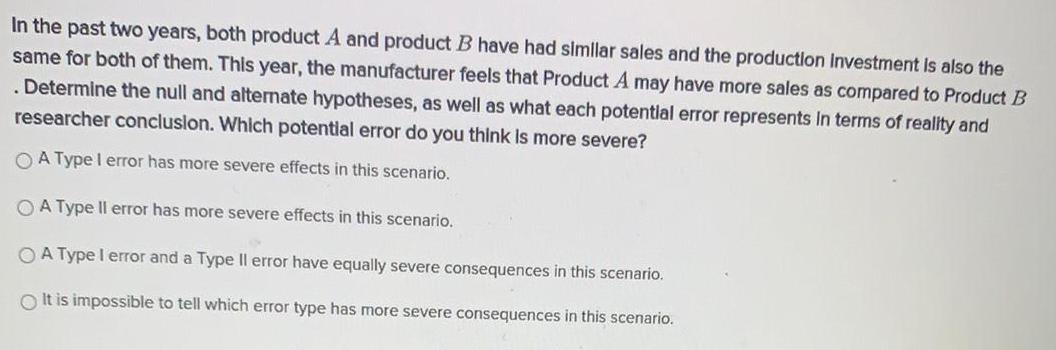
StatisticsIn the past two years, both product A and product B have had similar sales and the production Investment is also the same for both of them. This year, the manufacturer feels that Product A may have more sales as compared to Product B . Determine the null and alternate hypotheses, as well as what each potential error represents in terms of reality and researcher conclusion. Which potential error do you think is more severe?
A Type I error has more severe effects in this scenario.
A Type II error has more severe effects in this scenario.
A Type I error and a Type Il error have equally severe consequences in this scenario.
It is impossible to tell which error type has more severe consequences in this scenario.

Math
StatisticsAn energy company wants to choose between two regions in a state to install energy-producing wind turbines. A researcher claims that the wind speed in Region A is less than the wind speed in Region B. To test the regions, the average wind speed is calculated for 60 days in each region. The mean wind speed in Region Ais 13.8 miles per hour. Assume the population standard deviation is 2.8 miles per hour. The mean wind speed in Region B is 15.1 miles per hour. Assume the population standard deviation is 3.2 miles per hour. At a=0.05, can the company support the researcher's claim? Complete parts (a) through (d) below.
(a) Identify the claim and state Ho and Ha
What is the claim?
A. The wind speed in Region A is less than the wind speed in Region B.
B. The wind speed in Region A is not less than the wind speed in Region B.
C. The wind speed in Region A is not greater than the wind speed in Region B.
D. The wind speed in Region A is the same as the wind speed in Region B.

Math
StatisticsYou want to buy a washing machine, and a salesperson tells you that the mean repair costs for Model A and Model B are equal. You research the repair costs. The mean repair cost of 21 Model A washing machines is $214. Assume the population standard deviation is $17. The mean repair cost of 28 Model B washing machines is $220. Assume the population standard deviation is $22. At a=0.01, can you reject the salesperson's claim? Assume the samples are random and independent, and the populations are normally distributed. Complete parts (a) through (e).
(a) Identify the claim and state Ho and H₂-
What is the claim?
A. The mean repair costs for Model A and Model B are different.
B. The mean repair cost for Model A is greater than Model B.
C. The mean repair cost for Model A is less than Model B.
D. The mean repair costs for Model A and Model B are equal.

Math
StatisticsA consumer group claims that the mean minimum time it takes for a sedan to travel a quarter mile is greater than 14.6 seconds. A random sample of 21 sedans has a mean minimum time to travel a quarter mile of 15.3 seconds and a standard deviation of 2.09 seconds. At a=0.01 is there enough evidence to support the consumer group's claim? Complete parts (a) through (d) below. Assume the population is normally distributed.
(a) Identify the claim and state Ho and Ha-


Math
StatisticsIn a survey of 2250 adults, 712 say they believe in UFOs.
Construct a 95% confidence interval for the population proportion of adults who believe in UFOs.
A 95% confidence interval for the population proportion is
(Round to three decimal places as needed.)
Interpret your results. Choose the correct answer below.
A. With 95% confidence, it can be said that the population proportion of adults who believe in UFOs is between the endpoints of the given confidence interval.
B. The endpoints of the given confidence interval shows that 95% of adults believe in UFOs.
C. With 95% confidence, it can be said that the sample proportion of adults who believe in UFOs is between the endpoints of the given confidence interval.
D. With 95% probability, the population proportion of adults who do not believe in UFOs is between the endpoints of the given confidence interval.

Math
StatisticsIn one state the gestation period had a mean of 280 days with a standard deviation of 11 days. What is the probability that a baby is born between 11 days early and 22 days late? Use the 68-95-99.7 normal distribution curve.
97.35%
81.5%
83.85%
81.3%

Math
StatisticsIn a random sample of 21 people, the mean commute time to work was 33.1 minutes and the standard deviation was 7.2 minutes. Assume the population is normally distributed and use a t-distribution to construct a 80% confidence interval for the population mean μ. What is the margin of error of u? Interpret the results.
The confidence interval for the population mean μ is (-
(Round to one decimal place as needed.)
The margin of error of μ is.
(Round to one decimal place as needed.)
Interpret the results.
A. It can be said that 80% of people have a commute time between the bounds of the confidence interval.
B. With 80% confidence, it can be said that the commute time is between the bounds of the confidence interval.
C. If a large sample of people are taken approximately 80% of them will have commute times between the bounds of the confidence interval.
D. With 80% confidence, it can be said that the population mean commute time is between the bounds of the confidence interval.

Math
StatisticsThe average salary of all workers in a auto manufacturing plant is $37,000 in a study about the plant. Does this value describe a population parameter or a sample statistic?
Sample Statistic
Population Parameter

Math
StatisticsQuestion Help To compare the dry braking distances from 30 to 0 miles per hour for two makes of automobiles, a safety engineer conducts braking tests for 35 models of Make A and 35 models o Make B. The mean braking distance for Make A is 44 feet. Assume the population standard deviation is 4.6 feet. The mean braking distance for Make B is 45 feet. Assume the population standard deviation is 4.5 feet. At a=0.10, can the engineer support the claim that the mean braking distances are different for the two makes of automobiles? Assume the samples are random and independent, and the populations are normally distributed. Complete parts (a) through (e).
(a) Identify the claim and state Ho and Ha
What is the claim?
A. The mean braking distance is greater for Make A automobiles than Make B automobiles.
B. The mean braking distance is less for Make A automobiles than Make B automobiles.
C. The mean braking distance is the same for the two makes of automobiles.
D. The mean braking distance is different for the two makes of automobiles.