Statistics Questions and Answers

Math
StatisticsA study of 55 patients with back pain reported that the mean duration of pain was 17.6
months. It is known that the standard deviation of duration of back pain is 5.1 months. Assuming
that the duration of this problem is normally distributed in the population; determine a 99%
confidence interval for the mean duration of back pain in the population.
Math
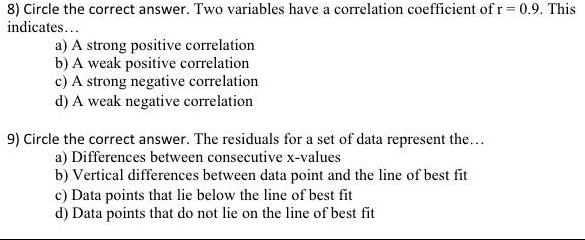
Statistics8) Circle the correct answer. Two variables have a correlation coefficient of r = 0.9. This
indicates...
a) A strong positive correlation
b) A weak positive correlation
c) A strong negative correlation
d) A weak negative correlation
9) Circle the correct answer. The residuals for a set of data represent the...
a) Differences between consecutive x-values
b) Vertical differences between data point and the line of best fit
c) Data points that lie below the line of best fit
d) Data points that do not lie on the line of best fit

Math
StatisticsA standardized exam's scores are normally distributed. In a recent year, the mean test score was 1463 and the standard deviation was 311. The test scores of four
students selected at random are 1890, 1230, 2170, and 1340. Find the z-scores that correspond to each value and determine whether any of the values are unusual.
The Z-score for 1890 is
Math
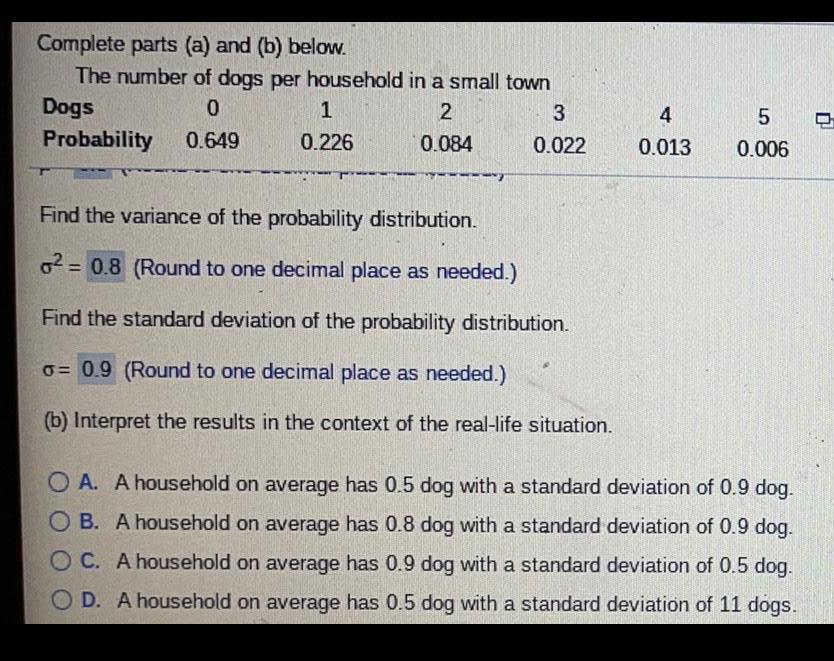
StatisticsComplete parts (a) and (b) below. The number of dogs per household in a small town
Dogs 0 1 2 3 4 5
Probability 0.649 0.084 1 0.226 3 0.022 0.013 0.006
Find the variance of the probability distribution. σ2 = (Round to one decimal place as needed.)
Find the standard deviation of the probability distribution. σ= (Round to one decimal place as needed.)
(b) Interpret the results in the context of the real-life situation.
A. A household on average has 0.5 dog with a standard deviation of 0.9 dog.
B. A household on average has 0.8 dog with a standard deviation of 0.9 dog.
C. A household on average has 0.9 dog with a standard deviation of 0.5 dog.
D. A household on average has 0.5 dog with a standard deviation of 11 dogs.
Math
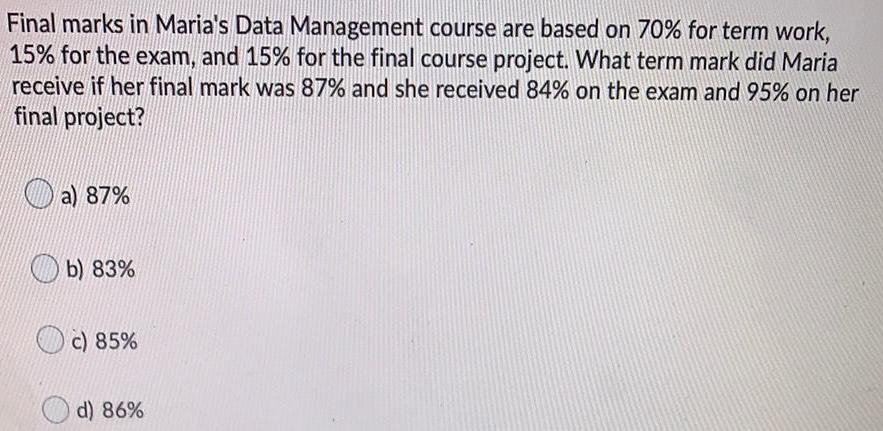
StatisticsFinal marks in Maria's Data Management course are based on 70% for term work,
15% for the exam, and 15% for the final course project. What term mark did Maria
receive if her final mark was 87% and she received 84% on the exam and 95% on her final project?
a) 87%
b) 83%
c) 85%
d) 86%
Math
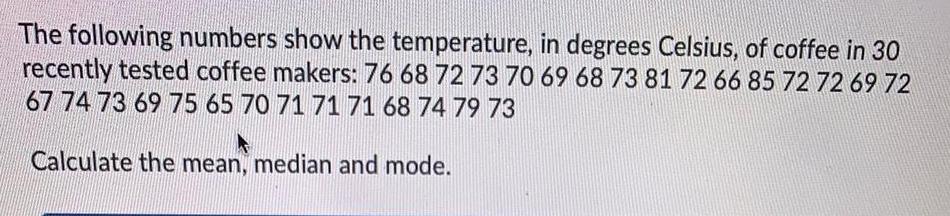
StatisticsThe following numbers show the temperature, in degrees Celsius, of coffee in 30
recently tested coffee makers: 76 68 72 73 70 69 68 73 81 72 66 85 72 72 69 72
67 74 73 69 75 65 70 71 71 71 68 74 79 73
Calculate the mean, median and mode.

Math
StatisticsWhich of the following probabilities is the greatest for a standard normal distribution?
P(-1.55zs-0.5)
P(-0.6sz≤0.5)
P(05sz≤15)
P(1.5sz≤2.5)

Math
StatisticsOmar recorded the number of hours he worked each week for a year. Below is a random sample that he took from his data.
13, 17, 9, 21
What is the standard deviation for the data?
0
4.4
5.2
26.7
![Joan has received scores of 64%, 79%, and 75% on the first three tests in a class.
What score does she need to get on the fourth test to have an average of 75%?
[?]%](https://media.kunduz.com/media/sug-question/raw/52586594-1658419017.995807.jpeg?w=256)
Math
StatisticsJoan has received scores of 64%, 79%, and 75% on the first three tests in a class.
What score does she need to get on the fourth test to have an average of 75%?
[?]%

Math
StatisticsFind each item listed below for the data provided.
Test Scores: 50, 69, 70, 75, 75, 90, 85, 80, 70, 60, 100, 95, 90, 80, 85, 50
(all answers should be rounded to the nearest tenth)
Mean:
Median:
Range:
IQR:

Math
StatisticsAssume the random variable X is normally distributed, with mean μ = 58 and standard deviation o=7. Find the 11th percentile.
The 11th percentile is
(Round to two decimal places as needed.)
Math
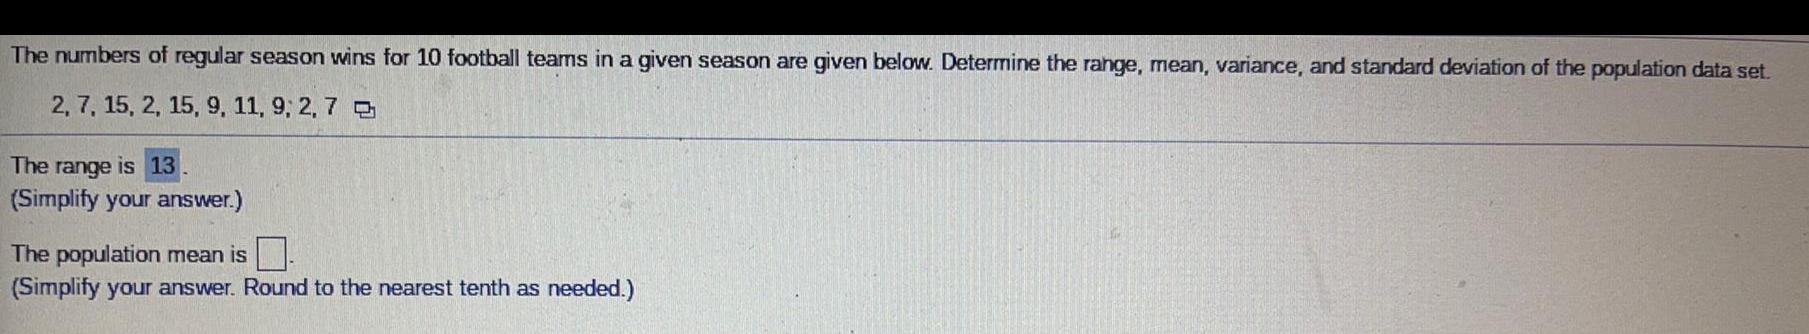
StatisticsThe numbers of regular season wins for 10 football teams in a given season are given below. Determine the range, mean, variance, and standard deviation of the population data set.
2, 7, 15, 2, 15, 9, 11, 9, 2, 7
The range is 13
(Simplify your answer.)
The population mean is.
(Simplify your answer. Round to the nearest tenth as needed.)

Math
StatisticsKelsey is knitting baby items to sell at a craft fair. She has a total of 1,620 yards of yarn to use for the items. A pair of mittens uses 81 yards of yarn and a hat uses 162 yards. She wants to knit a minimum of 12 items for the fair. If the solution region represents the number of pairs of mittens and hats that Kelsey can knit, determine which graph represents the solution set to the system of inequalities representing this situation.
Math
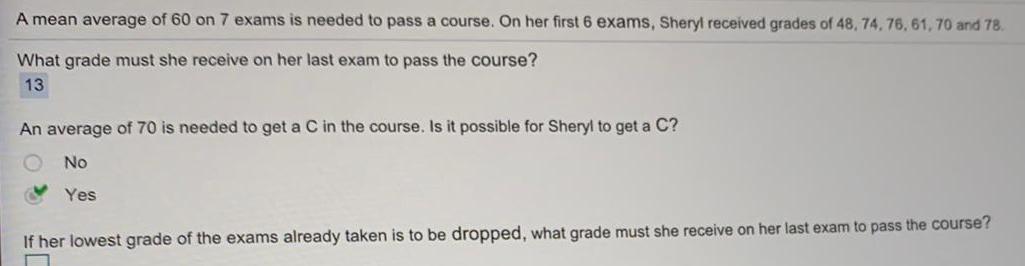
StatisticsA mean average of 60 on 7 exams is needed to pass a course. On her first 6 exams, Sheryl received grades of 48, 74, 76, 61, 70 and 78.
What grade must she receive on her last exam to pass the course?
An average of 70 is needed to get a C in the course. Is it possible for Sheryl to get a C?
If her lowest grade of the exams already taken is to be dropped, what grade must she receive on her last exam to pass the course?
Math
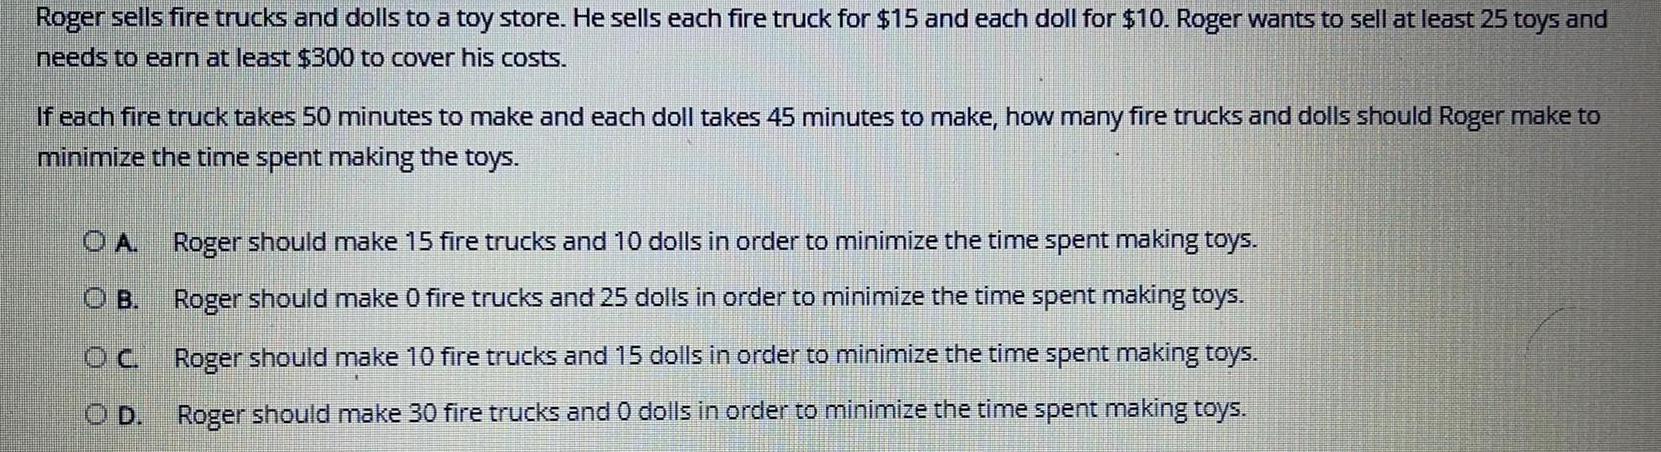
StatisticsRoger sells fire trucks and dolls to a toy store. He sells each fire truck for $15 and each doll for $10. Roger wants to sell at least 25 toys and needs to earn at least $300 to cover his costs.
If each fire truck takes 50 minutes to make and each doll takes 45 minutes to make, how many fire trucks and dolls should Roger make to minimize the time spent making the toys.
A. Roger should make 15 fire trucks and 10 dolls in order to minimize the time spent making toys.
B. Roger should make 0 fire trucks and 25 dolls in order to minimize the time spent making toys.
C. Roger should make 10 fire trucks and 15 dolls in order to minimize the time spent making toys.
D. Roger should make 30 fire trucks and 0 dolls in order to minimize the time spent making toys.
Math
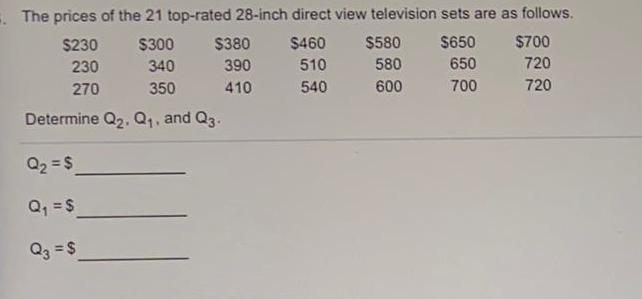
StatisticsThe prices of the 21 top-rated 28-inch direct view television sets are as follows.
$300 $380 $460 $580 $650 340 390 510 580 650 350 410 540 600 700
Determine Q₂, Q₁, and Q3.
Q₂ = $
Q₁ = $
Q3 = $

Math
StatisticsThe mean score on a set of 23 tests is 73. What is the sum of all the test scores?
The sum of all the test scores is

Math
StatisticsThe highway mileage (mpg) for a sample of 5 different models of a car company can be found below. Find the mean, median, mode and range.
21, 23, 26, 28, 28, 30
Mean =
Median =
Mode =
Range =

Math
StatisticsFind the consumers' surplus and the producers' surplus at the equlibrium level for the given price-demand and price-supply equations. Include a graph that identifies the consumers' surplus and the producers' surplus. Round all values to the
nearest integer.
p=D(x)=65.1-0.09x; p= S(x) = 10 +0.1x

Math
StatisticsIf two states are selected at random from a group of 30 states, determine the number of possible outcomes if the group of states are selected with replacement or without replacement.

Math
StatisticsDavid is a statistician. He has a sample size of 40 (which he cannot change). What element of his hypothesis test can he adjust to minimize the probability that he incorrectly rejects the null hypothesis?
the mean of the population
the mean of the sample
the standard deviation of the population
the significance level of the test

Math
StatisticsOne graph in the figure represents a normal distribution with mean = 16 and standard deviation a = 1. The other graph represents a normal distribution with mean u=8 and standard deviation o=1. Determine which graph is which and explain how you know.

Math
StatisticsWhile the majority of people who are color blind are male, an institute reports that 0.3% of women with Northern European ancestry have the common form of red-green
color blindness. Suppose a random sample of 100 women with Northern European ancestry is selected. Can we find the probability that less than 0.2% of the sample is
color blind? If so, find the probability. If not, explain why this probability cannot be calculated.
Select the correct choice below and, if necessary, fill in the answer box to complete your choice.
A. This probability cannot be calculated because the sample is too small to satisfy the conditions of the Central Limit Theorem.
B. This probability cannot be calculated because the sample does not satisfy the Central Limit Theorems conditions for randomness and independence.
C. This probability can be calculated, the sample meets all of the conditions of the Central Limit Theorem. The probability is %.
(Type an integer or decimal rounded to one decimal place as needed.)
D. This probability can be calculated, the sample meets enough of the conditions of the Central Limit Theorem. The probability is
(Type an integer or decimal rounded to one decimal place as needed.)
E. This probability cannot be calculated because the population size is too small to satisfy the conditions of the Central Limit Theorem.
%.
Math
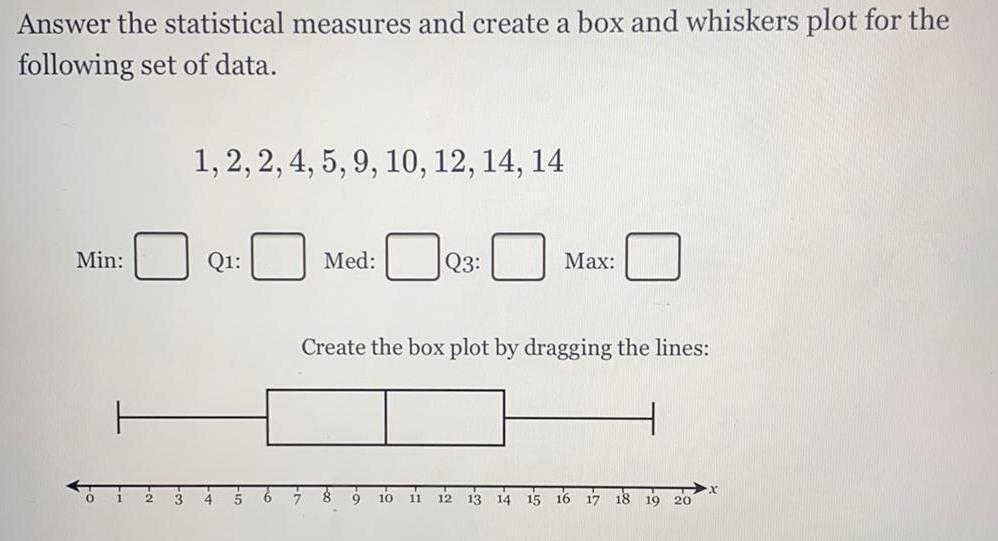
StatisticsAnswer the statistical measures and create a box and whiskers plot for the
following set of data.
Min:
1, 2, 2, 4, 5, 9, 10, 12, 14, 14
Q1:
Med:
Q3:
Max:
Create the box plot by dragging the lines:
Math
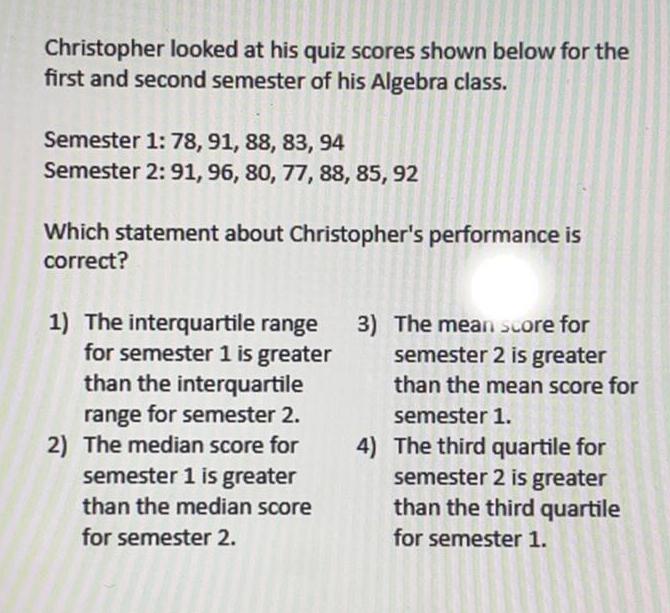
StatisticsChristopher looked at his quiz scores shown below for the
first and second semester of his Algebra class.
Semester 1: 78, 91, 88, 83, 94
Semester 2: 91, 96, 80, 77, 88, 85, 92
Which statement about Christopher's performance is
correct?
1) The interquartile range 3) The mean score for
for semester 1 is greater semester 2 is greater
than the interquartile
than the mean score for
range for semester 2.
semester 1.
2) The median score for
semester 1 is greater
than the median score
for semester 2.
4) The third quartile for
semester 2 is greater
than the third quartile
for semester 1.

Math
StatisticsThe two sets of data below represent the number of runs
scored by two different youth baseball teams over the
course of a season.
Team A: 4, 8, 5, 12, 3, 9, 5, 2
Team B: 5, 9, 11, 4, 6, 11, 2, 7
Which set of statements about the mean and standard
deviation is true?
1) mean A< mean B
standard deviation A >
standard deviation B
2) mean A> mean B
standard deviation A <
standard deviation B
3) mean A < mean B
standard deviation A <
standard deviation B
4)
mean A> mean B
standard deviation A >
standard deviation B

Math
StatisticsAva wonders what her family's favorite sports team is. So, she asked all her friends about their favorite team. Is this a random sample that helps find her family's favorite team?
A. Yes, because she asked her friends.
B. No, because she asked her friends; people in her family may like a different team.
C. Yes, because she asked each friend the same question.
D. This cannot be determined with the information given.

Math
StatisticsIsaac invested $77,000 in an account paying an interest rate of 4.6% compounded quarterly. Assuming no deposits or withdrawals are made, how much money, to the nearest cent, would be in the account after 12 years?

Math
StatisticsApproximately 75% of patients comply with physicians' recommendations post office visits.Each patient's compliance is independent of any other patient's. Of the 400 patients surveyed post office site, what is the probability that at least 300 will comply? Patients are randomly selected.

Math
StatisticsJoe's New Car dealership lists the following prices for this year's models. $10,469, $12,895, $15,499, $17,999, $18,595, $21,245, $10,395, $14,985 What is the range in prices?
A $15,260
B $15,242
C $10,850
D $10,776

Math
StatisticsCreate a frequency chart of the data below using 2-4 as your first interval:
2, 4, 10, 6, 3, 9, 11, 12, 2, 3, 7, 7, 4
What's the frequency for data values 8-10?
A. 2
B. 4
C. 3
D. none of the above
![Which value of r indicates a stronger correlation: r=0.711 or r= -0.886? Explain your reasoning.
Choose the correct answer below.
A. r=0.711 represents a stronger correlation because 0.711> -0.886.
B. r=-0.886 represents a stronger correlation because | -0.886]> |0.711|.
C. r=-0.886 represents a stronger correlation because 0.711 > - 0.886.
D. r=0.711 represents a stronger correlation because | -0.886| > |0.711|.](https://media.kunduz.com/media/sug-question/raw/50859306-1658392768.184986.jpeg?w=256)
Math
StatisticsWhich value of r indicates a stronger correlation: r=0.711 or r= -0.886? Explain your reasoning.
Choose the correct answer below.
A. r=0.711 represents a stronger correlation because 0.711> -0.886.
B. r=-0.886 represents a stronger correlation because | -0.886]> |0.711|.
C. r=-0.886 represents a stronger correlation because 0.711 > - 0.886.
D. r=0.711 represents a stronger correlation because | -0.886| > |0.711|.


Math
StatisticsTwo samples are taken with the following numbers of successes and sample sizes
r1 = 30 r₂ = 22
n₁ = 75 n₂ = 77
Find a 94% confidence interval, round answers to the nearest thousandth.
____<P1-P2<___

Math
StatisticsThe ages of the band members are:
17, 21, 15, 19, 18, 21.
What is the mode age of the band members?
A. 17
B. 21
C. 18.5
D. 19.3

Math
StatisticsA school principal wants to know the favorite class of the middle school students in his school. He surveys all of the students who are sent to his office throughout the week. Is this a random sample that will answer his question? Why or why not?
A. Yes, because he asked lots of students.
B. No, because he only asked students who were sent to his office; this is not a random sample.
C. Yes, because he asked the same question to each student he surveyed.
D. This cannot be determined with the given information.

Math
StatisticsIdentify the problem with the following study. It was found that a third of all people in the United States live in urban centers. This finding is based on a study involving 3 randomly selected individuals.
missing data
loaded question
reported results
small sample

Math
StatisticsWhen Xavier runs the 400 meter dash, his finishing times are normally distributed with a mean of 61 seconds and a standard deviation of 0.5 seconds. If Xavier were to run 34 practice trials of the 400 meter dash, how many of those trials would be slower than 62 seconds, to the nearest whole number?

Math
StatisticsA farmer who only sells produce to local residents in his town wishes to expand to a neighboring city. The farmer calls everyone in the phone book with a last name starting with "S" in the neighboring city and asks them if they would be interested in buying the produce. 242 told the farmer that they would be interested, 576 said they would not be interested and 138 refused to answer Which statement is true?
The survey sample is residents of the neighboring city with a last name starting with "S" and whose phone number is listed in the phone book.
The survey sample includes current customers.
The population of the survey is the 242 that said they would be interested.
The population of the survey is all residents of the neighboring city whose phone number is listed.

Math
StatisticsIs it ethical for a news blogger to construct a graph that exaggerates the negative effects of logging on the environment?
Yes, the environment is important to everyone.
Yes, it is important to make sure that people understand the negative effects of logging.
No, it is not important if people understand the negative effects of logging.
No, results should be presented in a fair and objective manner.

Math
StatisticsThere are 400 students in the senior class at Oak Creek High School. All of these
students took the SAT. The distribution of their SAT scores is approximately normal.
The number of students who scored within 2 standard deviations of the mean is
approximately
1. 75
2. 95
3. 300
4. 380

Math
StatisticsThe goals scored per game by a soccer team represent the first quartile for all teams in a league. What can you conclude about the team's goals scored per game?
Choose the correct answer below.
A. The team scored fewer goals per game than 75% of the teams in the league.
B. The team scored fewer goals per game than 25% of the teams in the league.
C. The team scored fewer goals per game than 50% of the teams in the league.
D. The team scored fewer goals per game than 100% of the teams in the league.

Math
StatisticsA car is purchased for $27,000. Each year it loses 20% of Its value. After how many years will the car be worth $11,000 or less? (Use the calculator provided if necessary.)
Write the smallest possible whole number answer.

Math
StatisticsDetermine the monthly principal and interest payment for a 15-year mortgage when the amount financed is $85,000 and Click here for table of Monthly Payments the annual percentage rate (APR) is 5.0%.
The monthly principal and interest payment is $
(Round to the nearest cent as needed.)
i Monthly Principal and Interest Payment per $1000 of Mortgage

Math
StatisticsThe tuition and fees (in thousands of dollars) for the top 14 universities in a recent year are listed below. Find the mean, median, and mode of the data, if possible. If any of these measures cannot be found or a measure does not
represent the center of the data, explain why.
43 42 39 43 35 43 46 47 42 43 43 47 47 42
Find the mean cost. Select the correct choice below and, if necessary, fill in the answer box to complete your choice.
A. The mean cost is
(Round to one decimal place as needed.)
B. There is no mean cost.
Does the mean represent the center of the data?
A. The mean represents the center.
B. The mean does not represent the center because it is the smallest data value.
C. The mean does not represent the center because it is the
gest data value.
D. The mean does not represent the center because it is not a data value.

Math
StatisticsCarlos used the following units of electricity for twelve months: 504, 519, 576, 321, 256, 101, 76,
75, 127, 289, 367, and 511. His average unit consumption is
a. $88.50
b. $310.17
c. $504.00
d. $511.00

Math
StatisticsThe ages (in years) of a random sample of shoppers at a gaming store are shown. Determine the range, mean, variance, and standard deviation of the sample data
set.
12, 20, 23, 14, 13, 17, 22, 16, 14, 15
The range is 11
(Simplify your answer.)
The mean is 16.6.
(Simplify your answer. Round to the nearest tenth as needed.)
The variance is 14.7.
(Simplify your answer. Round to the nearest tenth as needed.)
The standard deviation is
(Simplify your answer. Round to the nearest tenth as needed.)

Math
StatisticsGeraldine opened a savings account with a principal amount of $100. The interest is 105 compounded quarterly. At the end of six months, the amount of money in her savings account will be
a. $100.00
b. $102.50
c. $102.56
d. $105.06

Math
StatisticsDoes the mean represent the center of the data?
A. The mean represents the center.
B. The mean does not represent the center because it is the largest data value.
C. The mean does not represent the center because it is not a data value.
D. The mean does not represent the center because it is the smallest data value.

Math
StatisticsThe number of credits being taken by a sample of 13 full-time college students are listed below. Find the mean, median, and mode of the data, if possible. If any measure cannot be found or does not represent the center of the data, explain why.
8 8 11 11 8 7 7 7 9 7 7 7 10
A. The mode(s) is/are 7.
(Type an integer or decimal rounded to one decimal place as needed. Use a comma to separate answers as needed.)
B. The data set does not have a mode.
Does (Do) the mode(s) represent the center of the data?
A. The mode(s) represent(s) the center.
B. The mode(s) does (do) not represent the center because it (one) is the largest data value.
C. The mode(s) does (do) not represent the center because it (they) is (are) not a data value.
D. The mode(s) does (do) not represent the center because it (one) is the smallest data value.
E. The data set does not have a mode.