Statistics Questions and Answers
Math
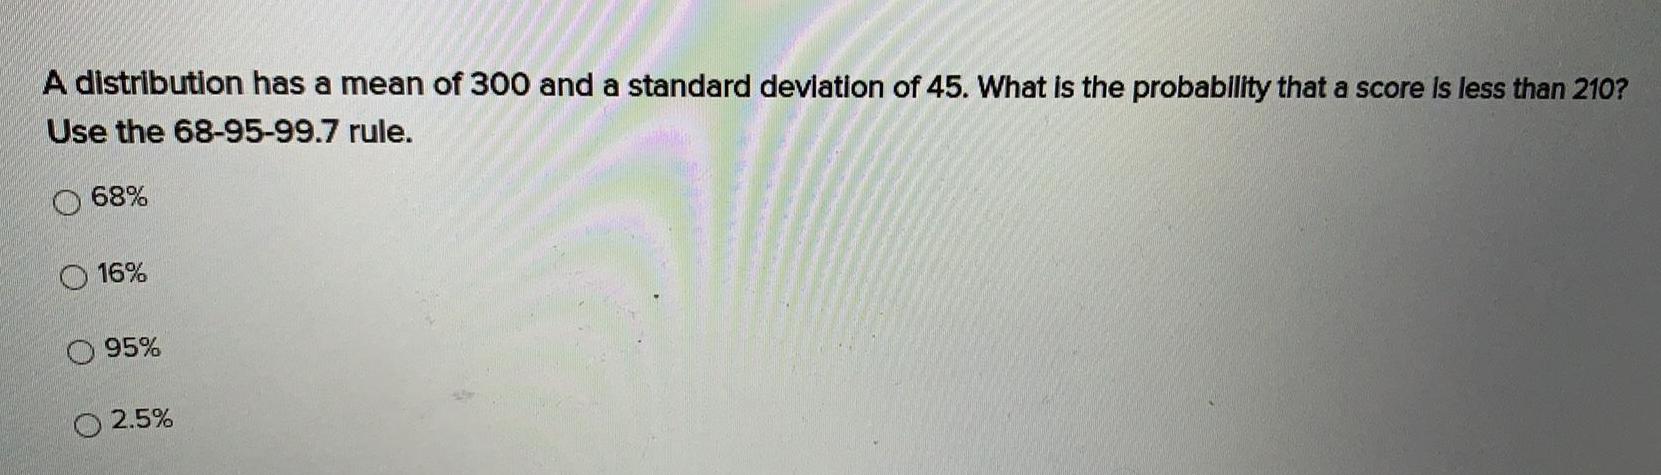
StatisticsA distribution has a mean of 300 and a standard deviation of 45. What is the probability that a score is less than 210? Use the 68-95-99.7 rule.
68%
16%
95%
2.5%
Math
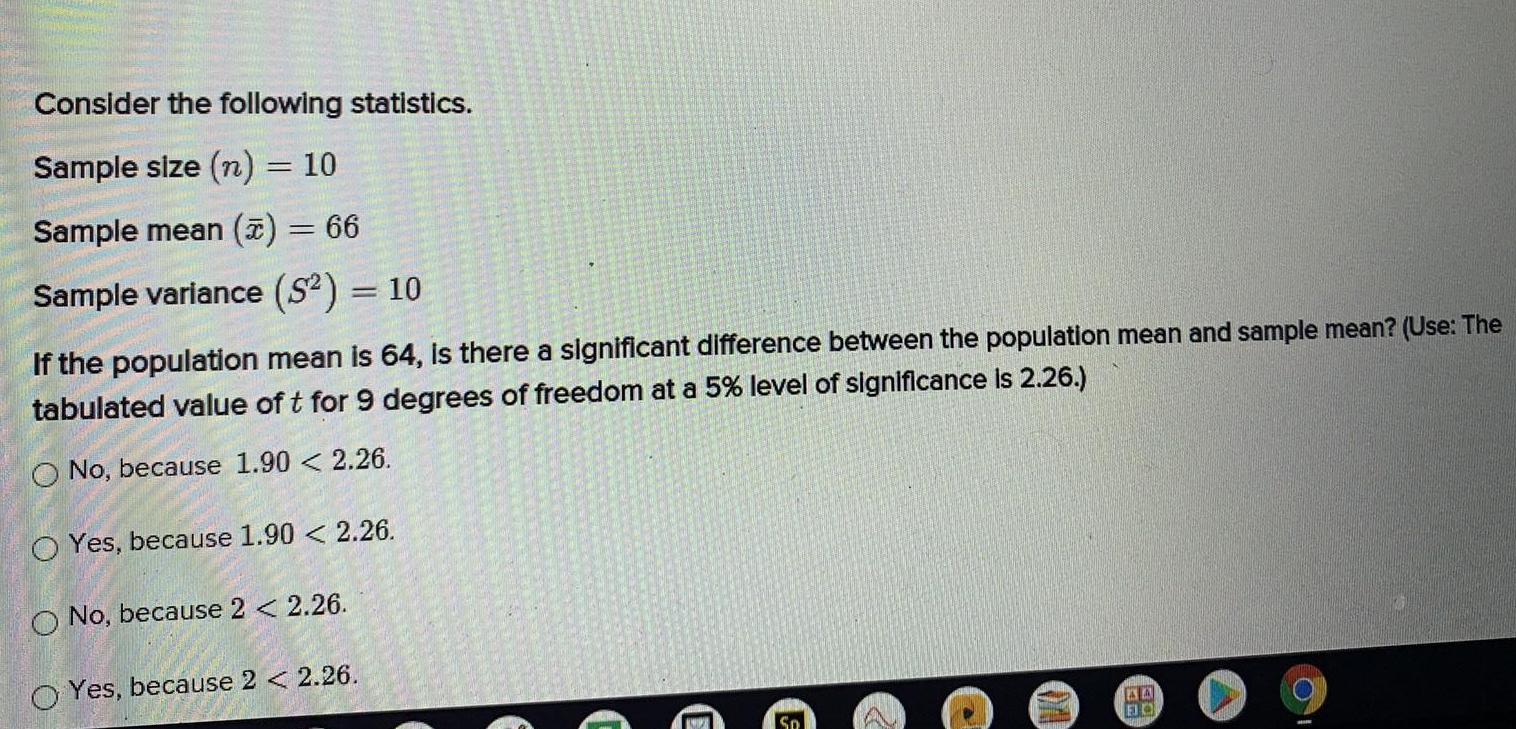
StatisticsConsider the following statistics.
Sample size (n) = 10
Sample mean (T) = 66
Sample variance (S²) = 10
If the population mean is 64, is there a significant difference between the population mean and sample mean? (Use: The tabulated value of t for 9 degrees of freedom at a 5% level of significance is 2.26.)
No, because 1.90 < 2.26.
Yes, because 1.90 < 2.26.
No, because 2 < 2.26.
Yes, because 2 < 2.26.
Math
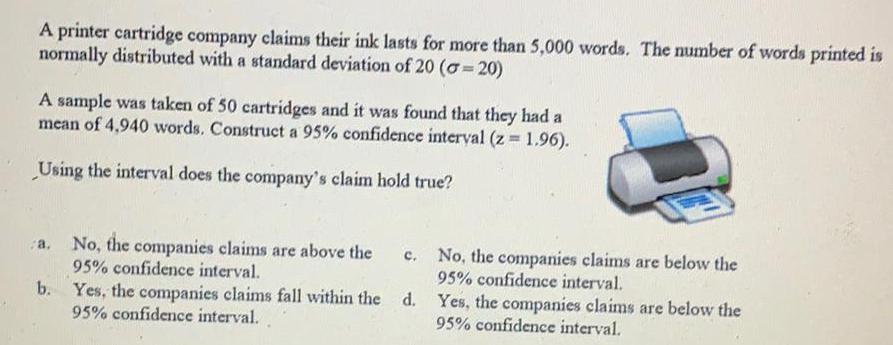
StatisticsA printer cartridge company claims their ink lasts for more than 5,000 words. The number of words printed is normally distributed with a standard deviation of 20 (σ=20) A sample was taken of 50 cartridges and it was found that they had a mean of 4,940 words. Construct a 95% confidence interval (z = 1.96).
Using the interval does the company's claim hold true?
a. No, the companies claims are above the 95% confidence interval.
b.Yes, the companies claims fall within the 95% confidence interval.
c. No, the companies claims are below the 95% confidence interval.
d. Yes, the companies claims are below the 95% confidence interval.
Math
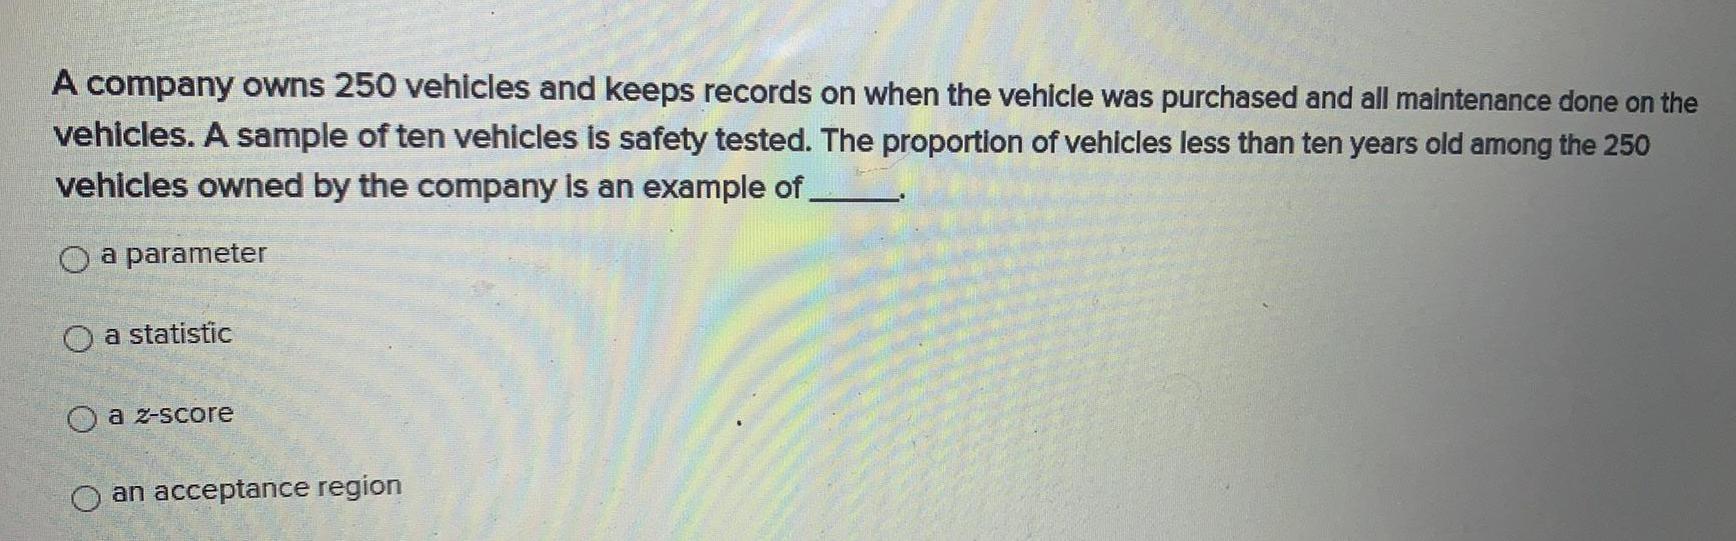
StatisticsA company owns 250 vehicles and keeps records on when the vehicle was purchased and all maintenance done on the vehicles. A sample of ten vehicles is safety tested. The proportion of vehicles less than ten years old among the 250 vehicles owned by the company is an example of
a parameter
a statistic
a z-score
an acceptance region
Math
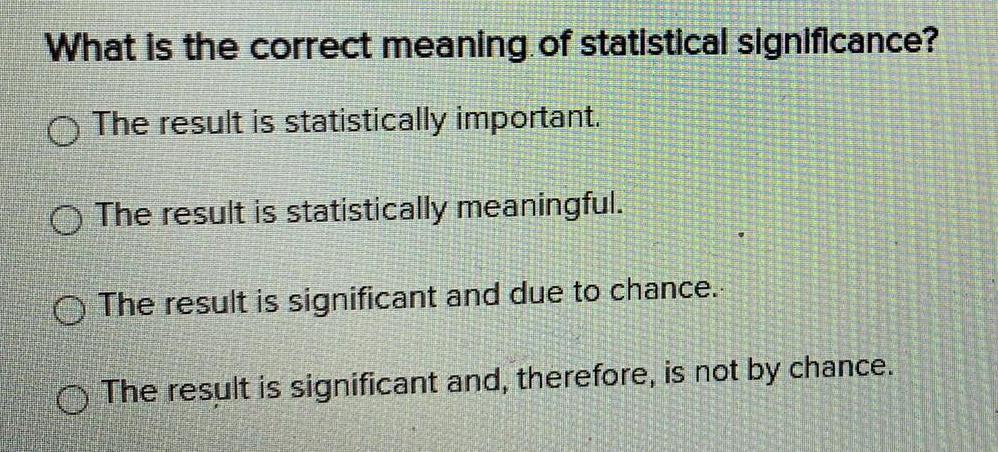
StatisticsWhat is the correct meaning of statistical significance?
The result is statistically important.
The result is statistically meaningful.
The result is significant and due to chance..
The result is significant and, therefore, is not by chance.
Math
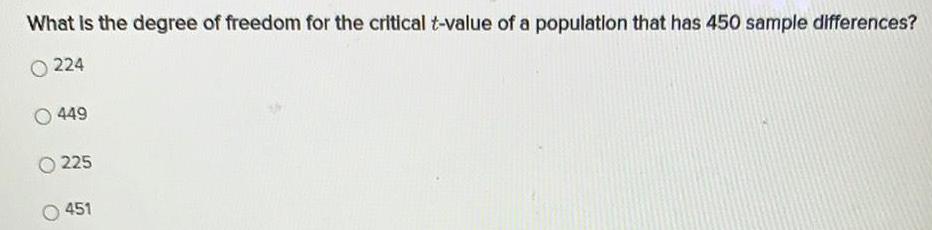
StatisticsWhat is the degree of freedom for the critical t-value of a population that has 450 sample differences?
224
449
225
451
Math
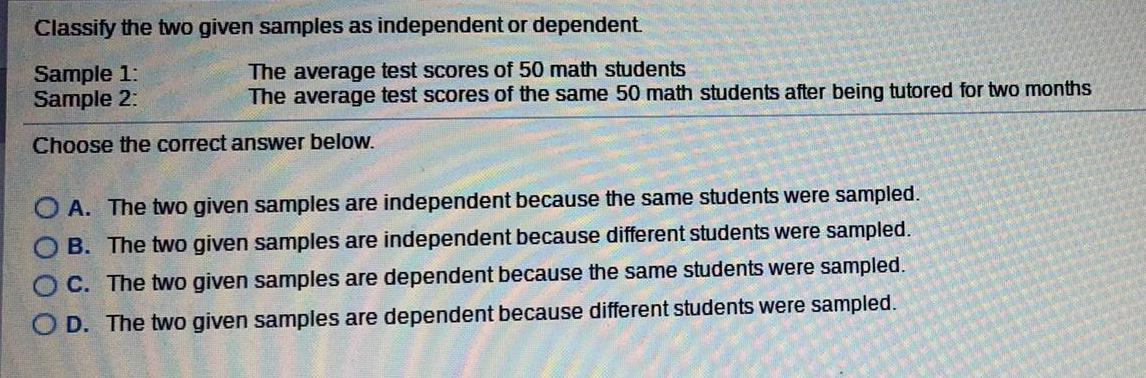
StatisticsClassify the two given samples as independent or dependent.
Sample 1:The average test scores of 50 math students
Sample 2: The average test scores of the same 50 math students after being tutored for two months
Choose the correct answer below.
A. The two given samples are independent because the same students were sampled.
B. The two given samples are independent because different students were sampled.
C. The two given samples are dependent because the same students were sampled.
D. The two given samples are dependent because different students were sampled.
Math
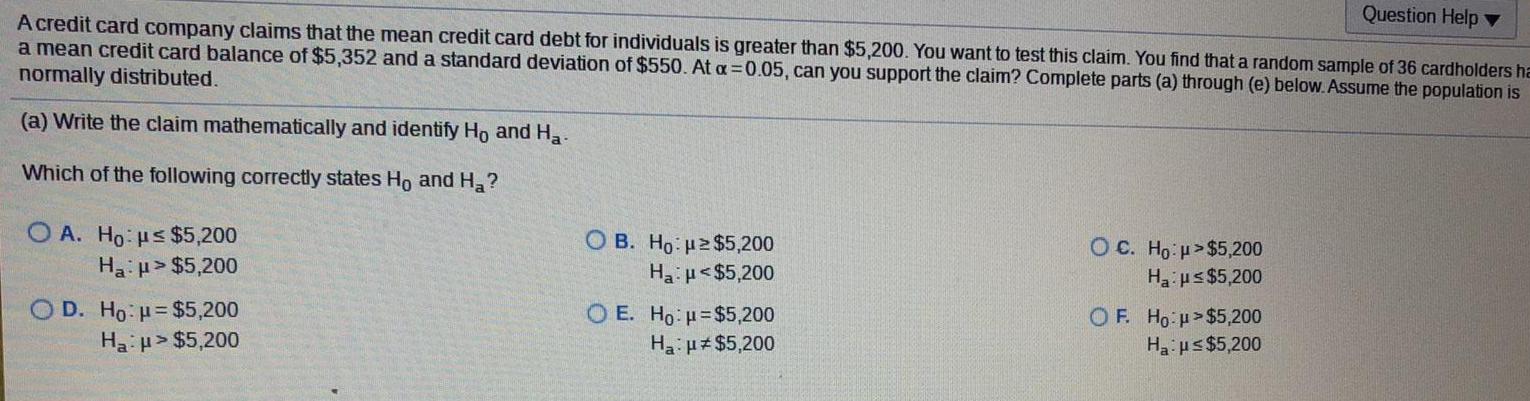
StatisticsA credit card company claims that the mean credit card debt for individuals is greater than $5,200. You want to test this claim. You find that a random sample of 36 cardholders a mean credit card balance of $5,352 and a standard deviation of $550. At a=0.05, can you support the claim? Complete parts (a) through (e) below. Assume the population is normally distributed.
(a) Write the claim mathematically and identify Ho and Ha-
Which of the following correctly states Ho and Ha?
A. Ho us $5,200
Ha:p>$5,200
B. Ho: 2$5,200
Ha:μ<$5,200
C. Ho u>$5,200
Ha us$5,200
D. Ho: μ=$5,200
Ha:p>$5,200
E. Ho: H=$5,200
Ha:μ≠$5,200
F. Ho: $5,200
Ha:μ≤ $5,200

Math
StatisticsTest a claim that the mean amount of carbon monoxide in the air in U.S. cities is less than 2.31 parts per million. It was found that the mean amount of carbon monoxide in the air for the random sample of 65 cities is 2.37 parts per million and the standard deviation is 2.12 parts per million. At a=0.10, can the claim be supported? Complete parts (a) through (e) below. Assume the population is normally distributed.
(a) Identify the claim and state Ho and Ha. Which of the following correctly states Ho and Ha?
Math
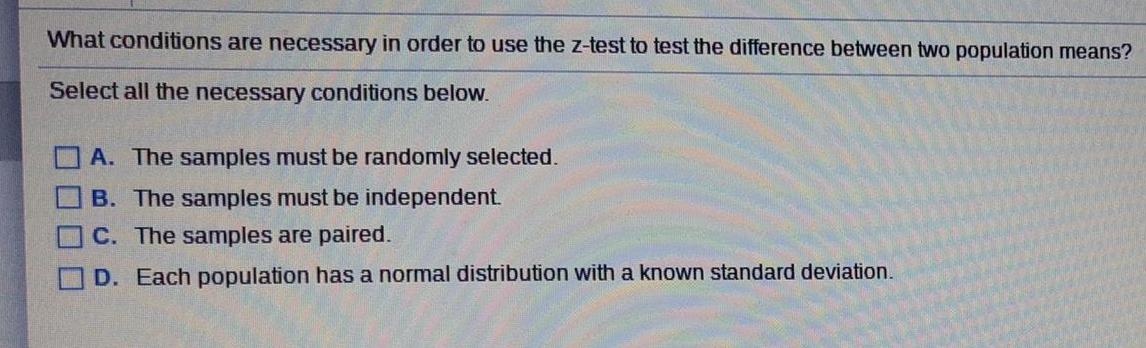
StatisticsWhat conditions are necessary in order to use the z-test to test the difference between two population means?
Select all the necessary conditions below.
A. The samples must be randomly selected.
B. The samples must be independent.
C. The samples are paired.
D. Each population has a normal distribution with a known standard deviation.
Math
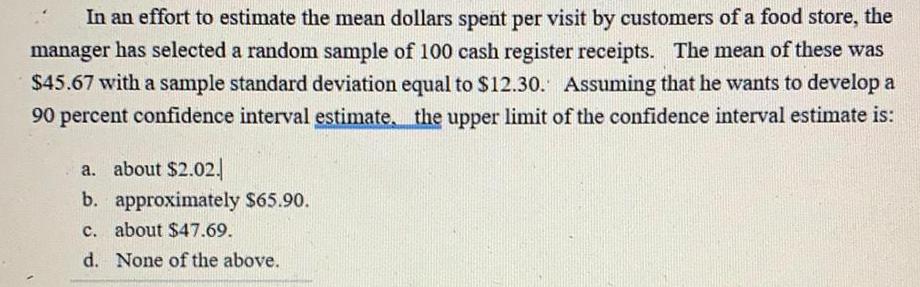
StatisticsIn an effort to estimate the mean dollars spent per visit by customers of a food store, the manager has selected a random sample of 100 cash register receipts. The mean of these was $45.67 with a sample standard deviation equal to $12.30. Assuming that he wants to develop a 90 percent confidence interval estimate the upper limit of the confidence interval estimate is:
a. about $2.02.
b. approximately $65.90.
c. about $47.69.
d. None of the above.
Math
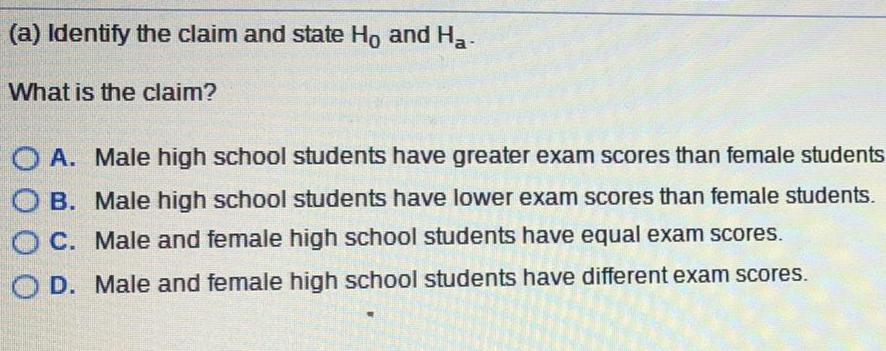
StatisticsIdentify the claim and state Ho and H₂.
What is the claim?
A. Male high school students have greater exam scores than female students
B. Male high school students have lower exam scores than female students.
C. Male and female high school students have equal exam scores.
D. Male and female high school students have different exam scores.
Math
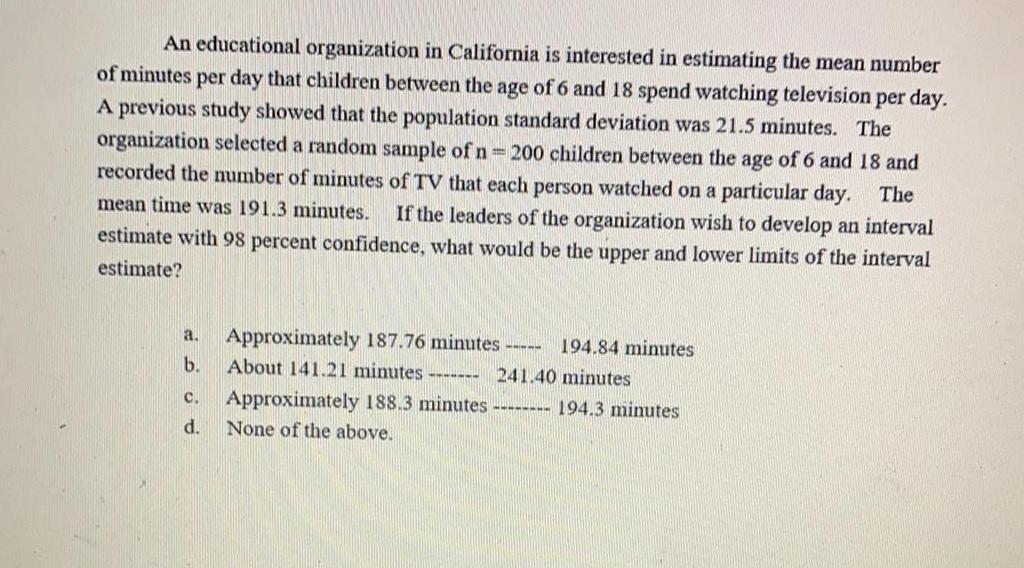
StatisticsAn educational organization in California is interested in estimating the mean number of minutes per day that children between the age of 6 and 18 spend watching television per day. A previous study showed that the population standard deviation was 21.5 minutes. The organization selected a random sample of n = 200 children between the age of 6 and 18 and recorded the number of minutes of TV that each person watched on a particular day. The mean time was 191.3 minutes. If the leaders of the organization wish to develop an interval estimate with 98 percent confidence, what would be the upper and lower limits of the interval estimate?
a. Approximately 187.76 minutes ----- 194.84 minutes
b. About 141.21 ------ minutes 241.40 minutes
c. Approximately 188.3 minutes -------- 194.3 minutes
d. None of the above.
Math
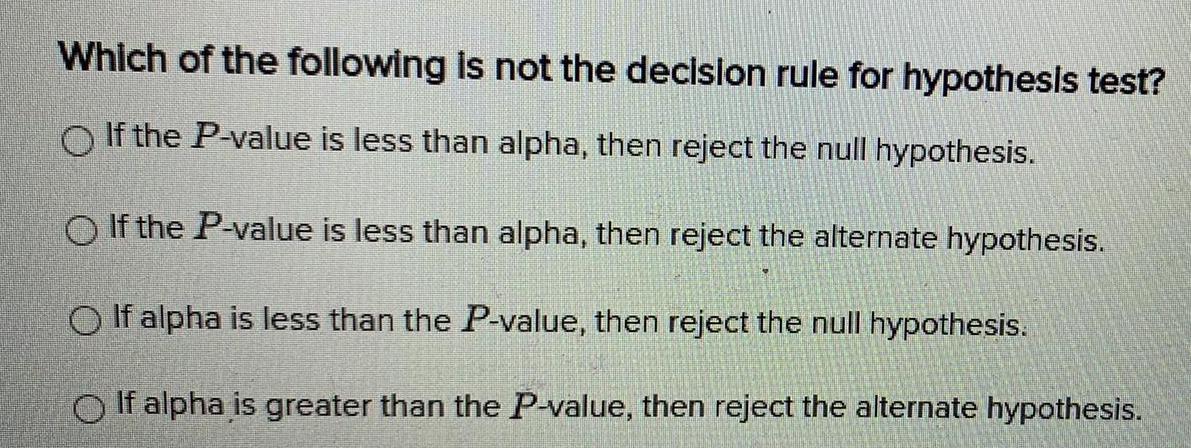
StatisticsWhich of the following is not the decision rule for hypothesis test?
If the P-value is less than alpha, then reject the null hypothesis.
If the P-value is less than alpha, then reject the alternate hypothesis.
If alpha is less than the P-value, then reject the null hypothesis.
If alpha is greater than the P-value, then reject the alternate hypothesis.
Math
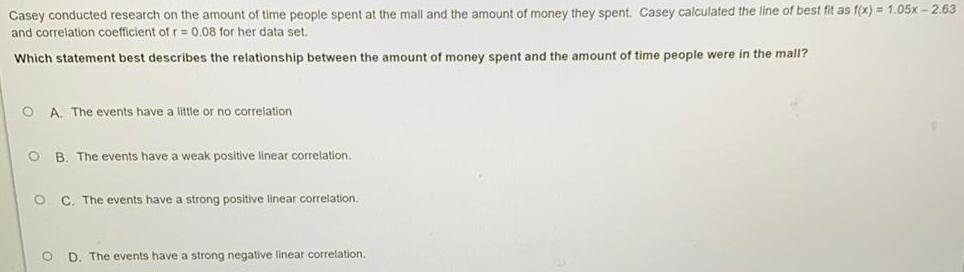
StatisticsCasey conducted research on the amount of time people spent at the mall and the amount of money they spent. Casey calculated the line of best fit as f(x) = 1.05x-2.63 and correlation coefficient of r = 0.08 for her data set. Which statement best describes the relationship between the amount of money spent and the amount of time people were in the mall?
A. The events have a little or no correlation
B. The events have a weak positive linear correlation.
C. The events have a strong positive linear correlation.
D. The events have a strong negative linear correlation.
Math
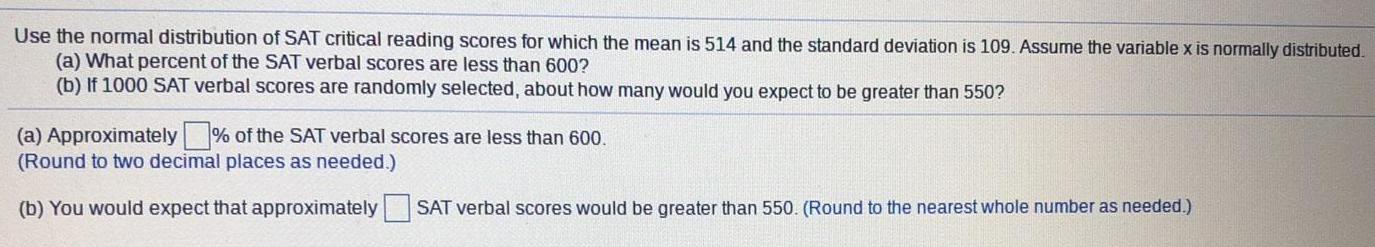
StatisticsUse the normal distribution of SAT critical reading scores for which the mean is 514 and the standard deviation is 109. Assume the variable x is normally distributed.
(a) What percent of the SAT verbal scores are less than 600?
(b) If 1000 SAT verbal scores are randomly selected, about how many would you expect to be greater than 550?
Math
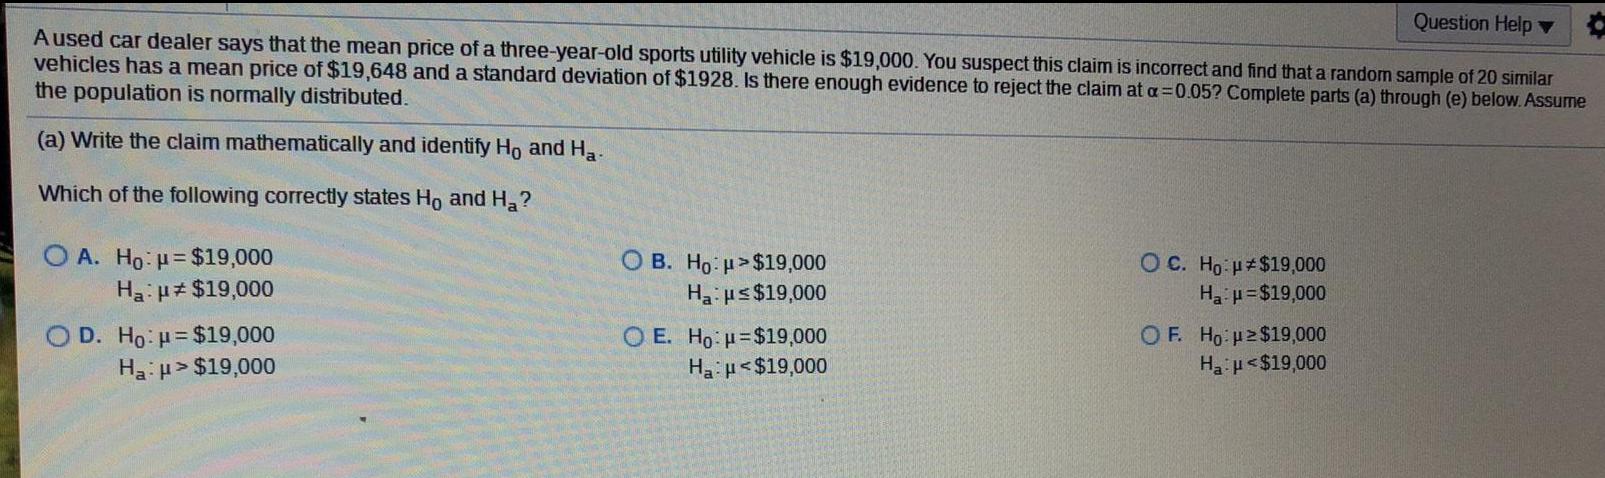
StatisticsQuestion Help Aused car dealer says that the mean price of a three-year-old sports utility vehicle is $19,000. You suspect this claim is incorrect and find that a random sample of 20 similar vehicles has a mean price of $19,648 and a standard deviation of $1928. Is there enough evidence to reject the claim at a=0.05? Complete parts (a) through (e) below. Assume the population is normally distributed.
Math
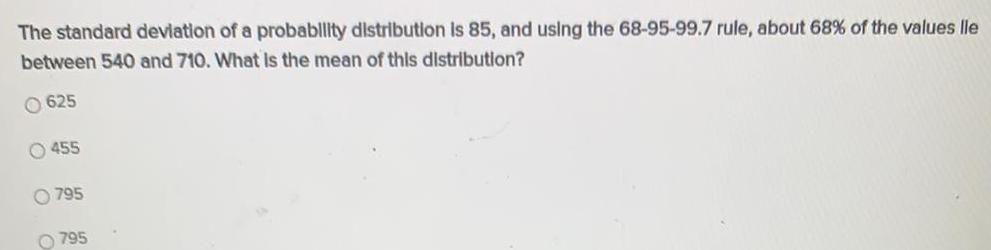
StatisticsThe standard deviation of a probability distribution is 85, and using the 68-95-99.7 rule, about 68% of the values lle between 540 and 710. What is the mean of this distribution?
625
455
795
795
Math
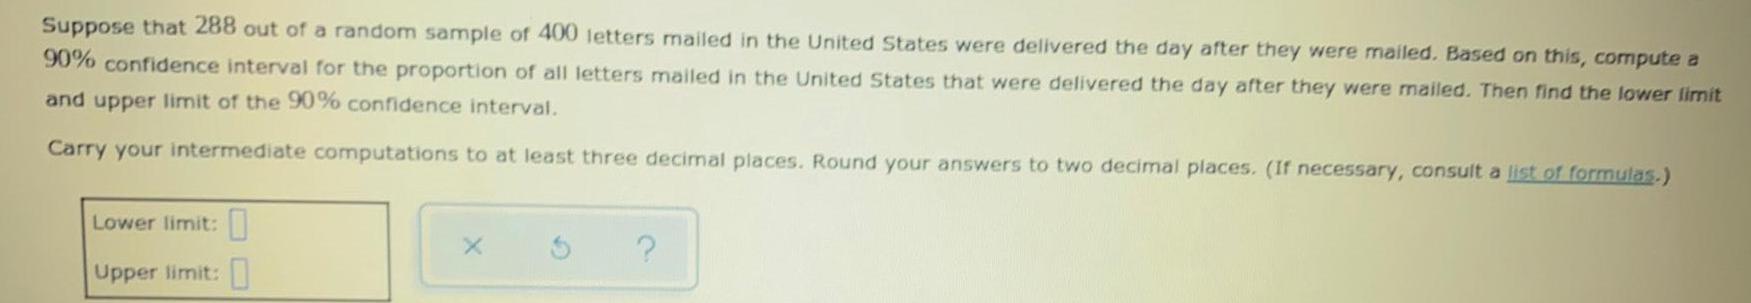
StatisticsSuppose that 288 out of a random sample of 400 letters mailed in the United States were delivered the day after they were mailed. Based on this, compute a 90% confidence interval for the proportion of all letters mailed in the United States that were delivered the day after they were mailed. Then find the lower limit and upper limit of the 90% confidence interval.
Math
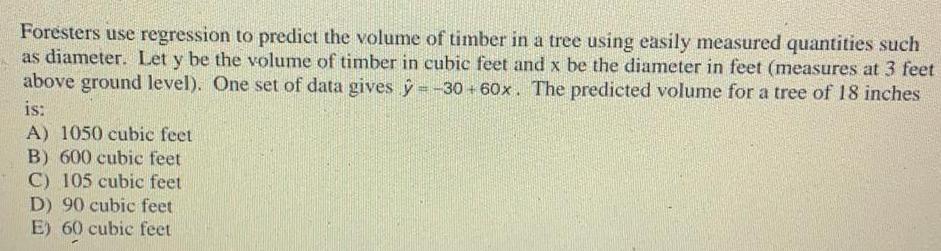
StatisticsForesters use regression to predict the volume of timber in a tree using easily measured quantities such as diameter. Let y be the volume of timber in cubic feet and x be the diameter in feet (measures at 3 feet above ground level). One set of data gives y=-30+60x. The predicted volume for a tree of 18 inches is:
A) 1050 cubic feet
B) 600 cubic feet
C) 105 cubic feet
D) 90 cubic feet
E) 60 cubic feet
Math
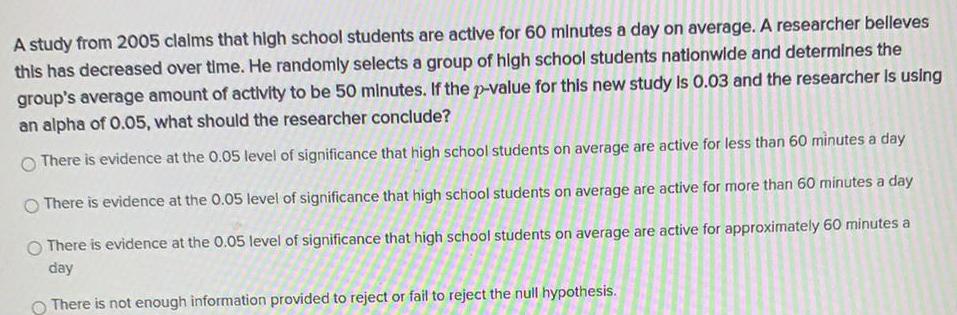
StatisticsA study from 2005 claims that high school students are active for 60 minutes a day on average. A researcher belleves this has decreased over time. He randomly selects a group of high school students nationwide and determines the group's average amount of activity to be 50 minutes. If the p-value for this new study Is 0.03 and the researcher is using an alpha of 0.05, what should the researcher conclude?
There is evidence at the 0.05 level of significance that high school students on average are active for less than 60 minutes a day
There is evidence at the 0.05 level of significance that high school students on average are active for more than 60 minutes a day
There is evidence at the 0.05 level of significance that high school students on average are active for approximately 60 minutes a day
There is not enough information provided to reject or fail to reject the null hypothesis.
Math
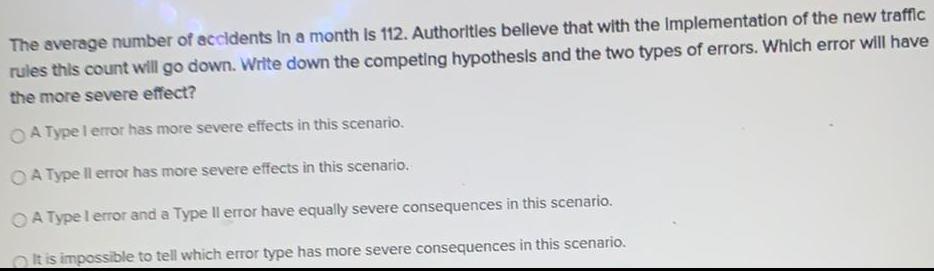
StatisticsThe average number of accidents in a month is 112. Authorities believe that with the implementation of the new traffic rules this count will go down. Write down the competing hypothesis and the two types of errors. Which error will have the more severe effect?
A Type I error has more severe effects in this scenario.
A Type Il error has more severe effects in this scenario.
A Type I error and a Type Il error have equally severe consequences in this scenario.
It is impossible to tell which error type has more severe consequences in this scenario.
Math
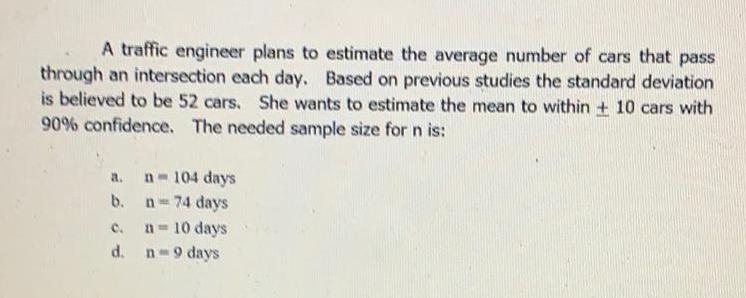
StatisticsA traffic engineer plans to estimate the average number of cars that pass through an intersection each day. Based on previous studies the standard deviation is believed to be 52 cars. She wants to estimate the mean to within + 10 cars with 90% confidence. The needed sample size for n is:
a. n=104 days
b. n = 74 days
c. n = 10 days
d. n=9 days
Math
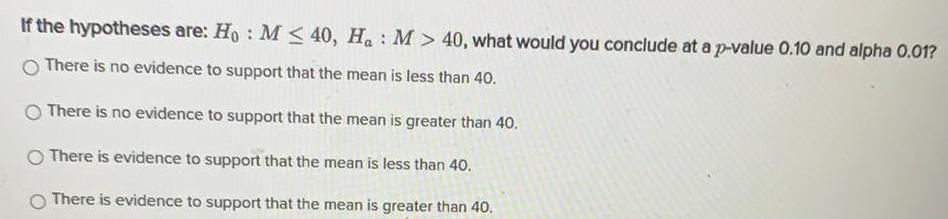
StatisticsIf the hypotheses are: Ho: M≤ 40, Ha : M > 40, what would you conclude at a p-value 0.10 and alpha 0.01?
There is no evidence to support that the mean is less than 40.
There is no evidence to support that the mean is greater than 40.
There is evidence to support that the mean is less than 40.
There is evidence to support that the mean is greater than 40.
Math
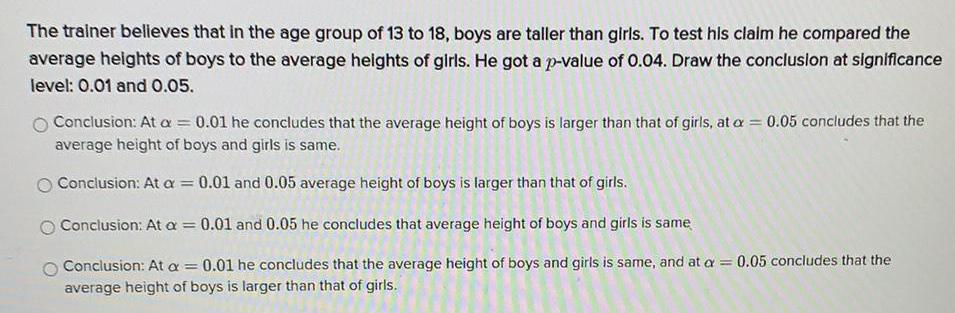
StatisticsThe trainer believes that in the age group of 13 to 18, boys are taller than girls. To test his claim he compared the average heights of boys to the average heights of girls. He got a p-value of 0.04. Draw the conclusion at significance level: 0.01 and 0.05.
Conclusion: At a = 0.01 he concludes that the average height of boys is larger than that of girls, at a = 0.05 concludes that the
average height of boys and girls is same.
Conclusion: At a = 0.01 and 0.05 average height of boys is larger than that of girls.
Conclusion: At a = 0.01 and 0.05 he concludes that average height of boys and girls is same
Conclusion: At a = = 0.01 he concludes that the average height of boys and girls is same, and at a = 0.05 concludes that the average height of boys is larger than that of girls.
Math
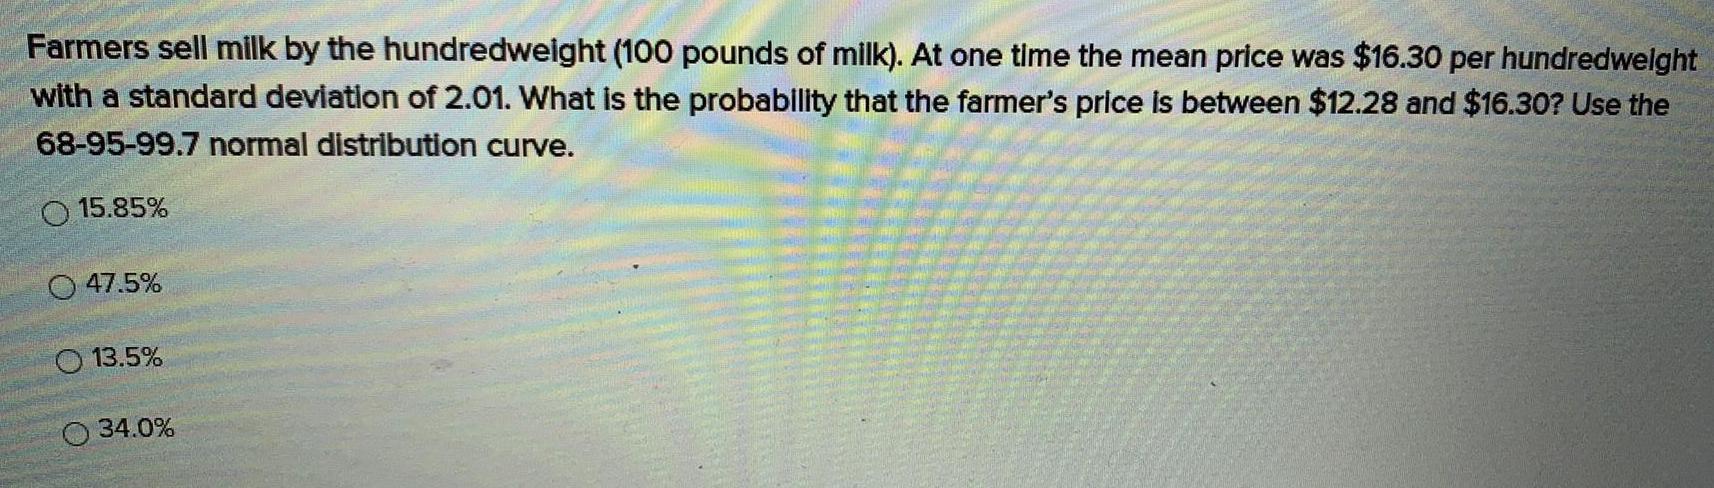
StatisticsFarmers sell milk by the hundredweight (100 pounds of milk). At one time the mean price was $16.30 per hundredweight with a standard deviation of 2.01. What is the probability that the farmer's price is between $12.28 and $16.30? Use the 68-95-99.7 normal distribution curve.
15.85%
47.5%
13.5%
34.0%
Math
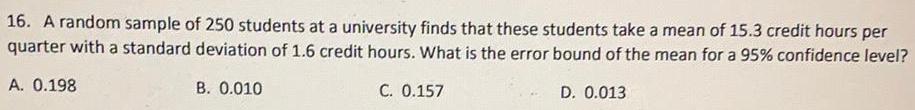
StatisticsA random sample of 250 students at a university finds that these students take a mean of 15.3 credit hours per quarter with a standard deviation of 1.6 credit hours. What is the error bound of the mean for a 95% confidence level?
A. 0.198
B. 0.010
C. 0.157
D. 0.013
Math
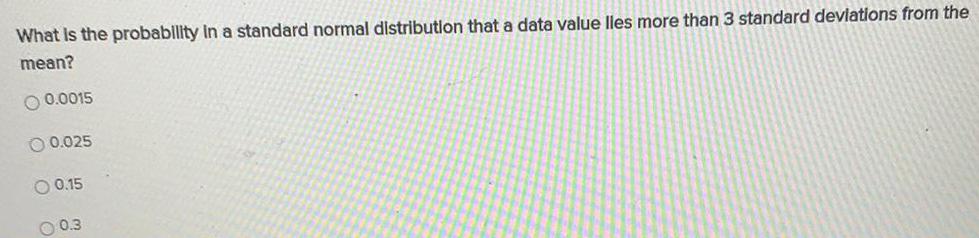
StatisticsWhat is the probability in a standard normal distribution that a data value lles more than 3 standard deviations from the mean?
0.0015
0.025
0.15
0.3
Math
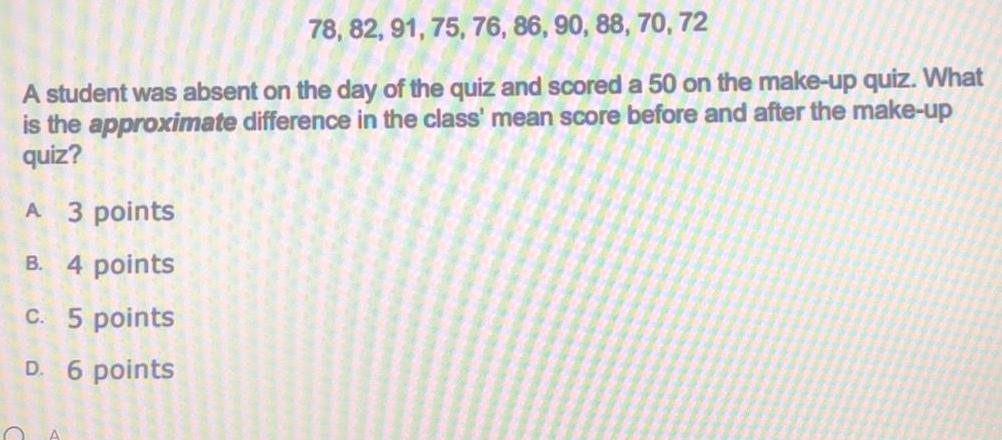
Statistics78, 82, 91, 75, 76, 86, 90, 88, 70, 72
A student was absent on the day of the quiz and scored a 50 on the make-up quiz. What
is the approximate difference in the class' mean score before and after the make-up quiz?
A. 3 points
B. 4 points
C. 5 points
D. 6 points
Math
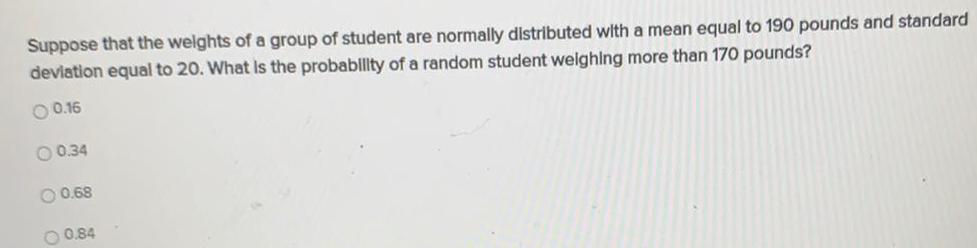
StatisticsSuppose that the weights of a group of student are normally distributed with a mean equal to 190 pounds and standard deviation equal to 20. What is the probability of a random student weighing more than 170 pounds?
0.16
0.34
0.68
0.84
Math
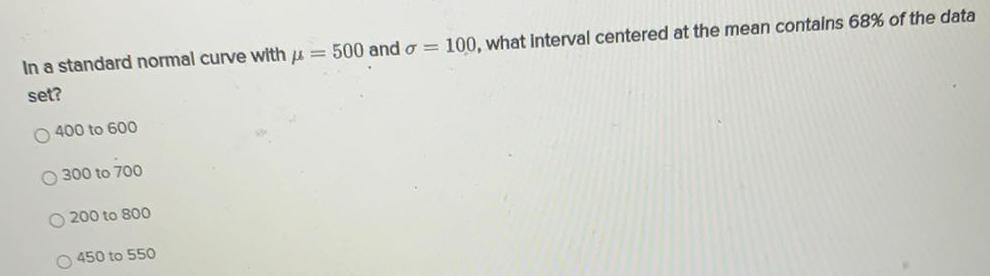
StatisticsIn a standard normal curve with = 500 and o= 100, what interval centered at the mean contains 68% of the data set?
400 to 600
300 to 700
200 to 800
450 to 550
Math
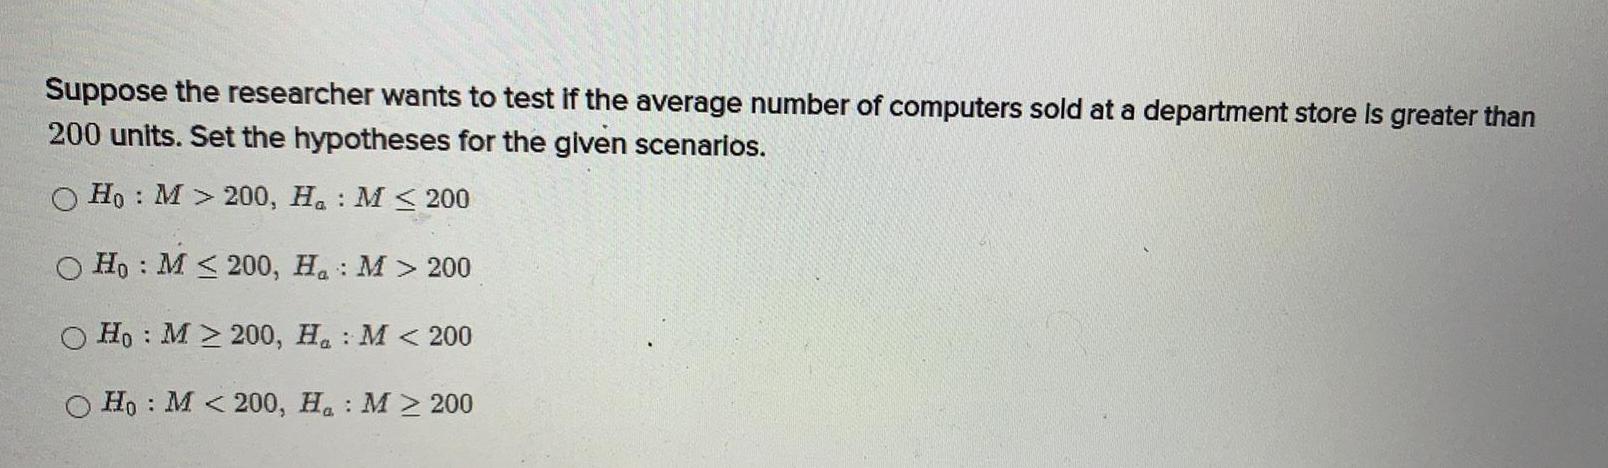
StatisticsSuppose the researcher wants to test if the average number of computers sold at a department store is greater than 200 units. Set the hypotheses for the given scenarios.
Ho: M> 200, Ha: M≤ 200
Ho:M≤200, Ha :M > 200
Ho: M≥200, H M < 200
Ho: M<200, Ha: M≥200
Math
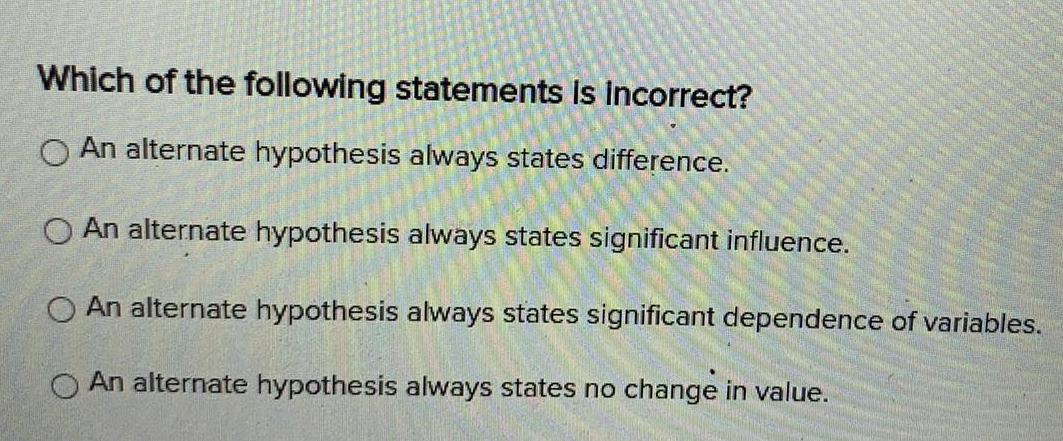
StatisticsWhich of the following statements is incorrect?
An alternate hypothesis always states difference.
An alternate hypothesis always states significant influence.
An alternate hypothesis always states significant dependence of variables.
An alternate hypothesis always states no change in value.
Math
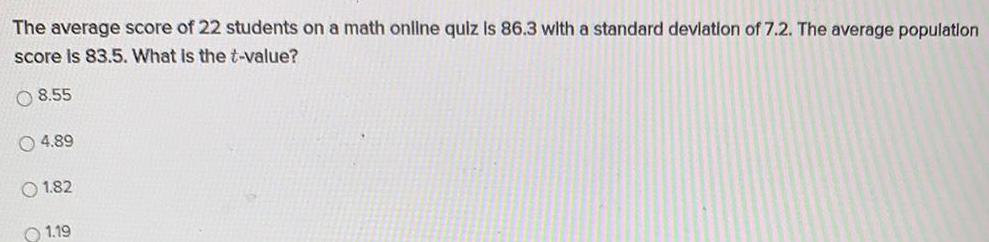
StatisticsThe average score of 22 students on a math online quiz Is 86.3 with a standard deviation of 7.2. The average population score is 83.5. What is the t-value?
8.55
4.89
1.82
1.19
Math
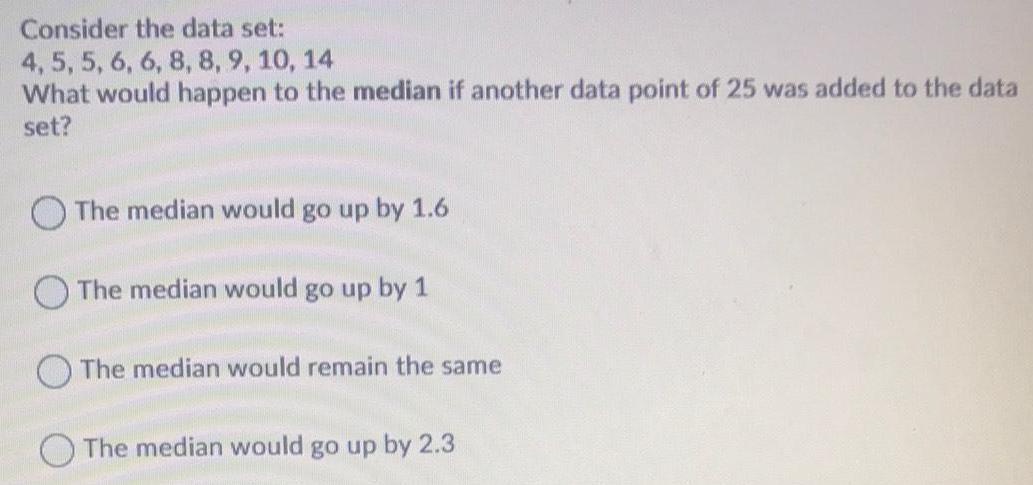
StatisticsConsider the data set:
4, 5, 5, 6, 6, 8, 8, 9, 10, 14
What would happen to the median if another data point of 25 was added to the data set?
The median would go up by 1.6
The median would go up by 1
The median would remain the same
The median would go up by 2.3
Math
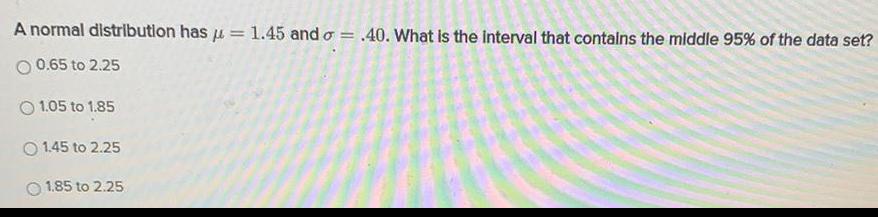
StatisticsA normal distribution has µ = 1.45 and σ = .40. What is the interval that contains the middle 95% of the data set?
0.65 to 2.25
1.05 to 1.85
1.45 to 2.25
1.85 to 2.25
Math
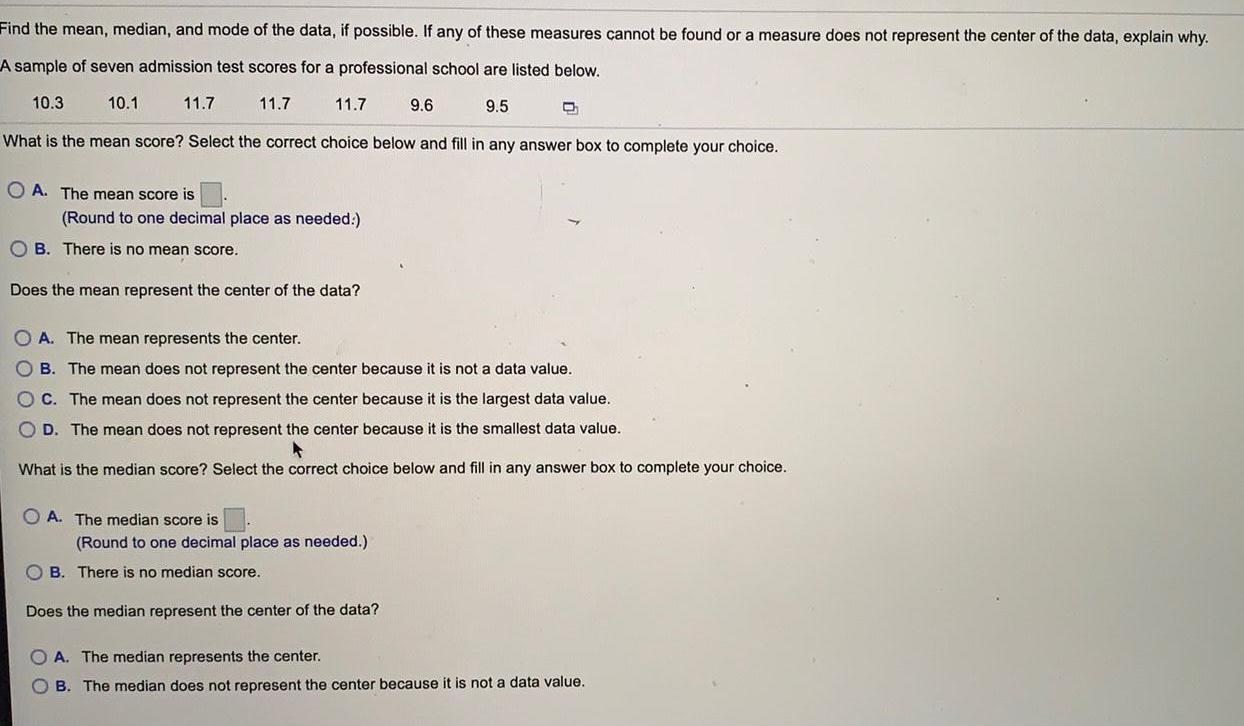
StatisticsFind the mean, median, and mode of the data, if possible. If any of these measures cannot be found or a measure does not represent the center of the data, explain why.
A sample of seven admission test scores for a professional school are listed below.
10.3
11.7
11.7
What is the mean score? Select the correct choice below and fill in any answer box to complete your choice.
10.1
11.7
A. The mean score is
(Round to one decimal place as needed:)
B. There is no mean score.
Does the mean represent the center of the data?
A. The median score is
9.6
(Round to one decimal place as needed.)
B. There is no median score.
Does the median represent the center of the data?
9.5
A. The mean represents the center.
B. The mean does not represent the center because it is not a data value.
C. The mean does not represent the center because it is the largest data value.
D. The mean does not represent the center because it is the smallest data value.
What is the median score? Select the correct choice below and fill in any answer box to complete your choice.
C
A. The median represents the center.
B. The median does not represent the center because it is not a data value.
Math
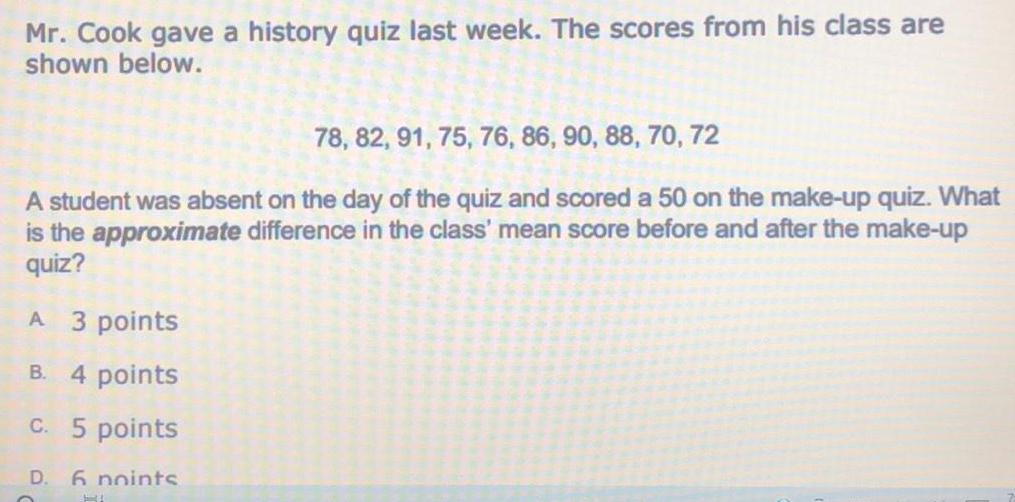
StatisticsMr. Cook gave a history quiz last week. The scores from his class are
shown below.
78, 82, 91, 75, 76, 86, 90, 88, 70, 72
A student was absent on the day of the quiz and scored a 50 on the make-up quiz. What
is the approximate difference in the class' mean score before and after the make-up
quiz?
A 3 points
B. 4 points
c. 5 points
D. 6 noints
Math
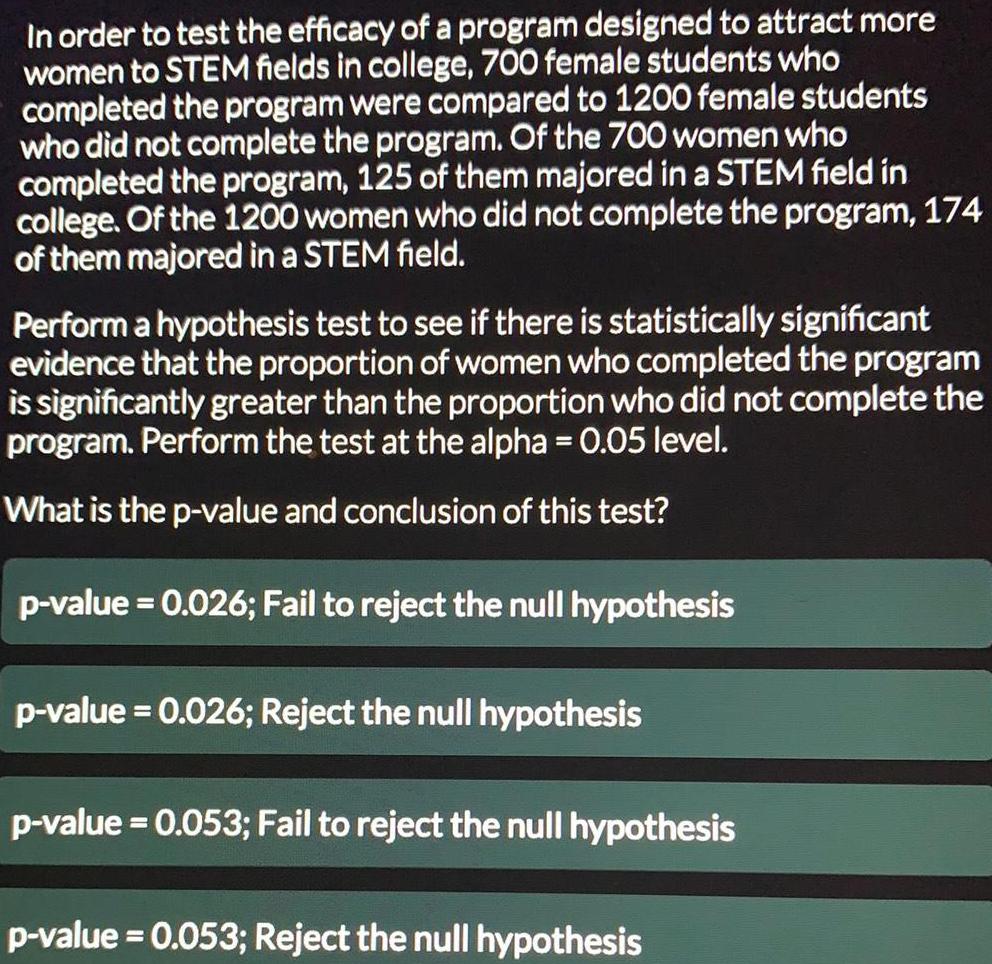
StatisticsIn order to test the efficacy of a program designed to attract more women to STEM fields in college, 700 female students who completed the program were compared to 1200 female students who did not complete the program. Of the 700 women who completed the program, 125 of them majored in a STEM field in college. Of the 1200 women who did not complete the program, 174 of them majored in a STEM field.
Perform a hypothesis test to see if there is statistically significant evidence that the proportion of women who completed the program is significantly greater than the proportion who did not complete the program. Perform the test at the alpha = 0.05 level.
What is the p-value and conclusion of this test?
p-value = 0.026; Fail to reject the null hypothesis
p-value = 0.026; Reject the null hypothesis
p-value = 0.053; Fail to reject the null hypothesis
p-value = 0.053; Reject the null hypothesis
Math
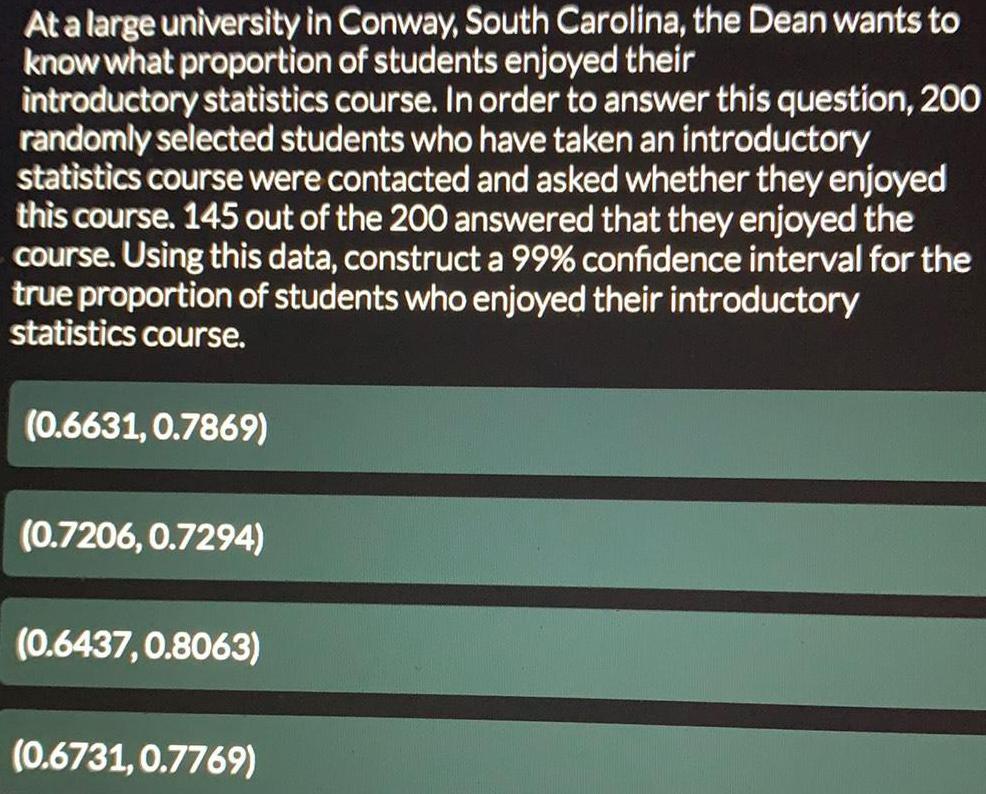
StatisticsAt a large university in Conway, South Carolina, the Dean wants to
know what proportion of students enjoyed their
introductory statistics course. In order to answer this question, 200
randomly selected students who have taken an introductory
statistics course were contacted and asked whether they enjoyed
this course. 145 out of the 200 answered that they enjoyed the
course. Using this data, construct a 99% confidence interval for the
true proportion of students who enjoyed their introductory
statistics course.
(0.6631,0.7869)
(0.7206, 0.7294)
(0.6437,0.8063)
(0.6731, 0.7769)
Math
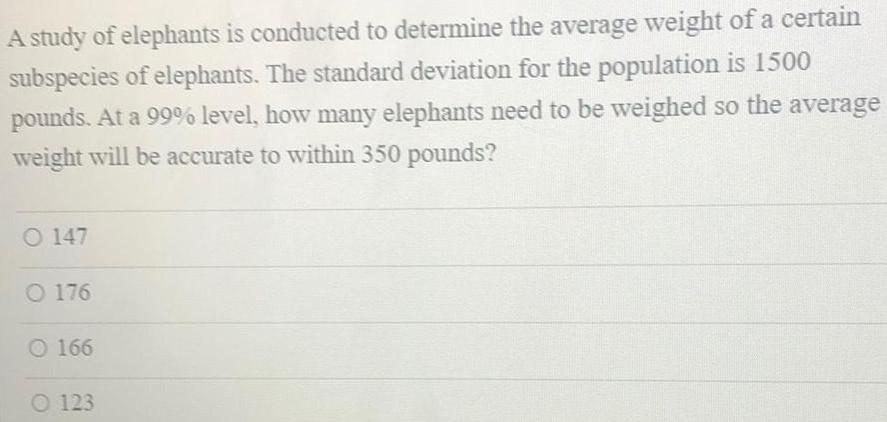
StatisticsA study of elephants is conducted to determine the average weight of a certain subspecies of elephants. The standard deviation for the population is 1500 pounds. At a 99% level, how many elephants need to be weighed so the average weight will be accurate to within 350 pounds?
147
176
166
123
Math
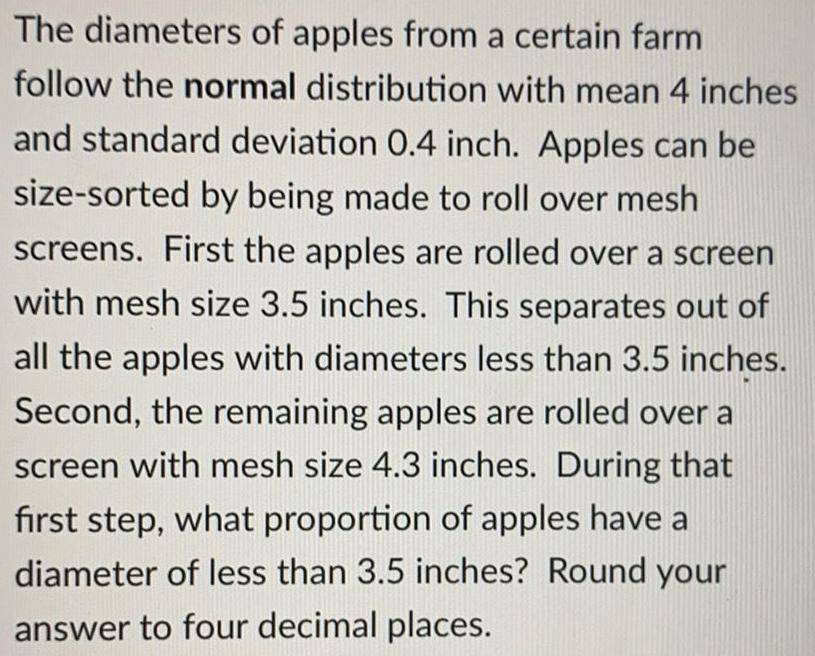
StatisticsThe diameters of apples from a certain farm follow the normal distribution with mean 4 inches and standard deviation 0.4 inch. Apples can be size-sorted by being made to roll over mesh screens. First the apples are rolled over a screen with mesh size 3.5 inches. This separates out of all the apples with diameters less than 3.5 inches. Second, the remaining apples are rolled over a screen with mesh size 4.3 inches. During that first step, what proportion of apples have a diameter of less than 3.5 inches? Round your answer to four decimal places.
Math
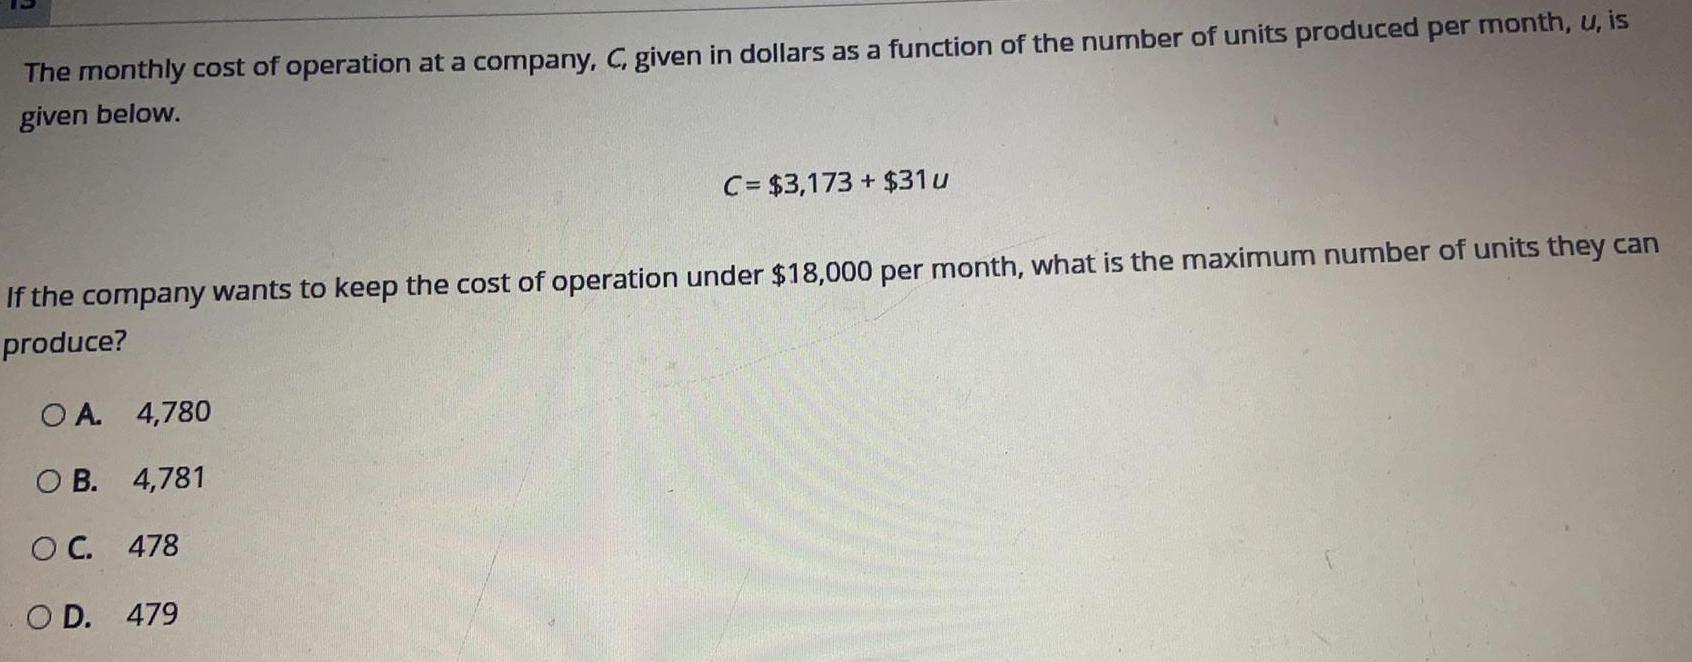
StatisticsThe monthly cost of operation at a company, C, given in dollars as a function of the number of units produced per month, u, is given below.
C= $3,173 + $31u
If the company wants to keep the cost of operation under $18,000 per month, what is the maximum number of units they can produce?
A. 4,780
B. 4,781
C. 478
D. 479

Math
StatisticsDescribe how you know the difference between a binomial distribution and other probability distributions. Give an example of a scenario involving a binomial distribution not discussed in this lesson.
Math
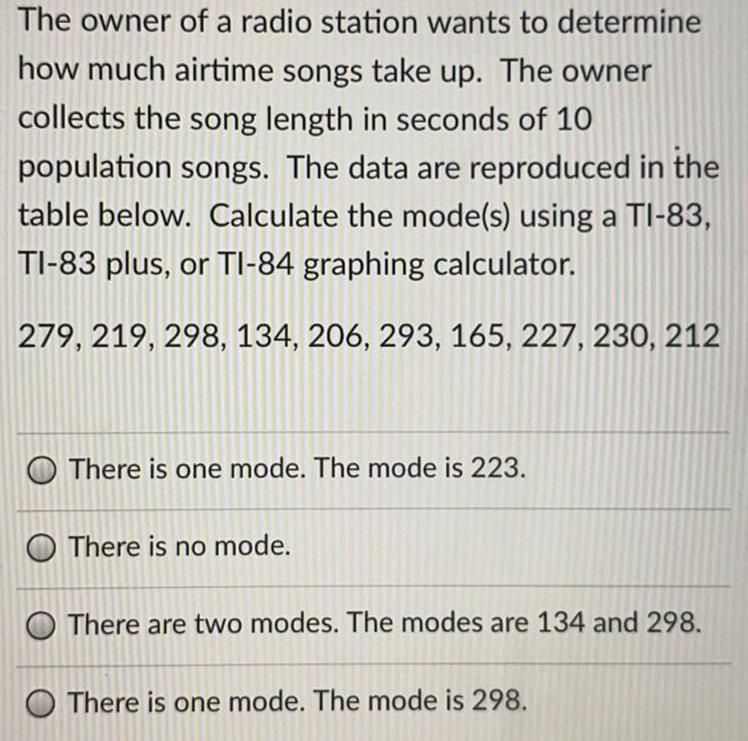
StatisticsThe owner of a radio station wants to determine how much airtime songs take up. The owner collects the song length in seconds of 10 population songs. The data are reproduced in the table below. Calculate the mode(s) using a TI-83, TI-83 plus, or TI-84 graphing calculator.
279, 219, 298, 134, 206, 293, 165, 227, 230, 212
There is one mode. The mode is 223.
There is no mode.
There are two modes. The modes are 134 and 298.
There is one mode. The mode is 298.
Math
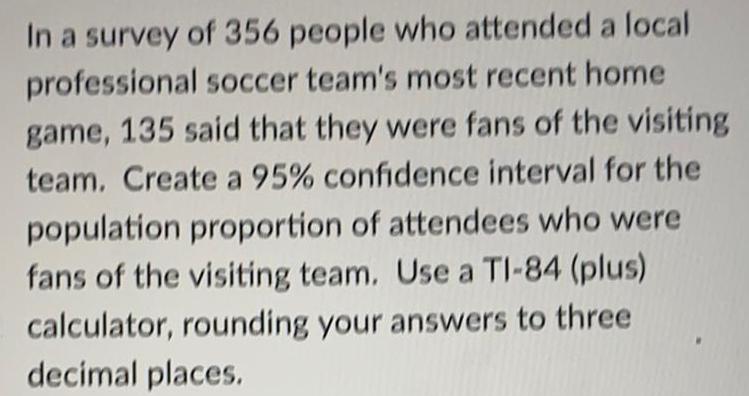
StatisticsIn a survey of 356 people who attended a local professional soccer team's most recent home game, 135 said that they were fans of the visiting team. Create a 95% confidence interval for the population proportion of attendees who were fans of the visiting team. Use a TI-84 (plus) calculator, rounding your answers to three decimal places.
Math
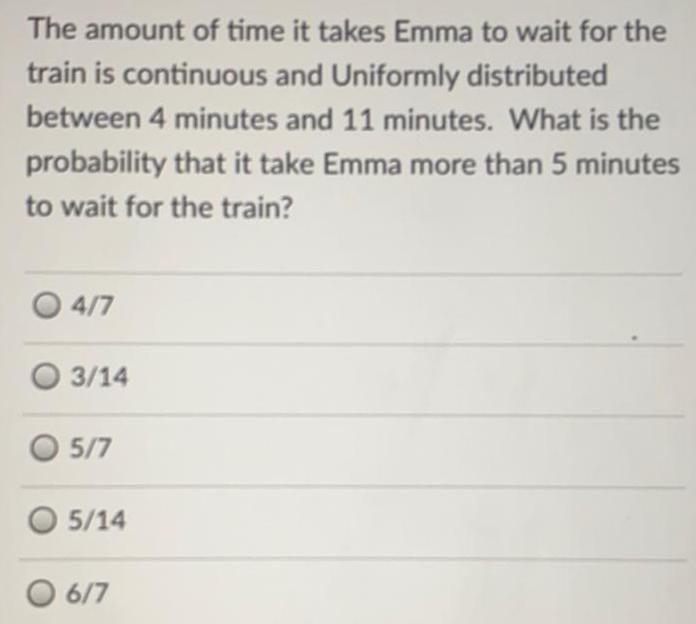
StatisticsThe amount of time it takes Emma to wait for the train is continuous and Uniformly distributed between 4 minutes and 11 minutes. What is the probability that it take Emma more than 5 minutes to wait for the train?
4/7
3/14
5/7
5/14
6/7
Math
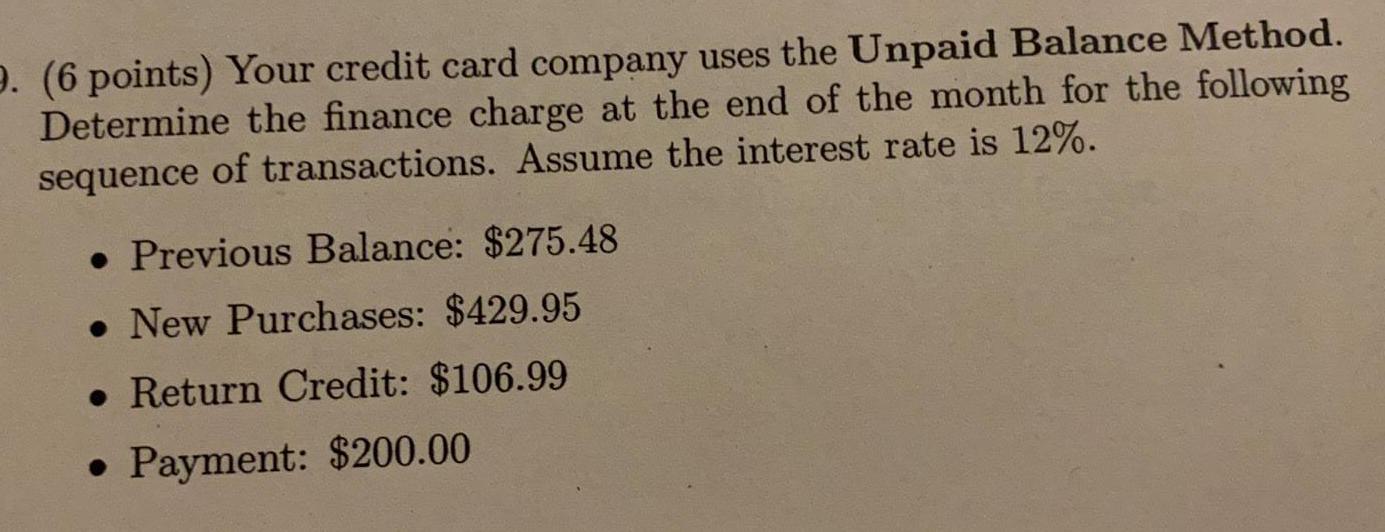
StatisticsYour credit card company uses the Unpaid Balance Method. Determine the finance charge at the end of the month for the following of transactions. Assume the interest rate is 12%.
Previous Balance: $275.48
New Purchases: $429.95 .
Return Credit: $106.99
Payment: $200.00
Math
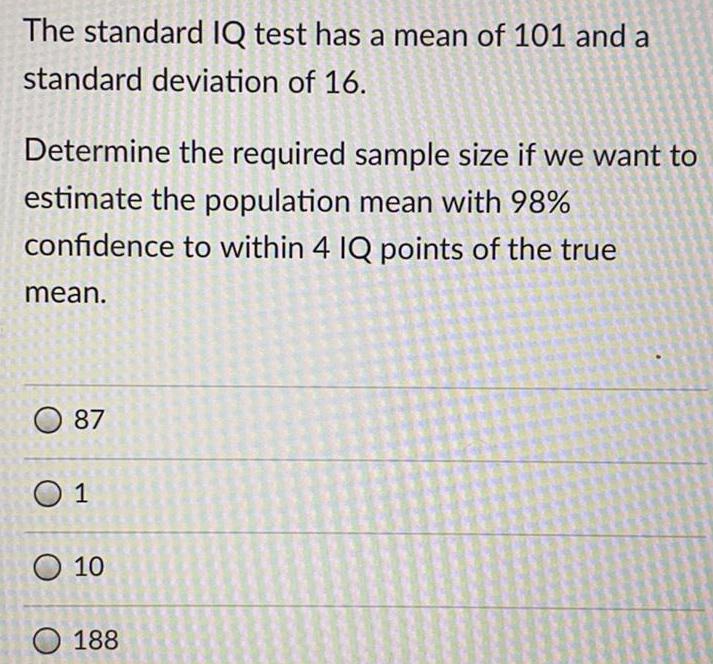
StatisticsThe standard IQ test has a mean of 101 and a standard deviation of 16.
Determine the required sample size if we want to estimate the population mean with 98% confidence to within 4 IQ points of the true mean.
87
1
10
188
Math
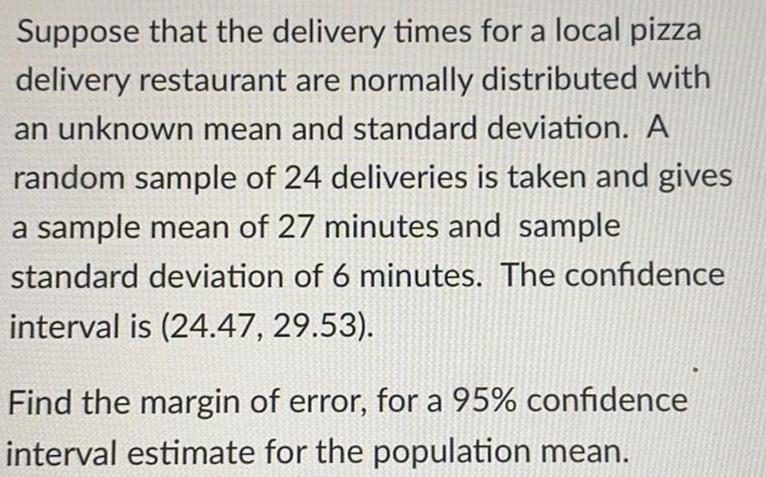
StatisticsSuppose that the delivery times for a local pizza delivery restaurant are normally distributed with an unknown mean and standard deviation. A random sample of 24 deliveries is taken and gives a sample mean of 27 minutes and sample standard deviation of 6 minutes. The confidence interval is (24.47, 29.53).
Find the margin of error, for a 95% confidence interval estimate for the population mean.